

shaunl/E+ via Getty Images
By Dewi John
On the scale of exposure to oil and gas stocks, UK “light green” equity funds are browner than US and European non-ESG funds.
This reflects a structural bias in the underlying indices. Energy is 12.5% on the FTSE 100 (comprising Shell (SHEL) and BP (BP)). The S&P 500 has an approximate 5.2% exposure to oil and gas, though that’s almost double what it was two years ago, as a result of the ballooning valuations of the sector in tandem with the reverse happening with the tech leviathans that inhabit the upper regions of the S&P.
However, UK ethical funds also reflect this structural bias towards the sector. The average oil and gas exposure of Equity UK Article 8 funds is 7.1%; Article 9, 0.1%; and that of Article 6, 10.5%. The sample size of UK-registered for sale Article 9 funds is not large, which is understandable given this regulation isn’t UK applicable, although the average weightings do, nonetheless, look plausible. We’ve nevertheless got a reasonable sample size for Article 8 funds. UK Article 8 funds—“light green” vehicles which promote ESG characteristics—have an average UK oil and gas weighting that exceeds not just their European and US equivalents, but also of the Article 6—none ESG—within these markets (see table).
Indeed, five Equity UK Article 8 funds have a higher weighting to oil and gas than the FTSE 100, the highest having a 16.3% weighting to the sector.
Despite the persistent outflows experienced by UK equities, this oil and gas tilt has likely helped the market’s performance over the past year and more. Article 9 UK funds lag the performance of their Article 8 peers, which in turn lag Article 6. However, there’s a less than 0.4 correlation between Equity UK Article 8, 12-month returns, and oil & gas portfolio exposure. OK, it’s a positive number, but pretty weak. After all, more than 60% of human DNA is identical to that of bananas, but we don’t look like these guys. It explains something but not everything—or even most things—in this instance.
There are many different flavours to ESG. In September, we looked at how the best-in-class approach was the probable driver behind sustainable Equity Global Income funds having a higher oil & gas exposure (and better 12-month performance) than their non-ESG peers. Another driver is that investors get a lower exposure to sin-stocks than the underlying market. It’s unclear as to how investors are viewing their ESG exposure—is it just a box to tick with little further due diligence being done? Is having a lower exposure to energy sufficient to tick said box? That may well be the case—for now at least. After all, the best-selling sustainable Equity UK fund over the past 12 months has a 13.8% exposure to oil and gas.
Table 1: Equity US, Europe ex-UK and UK Oil & Gas Exposure, Performance
Source: Refinitiv Lipper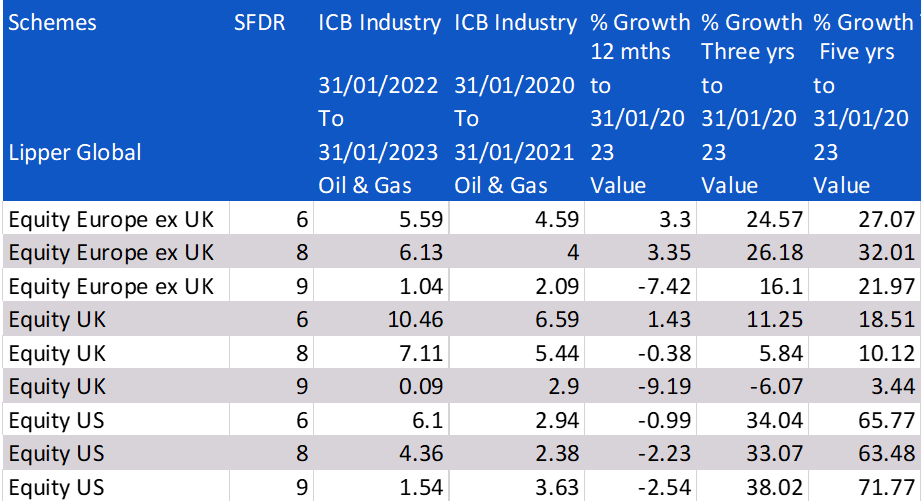
Editor’s Note: The summary bullets for this article were chosen by Seeking Alpha editors.
Be the first to comment