

BING-JHEN HONG/iStock Editorial via Getty Images
In our previous analysis of Taiwan Semiconductor Manufacturing Company Limited (NYSE:TSM), we determined the rising trend of fabless companies with the share of fabless against IDM sales forecasted to grow to 38% by 2025 from 33% in 2020 which benefits foundries through annual projected wafer shipment growth of 11.4% through 2025. We projected TSMC’s shipment growth at 8.4% in 2022 based on our capex estimates. Moreover, we analyzed the wafer pricing difference between advanced nodes such as 3nm which is estimated to be 24% higher than 5nm wafers.
As TSMC continues to transition towards higher nodes, we expected its pricing to continue increasing at 8.2% based on its historical 2020 growth rate. Lastly, as the 4th largest player in the advanced packaging market, we believe that the company’s outlook in the advanced packaging market is supported by its focus on UHD FO, InFO_oS and CoWoS packaging and forecasted its revenue growth based on the market forecast CAGR of 14.7%.
Whereas in our past coverage of Semiconductor Manufacturing International Corporation (OTCQX:SMICY), we believed that SMIC could benefit from its ties with the Chinese government through funding as it secured investments from the state for fab construction. Moreover, we expected the company to not reap the full benefits of the robust foundry growth outlook as it is faced with trade war risks such as doing business with its top customer, HiSilicon (up to 25% of revenue) following the Huawei sanctions. Finally, as the company was faced with EUV equipment restrictions, we expected its technological capabilities to be limited to matured nodes above 10nm.
Thus, we concluded it could continue lagging behind market leaders TSMC and Samsung (OTC:SSNLF) as well as losing market share through to 2025 given that the share of the total market wafer capacity below 10nm (outside its capacity) was forecasted to grow to 29.9% in 2024 from 16% in 2021.
To compare the companies, we first examine them from a geopolitical standpoint in terms of government support received through funding, tax incentives or other government assistance. We then compared them by their geographic revenue exposure to determine which has exposure to higher growth regions. Also, we looked into the government policy and sanctions against both companies.
Next, we examined the companies based on their technological capabilities such as the process node technology by revenue, ability to procure core equipment, and capacity expansion plans. Then, we forecasted each of their capacity growth based on their guided capex to project their wafer shipment growth.
Moreover, we examined their market positioning in terms of their market share in the foundry market, customer base breakdown to identify its top customers in terms of revenue and growth, revenue breakdown by end markets to determine which has higher growth potential as well as compared their wafer pricing. We forecasted its revenue growth with our ASP forecast and wafer shipment growth for both companies.
Geopolitics
To compare the two companies in terms of their geopolitical advantages, we looked into three factors: government support; geographic revenue exposure; and government sanctions.
Government Support
SMIC is supported by the Chinese government through joint venture investments for new fabs according to its annual report. For example, the company announced its Shenzhen fab in a joint venture with Shenzhen Major 2021 for $2.35 bln and holds the majority control at 55%. In Shanghai, the company has a joint venture with Shanghai Municipal People’s Government for an $8.87 bln fab and hold 51% of control over the venture. Besides that, according to its annual report, SMIC also benefits from government funding for R&D and “specific intended use” which was accounted for as operating income representing 9.3% of its revenue in 2020. Additionally, the company benefits from tax incentives from a certificate of high-tech enterprises at a 15% tax rate.
In comparison, TSMC benefits from government support in the form of tax incentives such as the ROC Statute for Industrial Innovation which was amended in 2020 where incentives for R&D were extended for 10 years. Based on its annual report, it stated that it is eligible for 10% to 15% of R&D tax credits. The company is based in the Hsinchu Science-based Industrial Park (HSIP) which allocated R&D funding to spur growth within the park. All in all, we believe that SMIC edges our TSMC in government support through tax incentives, funding, and joint venture for fab construction.
|
Capex and R&D ($ mln) |
2012 |
2013 |
2014 |
2015 |
2016 |
2017 |
2018 |
2019 |
2020 |
2021 |
Average |
|
TSMC Capex |
8,466 |
9,627 |
9,091 |
7,810 |
10,105 |
11,127 |
10,310 |
15,378 |
18,040 |
30,256 |
|
|
TSMC Revenue |
17,430 |
19,984 |
24,033 |
25,580 |
29,201 |
32,900 |
33,697 |
35,737 |
47,632 |
57,231 |
|
|
TSMC Capex as % of Revenue |
48.6% |
48.2% |
37.8% |
30.5% |
34.6% |
33.8% |
30.6% |
43.0% |
37.9% |
52.9% |
39.8% |
|
TSMC R&D Expenses |
1,389 |
1,605 |
1,790 |
1,988 |
2,194 |
2,717 |
2,806 |
3,053 |
3,894 |
4,497 |
|
|
TSMC R&D as % of Revenue |
8.0% |
8.0% |
7.4% |
7.8% |
7.5% |
8.3% |
8.3% |
8.5% |
8.2% |
7.9% |
8.0% |
|
SMIC Capex |
8,295 |
8,165 |
9,571 |
11,247 |
12,734 |
12,451 |
13,313 |
10,495 |
5,251 |
4,120 |
|
|
SMIC Revenue |
1,702 |
2,069 |
1,970 |
2,236 |
2,914 |
3,101 |
3,360 |
3,116 |
3,907 |
5,443 |
|
|
SMIC Capex as % of Revenue |
487% |
395% |
486% |
503% |
437% |
401% |
396% |
337% |
134% |
76% |
365.2% |
|
SMIC R&D Expenses |
194 |
145 |
190 |
237 |
318 |
509 |
663 |
687 |
677 |
639 |
|
|
SMIC R&D as % of Revenue |
11.4% |
7.0% |
9.6% |
10.6% |
10.9% |
16.4% |
19.7% |
22.1% |
17.3% |
11.7% |
13.7% |
Source: TSMC, SMIC, Khaveen Investments
Based on the table above, we compared both companies in terms of capex spend and R&D expenses as a % of revenue. SMIC had incurred higher capex and R&D as a % of revenue than TSMC based on its 10-year average.
Geographic Revenue Exposure
TSMC, SMIC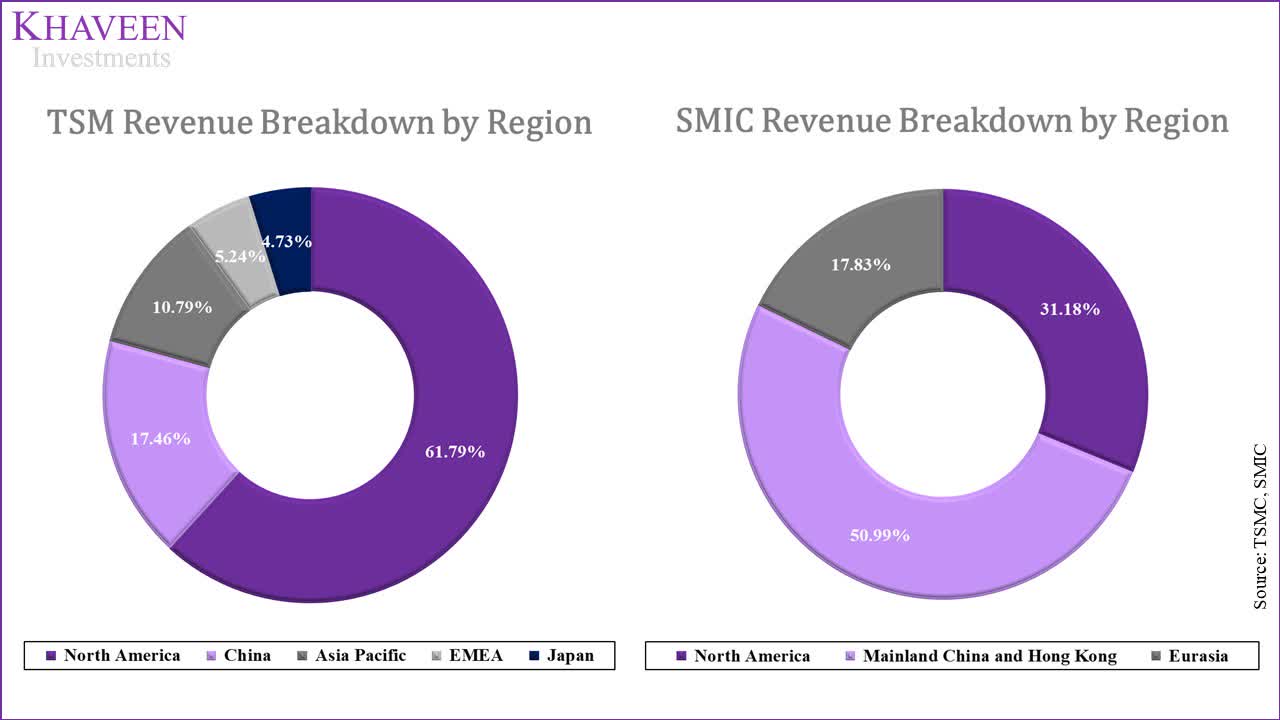
Furthermore, comparing both companies in terms of their revenue by geographic region, TSMC’s revenues are largely focused on the North American region which represents most of its revenues followed by China and the Asia Pacific. On the other hand, SMIC has a relatively greater revenue breakdown than China which is slightly more than half of its revenues.
In the past 6 years, the China semiconductor market grew robustly at an average growth rate of 14.1% which is higher than the average market growth of 8.5% followed by the Americas at 10.9%. According to IMARC Group, the China semiconductor market is forecasted to grow at a CAGR of 12.8% through 2028 compared to 8.6% for the total market growth. Thus, we believe SMIC’s greater exposure to China could provide it with a benefit compared to TSMC.
Sanctions
|
Sanctions |
Event |
TSMC |
|
2019 |
Dutch government declined to renew a license for ASML to ship tools to SMIC |
|
|
2020 |
SMIC included in US Department of Commerce’s entity list |
|
|
2021 |
Executive order restricting Americans from investing in ‘Chinese Military-Industrial Complex Companies’ |
|
|
2022 |
US secretary of commerce could take action against Chinese companies dealing US sanctions on Russia. |
TSMC halts shipments to Russia |
Source: SMIC, Reuters, New York Times, Washington Post, Khaveen Investments
In 2020, the company was placed on the US Departments of Commerce entity list for allegations of ties to the Chinese military. This follows after the previous year where Dutch EUV equipment maker was barred from the government to obtain licenses to sell to China. More recently, the company along with other Chinese companies was threatened by the US government not to export to Russia or face US sanctions. Meanwhile, TSMC was reported to have suspended shipments to Russia. We believe that the lingering sanction risk is a negative for SMIC against TSMC. Due to the sanctions, we believe this could negatively affect SMIC the most due to its sanctions relating to its equipment supply which could make it lose out on the capacity expansion of advanced nodes. For TSMC, we do not expect the halting of doing business with Russia to negatively impact it to a large extent as its EMEA revenue only represents 4% of the total. In comparison, SMIC’s Eurasia revenue is 17.8%.
Overall, we believe that SMIC trumps TSMC in terms of government support as it derives government funding, joint ventures for fab constructions and tax incentives. Additionally, the company’s revenue breakdown shows a larger exposure to the China market which is expected to grow at a higher rate than the total market. Though, we expect the sanctions to bite SMIC, especially with equipment export controls.
|
Geopolitics Factor |
Advantage |
|
Government Support |
SMIC |
|
Geographic Revenue |
SMIC |
|
Sanctions |
TSMC |
|
Overall |
SMIC |
Source: Khaveen Investments
Technological Capabilities
To compare the two companies in terms of their technological advantages, we looked into three technological factors: process node capability; core equipment; and capacity expansion.
Process Node Capability
TSMC, SMIC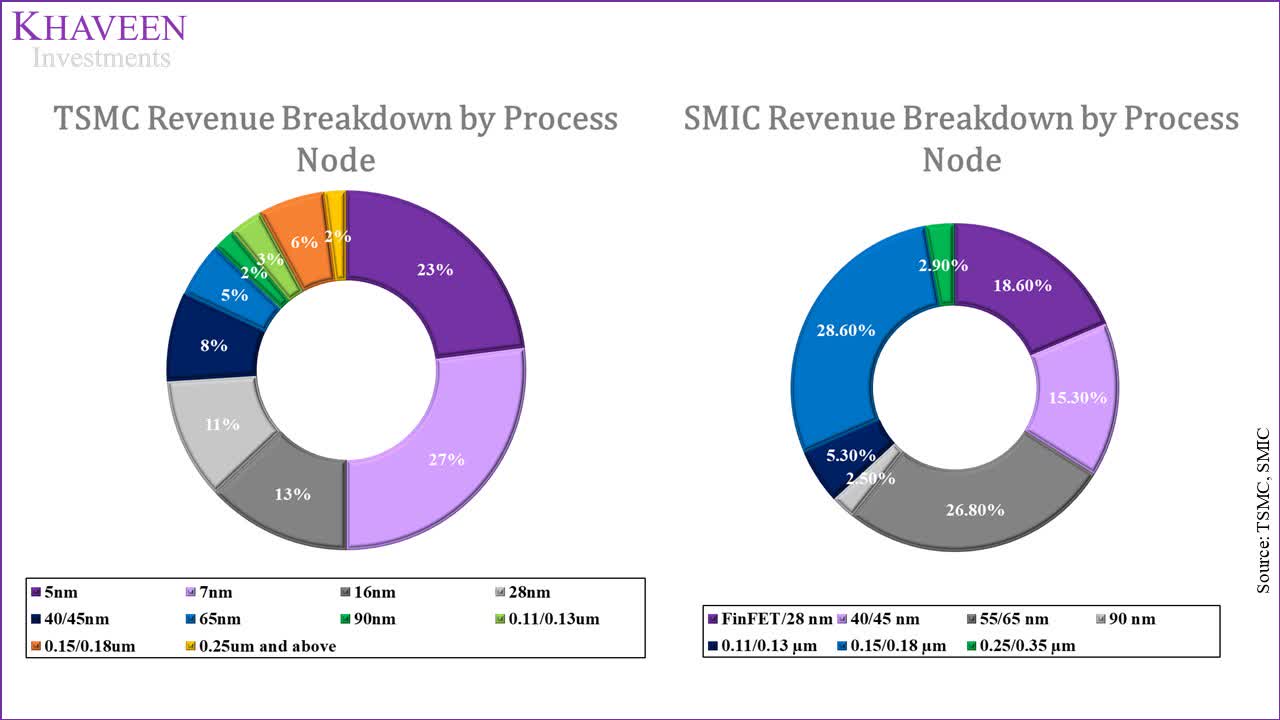
In the chart above of the revenue breakdown by process node technology, TSMC had derived 50% of its revenues from advanced process technology with nodes below 7nm. On the other hand, SMIC‘s revenue breakdown shows its largest node being the 0.15/0.18 micrometer followed by 55/65nm as its nodes with the largest share of the revenue. The most advanced node in its breakdown is its FinFET 28nm node compared to TSMC’s 5nm process.
According to IC Insights, the firm forecasted the share of wafer capacity by node capacity of nodes below 10nm to increase from 16% in 2021 to 30% in 2024 whereas the capacity of nodes between 10nm to 20nm to decline from 35.5% to 26.2% by 2024. Thus, we believe this indicates an advantage to TSMC compared to SMIC in terms of its advanced process technology.
Core Equipment
Furthermore, SMIC lacks core equipment for the wafer fabrication of advanced nodes. Following the sanctions, the company faces an overseas equipment and materials procurement risk. In our previous analysis, we explained the limitation of SMIC in terms of wafer fabrication capabilities without EUV systems from ASML to produce leading-edge node chips. This resulted in the company being reliant on matured nodes. In contrast, TSMC is a long-standing partner of ASML and was reportedly entering production for its N3E nodes ahead of schedule. We believe that due to SMIC’s lack of core equipment and uncertainty of procuring equipment required for the production of leading-edge chips, TSMC could be superior to SMIC in terms of process node leadership.
Capacity
Moreover, in terms of capacity expansion, SMIC announced that it is expanding across China in Shanghai, Shenzhen and Beijing. To forecast SMIC’s capacity growth, we derived its average historical incremental wafer capacity/capex of 172.9 with capex of $5 bln based on management guidance for 2022. From its wafer capacity, we assumed a 3-year average utilization rate to derive our wafer shipments projections through 2026.
|
SMIC Revenue Projections ($ mln) |
2020 |
2021 |
2022F |
2023F |
2024F |
2025F |
2026F |
|
Annual Wafer Capacity (‘000s 8-inch equivalents) (‘a’) |
6,249 |
7,452 |
8,317 |
9,181 |
10,046 |
10,911 |
11,775 |
|
Growth % |
16.1% |
19.3% |
11.6% |
10.4% |
9.4% |
8.6% |
7.9% |
|
Incremental Wafer Capacity (‘b’) |
867 |
1203 |
865 |
865 |
865 |
865 |
865 |
|
Capex (‘c’) |
5,251 |
6,655 |
5,000 |
5,000 |
5,000 |
5,000 |
5,000 |
|
Incremental Wafer Capacity/Capex (‘d’) |
0.2 |
0.2 |
0.2 |
0.2 |
0.2 |
0.2 |
0.2 |
|
Utilization (‘e’) |
95.50% |
99.40% |
97.90% |
97.90% |
97.90% |
97.90% |
97.90% |
|
Wafer Shipments (‘f’) |
5,968 |
7,407 |
8,142 |
8,989 |
9,835 |
10,682 |
11,528 |
|
Growth % |
12.2% |
24.1% |
9.9% |
10.4% |
9.4% |
8.6% |
7.9% |
*b = c x d
*f = a x e
Source: SMIC, Khaveen Investments
For TSMC, the company is expanding with its Arizona facility and expansion to its facilities in Taiwan. In its latest earnings briefing, the company guided its capex for 2022 to increase to between $42 to $44 bln. We forecasted its wafer capacity growth based on its 2-year Average Incremental Wafer/Capex of 0.037 and a utilization rate assumption based on a 2-year average of 97% to derive its wafer shipment growth. Compared to SMIC, TSMC had a higher wafer capacity than SMIC.
|
TSMC Wafer Projections |
2020 |
2021 |
2022F |
2023F |
2024F |
2025F |
2026F |
|
Annual Capacity (‘000s 12-inch equivalents) (‘a’) |
13,189 |
14,179 |
15,788 |
17,396 |
19,005 |
20,614 |
22,222 |
|
Growth % |
6.1% |
7.5% |
11.3% |
10.2% |
9.2% |
8.5% |
7.8% |
|
Capex ($ mln) (‘b’) |
18,040 |
30,256 |
43,000 |
43,000 |
43,000 |
43,000 |
43,000 |
|
Growth % |
17.3% |
67.7% |
42.1% |
0.0% |
0.0% |
0.0% |
0.0% |
|
Incremental Wafer Increase (‘c’) |
760 |
990 |
1609 |
1609 |
1609 |
1609 |
1609 |
|
Average Incremental Wafer/Capex (‘d’) |
0.042 |
0.033 |
0.037 |
0.037 |
0.037 |
0.037 |
0.037 |
|
Billing utilization rate (‘e’) |
94% |
100% |
97% |
97% |
97% |
97% |
97% |
|
TSMC Annual Wafer Shipments (‘000s 12-inch equivalents) (‘f’) |
12,398 |
14,179 |
15,314 |
16,874 |
18,435 |
19,995 |
21,556 |
|
Growth % |
23.1% |
14.4% |
8.0% |
10.2% |
9.2% |
8.5% |
7.8% |
*c = b x d
*f = a x e
Source: TSMC, Khaveen Investments
Overall, we determined that TSMC derives an advantage when it comes to technological capabilities with leading-edge nodes and stands to benefit from the rise of process nodes below 10nm through 2024. Moreover, we expect TSMC’s partnership and ability to obtain core equipment is an advantage as SMIC is sanctioned by the Dutch government for the sale of EUV systems for capacity expansion at the leading edge. Moreover, TSMC has a higher wafer capacity than SMIC which we believe supports its ability to obtain larger customers requiring more advanced nodes and to develop its process node capability for customers.
|
Technology Factor |
Advantage |
|
Process Node |
TSMC |
|
Core Equipment |
TSMC |
|
Capacity |
SMIC |
|
Overall |
TSMC |
Source: Khaveen Investments
Market Dominance
To compare the two companies in terms of their market dominance, we looked into four factors: foundry market share; top customers; revenue by end markets; and wafer pricing.
Foundry Market Share
TrendForce, Khaveen Investments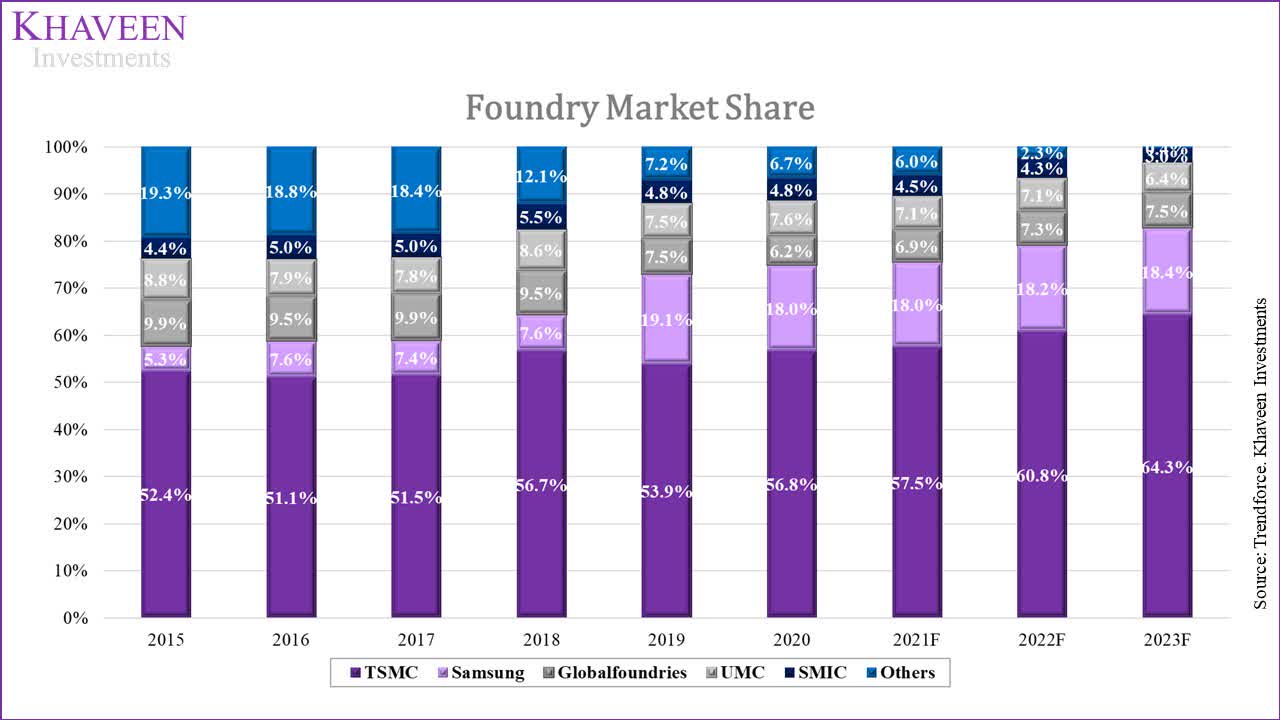
In terms of market share, TSMC easily beats our SMIC as it is the foundry market leader. This is followed by Samsung, GlobalFoundries and UMC while SMIC is the fifth-largest company by share according to data from TrendForce.
|
Gross Margins |
2017 |
2018 |
2019 |
2020 |
2021 |
Average |
|
TSMC |
50.62% |
48.53% |
46.36% |
53.10% |
51.63% |
50.0% |
|
Margins Growth % |
1% |
-4% |
-4% |
15% |
-3% |
0.8% |
|
SMIC |
23.88% |
22.22% |
20.62% |
23.57% |
30.79% |
24.2% |
|
Margins Growth % |
-18% |
-7% |
-7% |
14% |
31% |
2.5% |
|
TSMC Revenue |
32,900 |
33,697 |
35,737 |
47,632 |
57,231 |
|
|
Revenue Growth % |
12.7% |
2.4% |
6.1% |
33.3% |
20.2% |
14.9% |
|
SMIC Revenue |
3,101 |
3,360 |
3,116 |
3,907 |
5,443 |
|
|
Revenue Growth % |
6.4% |
8.3% |
-7.3% |
25.4% |
39.3% |
14.4% |
Source: TSMC, SMIC, Khaveen Investments
In terms of margins, TSMC also edges out SMIC with a superior gross margin on a 5-year average. However, SMIC had higher average margins growth during the period compared to TSMC. Moreover, TSMC had higher slightly average revenue growth than SMIC in the past 5 years.
Top Customers
|
TSMC Top Customers |
Revenue Share % |
Revenue (‘TTM’) |
Revenue Growth % (5-year) |
SMIC Top Customers |
Revenue (‘TTM’) |
Revenue Growth % (5-year) |
|
Apple (AAPL) |
25.93% |
378323 |
11.64% |
HiSilicon |
1,000 |
|
|
MediaTek (OTCPK:MDTKF) |
5.80% |
17260 |
12.36% |
Datang Telecom |
185.3 |
-32.48% |
|
AMD (AMD) |
4.36% |
16434 |
30.64% |
Qualcomm |
36036 |
8.67% |
|
Qualcomm (QCOM) |
3.90% |
36036 |
8.67% |
Texas Instruments (TXN) |
18,344 |
6.53% |
|
Broadcom (AVGO) |
3.77% |
28501 |
12.80% |
Broadcom |
28501 |
12.80% |
|
NVIDIA (NVDA) |
2.83% |
26914 |
31.25% |
Gigadevice |
697 |
30.49% |
|
Sony (SONY) |
2.54% |
70,623 |
5.63% |
|||
|
Marvell (MRVL) |
1.39% |
4,464 |
14.16% |
|||
|
STMicro (STM) |
1.38% |
12729 |
12.85% |
|||
|
Analog Devices (ADI) |
1.06% |
8,444 |
18.35% |
|||
|
Intel (INTC) |
0.84% |
79024 |
5.88% |
|||
|
Average |
– |
61704.73 |
14.9% |
Average |
14,127 |
5.2% |
Source: TSMC, SMIC, DigiTimes, Bloomberg, TechHQ, BBC, Khaveen Investments
For TSMC, the company’s top customer is Apple which represents over a quarter of its revenues followed by MediaTek, AMD and Qualcomm. On the other hand, according to SMIC’s report, its top 5 customers account for 33.3% of revenue. Its customers include HiSilicon which was affected by the Huawei sanctions, Datang Telecom, Qualcomm, Broadcom, Texas Instruments, Gigadevice and Unisoc. Based on their revenues, TSMC’s top customers are not only larger but also have higher growth than SMIC’s customers. Thus, we believe this highlights an advantage for TSMC with its superior customer base.
Revenue by End Markets
TSMC, SMIC, Khaveen Investments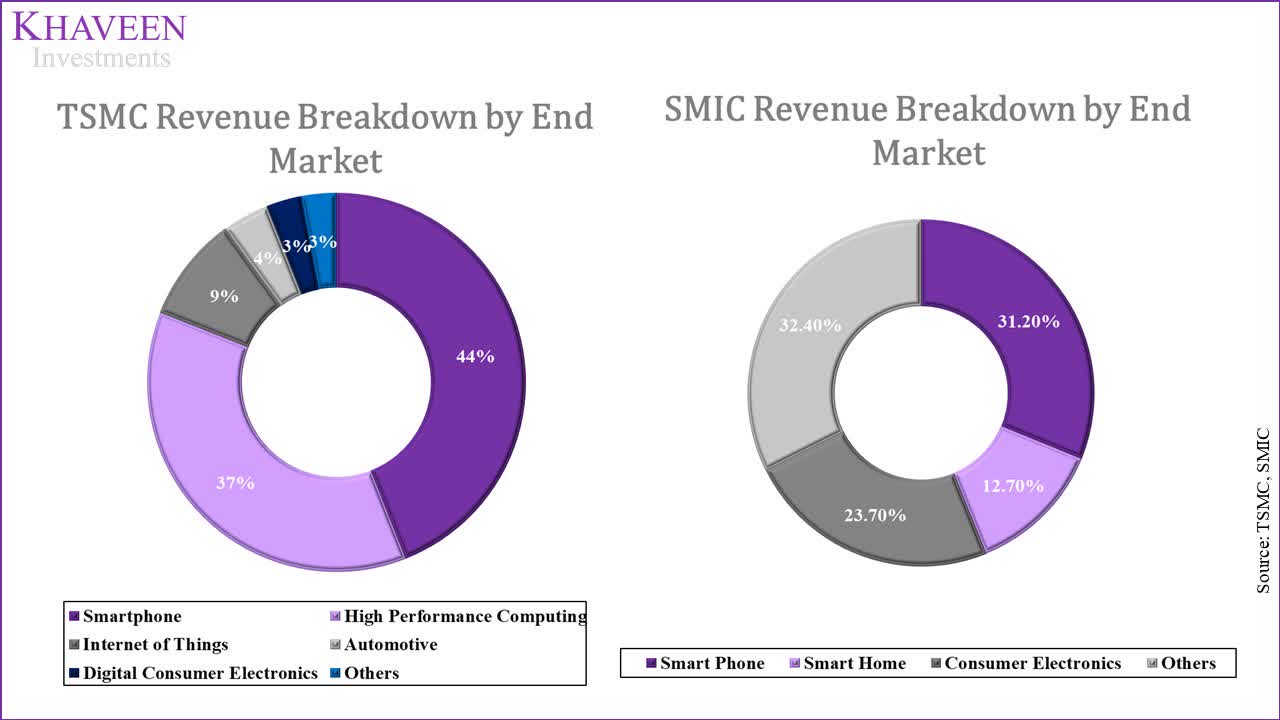
|
Net Revenue by Platform (TSMC) |
Market Forecast CAGR |
Net Revenue by Platform (SMIC) |
Market Forecast CAGR |
|
Smartphone |
6.85% |
Smart Phone |
6.85% |
|
High-Performance Computing |
7.90% |
Smart Home |
6.8% |
|
Internet of Things |
6.00% |
Consumer Electronics |
5.3% |
|
Automotive |
12.30% |
||
|
Digital Consumer Electronics |
5.30% |
Source: Market Data Forecast, IC Insights, Markets and Markets, Omdia, Fortune Business Insights, Khaveen Investments
Next, comparing both companies based on their revenue by end market, TSMC’s largest end market is the smartphone market while for SMIC it is the Others followed the smartphones. However, TSMC’s second-largest market is high-performance computing. According to its annual report, this includes products encompassing PCs, tablets, game consoles, servers, and base stations such as CPUs, GPUs, NPUs, AI accelerators, and related ASICs. Besides that, we compiled the market forecast CAGR for each of the companies’ end markets. We see TSMC standing to benefit from end markets with high forecasted growth including automotive and HPC.
Wafer Pricing
|
TSMC vs SMIC Wafer Pricing ($) |
2018 |
2019 |
2020 |
2021 |
2022F |
2023F |
2024F |
2025F |
|
TSMC ASP per wafer |
2,769 |
3,079 |
3,385 |
3,571 |
4,107 |
4,420 |
4,712 |
4,977 |
|
Growth % |
11% |
10% |
5% |
15% |
8% |
7% |
6% |
|
|
SMIC ASP per wafer |
690 |
586 |
655 |
735 |
845 |
888 |
924 |
952 |
|
Growth % |
-15% |
12% |
12% |
15% |
5% |
4% |
3% |
Source: TSMC, SMIC, Khaveen Investments
Lastly, in terms of wafer pricing, TSMC also shows a lead with higher pricing than SMIC and competitors. According to Mirae Asset Management, the number of companies capable of producing chips at the leading edge is only limited to a few including Samsung, TSMC and Intel. We believe this provides a higher power over buyers in terms of pricing power.
We projected TSMC’s total foundry revenue with our derived shipment growth forecast from the point above with our ASP growth assumption of 15% in 2022 as the TSMC was reported by DigiTimes to increase its wafer pricing quotes by 10% to 20% in 2022 followed by a 5-year average growth of 7.62% but tapering down by 1% as a conservative assumption.
|
TSMC Foundry Revenue Projections ($ mln) |
2019 |
2020 |
2021 |
2022F |
2023F |
2024F |
2025F |
2026F |
|
TSMC Annual Wafer Shipments (‘000s 12-inch equivalents) (‘a’) |
10,068 |
12,398 |
14,179 |
15,314 |
16,874 |
18,435 |
19,995 |
21,556 |
|
TSMC Wafer shipments Growth % |
-6.36% |
23.14% |
14.37% |
8.01% |
10.19% |
9.25% |
8.46% |
7.80% |
|
TSMC ASP per wafer (‘b’) |
3,079 |
3,385 |
3,571 |
4,107 |
4,420 |
4,712 |
4,977 |
5,207 |
|
Average selling price |
6.90% |
8.20% |
5.49% |
15.00% |
7.62% |
6.62% |
5.62% |
4.62% |
|
TSMC Foundry Revenues (‘c’) |
31,004 |
41,968 |
50,633 |
62,889 |
74,577 |
86,866 |
99,512 |
112,233 |
|
Foundry revenue growth |
4.14% |
35.36% |
20.65% |
24.2% |
18.6% |
16.5% |
14.6% |
12.8% |
* c = a x b
Source: TSMC, Khaveen Investments
For SMIC, we forecasted its wafer ASPs in 2022 similarly to the wafer pricing growth assumption for TSMC followed by a 5-year average growth rate tapering by 1% per year.
|
SMIC Revenue Projections ($ mln) |
2019 |
2020 |
2021 |
2022F |
2023F |
2024F |
2025F |
2026F |
|
Wafer Shipments (‘a’) |
5,317 |
5,968 |
7,407 |
8,142 |
8,989 |
9,835 |
10,682 |
11,528 |
|
Growth % |
9.2% |
12.2% |
24.1% |
9.9% |
10.4% |
9.4% |
8.6% |
7.9% |
|
Wafer ASPs (‘b’) |
585.9 |
654.7 |
734.8 |
845 |
888 |
924 |
952 |
972 |
|
Growth % |
-15.1% |
11.7% |
12.2% |
15.00% |
5.1% |
4.1% |
3.1% |
2.1% |
|
Revenue (‘c’) |
3,116 |
3,907 |
5,443 |
6,880 |
7,980 |
9,087 |
10,171 |
11,204 |
|
Growth % |
-7.3% |
25.4% |
39.3% |
26.4% |
16.0% |
13.9% |
11.9% |
10.2% |
* c = a x b
Source: SMIC, Khaveen Investments
To conclude, TSMC dominates the foundry market while SMIC is at a distant fifth position. TSMC’s top customers include some of the largest semicon companies and are larger with higher growth rates than SMIC’s customers. In terms of end markets, TSMC has exposure to HPC and automotive semicon markets which are fast-growing markets compared to SMIC’s markets. Lastly, TSMC commands a price premium on its wafers which we believe is advantageous to the company’s top line.
|
Market Dominance Factor |
Advantage |
|
Foundry market share |
TSMC |
|
Top customers |
TSMC |
|
End Markets |
TSMC |
|
Wafer Pricing |
TSMC |
|
Overall |
TSMC |
Source: Khaveen Investments
Risk: Capacity Constraints
We believe both companies as semiconductor foundries are faced with supply constraints risks in the wake of the semiconductor shortage. According to their quarterly releases, both companies were running at full capacity in 2021. We further believe this could be a constraint for its growth as they must build up capacity in order to fulfil their customers’ demands. As it takes time for these companies to complete their expansion, these companies may not be able to fully benefit from the surge in customer orders as they are supply-constrained. We believe this limits its growth through supply growth which may impact its revenue growth outlook.
Valuation
TSMC
We updated our revenue projections for TSMC with full-year 2021 revenues and our projections for its foundry revenues through 2026. Compared to our previous analysis, our updated projections are higher mainly due to a higher ASP growth forecast of 15% based on the reported TSMC price increase by DigiTimes compared to 8.2% based on the historical average in 2022.
|
TSMC Revenue Projections ($ mln) |
2020 |
2021 |
2022F |
2023F |
2024F |
2025F |
2026F |
|
Wafer Revenue |
41,968 |
50,633 |
62,889 |
74,577 |
86,866 |
99,512 |
112,233 |
|
Growth % |
35.4% |
20.6% |
24.2% |
18.6% |
16.5% |
14.6% |
12.8% |
|
Others |
1,864 |
2,239 |
2,573 |
2,957 |
3,398 |
3,905 |
4,488 |
|
Growth % |
-61% |
20.2% |
14.9% |
14.9% |
14.9% |
14.9% |
14.9% |
|
Packaging |
3,800 |
4,359 |
4,999 |
5,734 |
6,577 |
7,544 |
8,653 |
|
Growth % |
14.7% |
14.7% |
14.7% |
14.7% |
14.7% |
14.7% |
|
|
Total revenues |
47,632 |
57,231 |
70,462 |
83,268 |
96,841 |
110,961 |
125,373 |
|
Total Growth % |
33.3% |
20.2% |
23.1% |
18.2% |
16.3% |
14.6% |
13.0% |
Source: TSMC, Khaveen Investments
Our valuation for TSMC is based on a DCF analysis as we expect the company to maintain its strong cash flow generation abilities. We based its terminal value on the foundry industry EV/EBITDA average.
Seeking Alpha, Khaveen Investments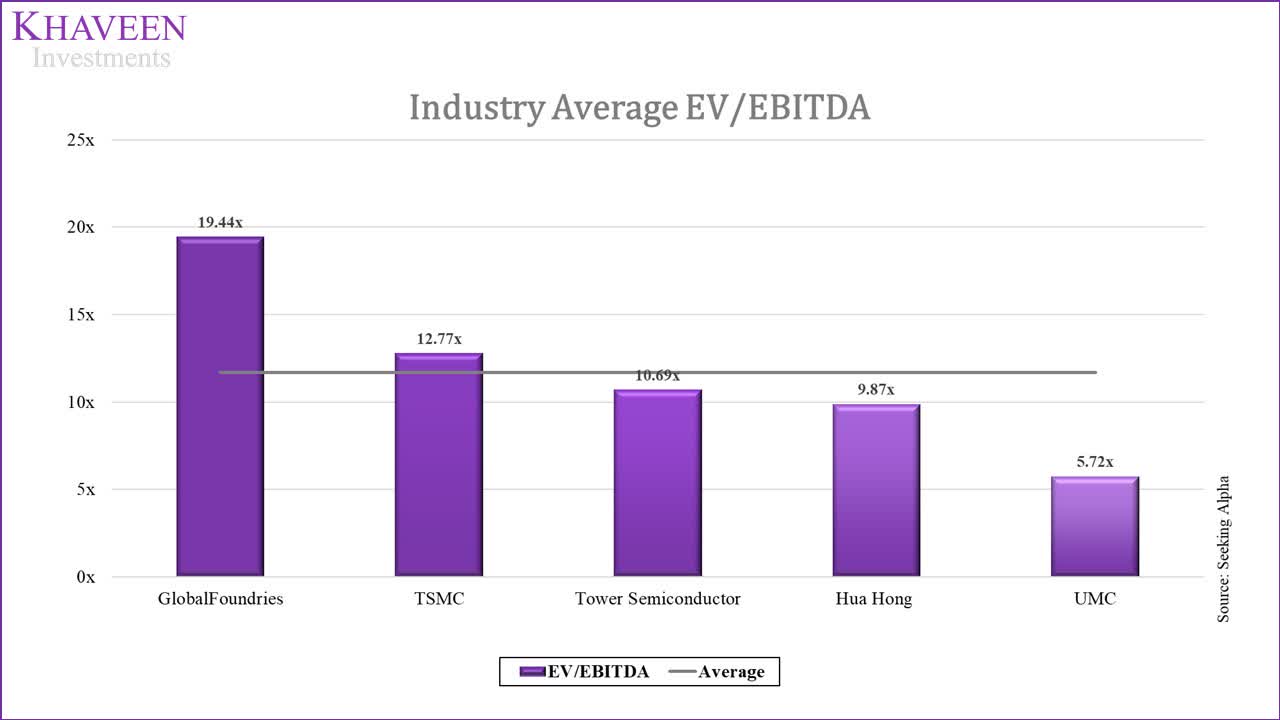
Based on a discount rate of 9.8% (Company’s WACC), our model shows its shares are undervalued by 33%.
Khaveen Investments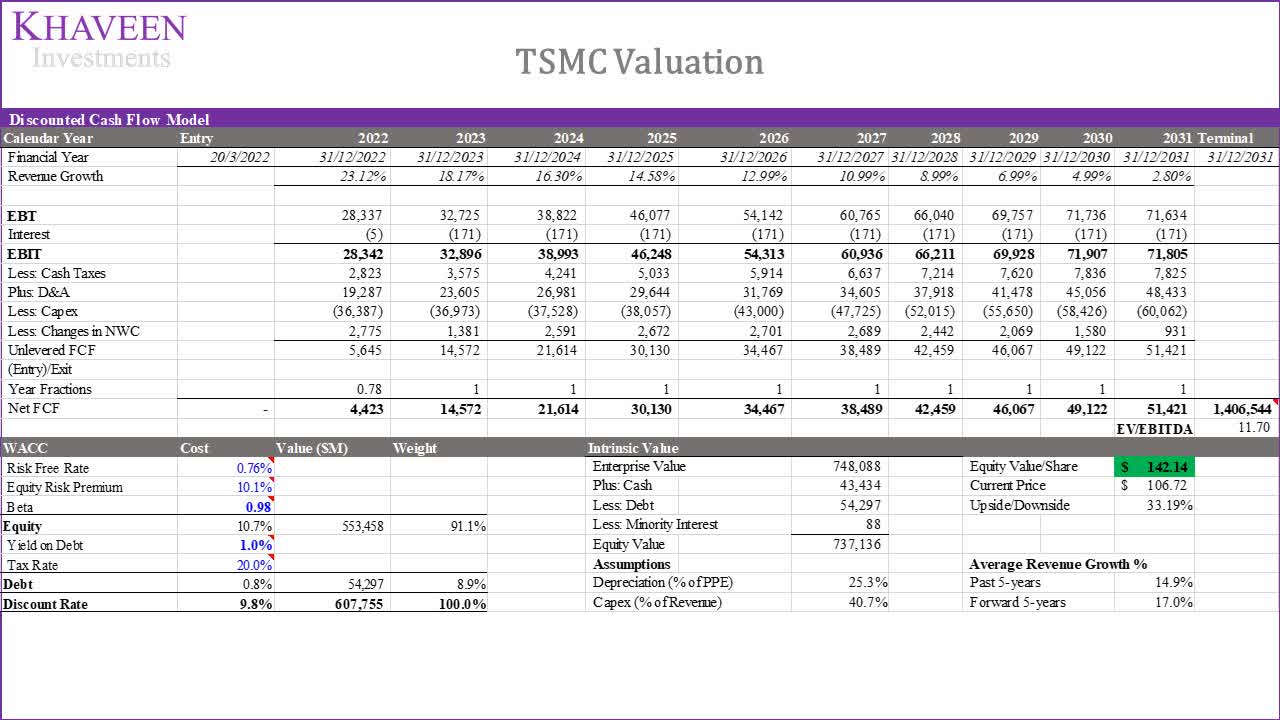
SMIC
For SMIC, we also updated our revenues projections with 2021 results in the table below with our updated revenue projections through 2026.
|
SMIC Revenue Projections ($ mln) |
2019 |
2020 |
2021 |
2022F |
2023F |
2024F |
2025F |
2026F |
|
Revenue |
3,116 |
3,907 |
5,443 |
6,880 |
7,980 |
9,087 |
10,171 |
11,204 |
|
Growth % |
-7.3% |
25.4% |
39.3% |
26.4% |
16.0% |
13.9% |
11.9% |
10.2% |
Source: SMIC, Khaveen Investments
We valued the company with a DCF as we expect it to reach positive cash flows in the future. Our terminal value is based on a perpetual growth terminal value with our FCF forecast in 2031 as the numerator and the denominator as its discount rate (3.4%) less our growth rate assumption in 2031 based on long-term GDP growth (2.8%). Our model shows, its shares are undervalued by 56%.
Khaveen Investments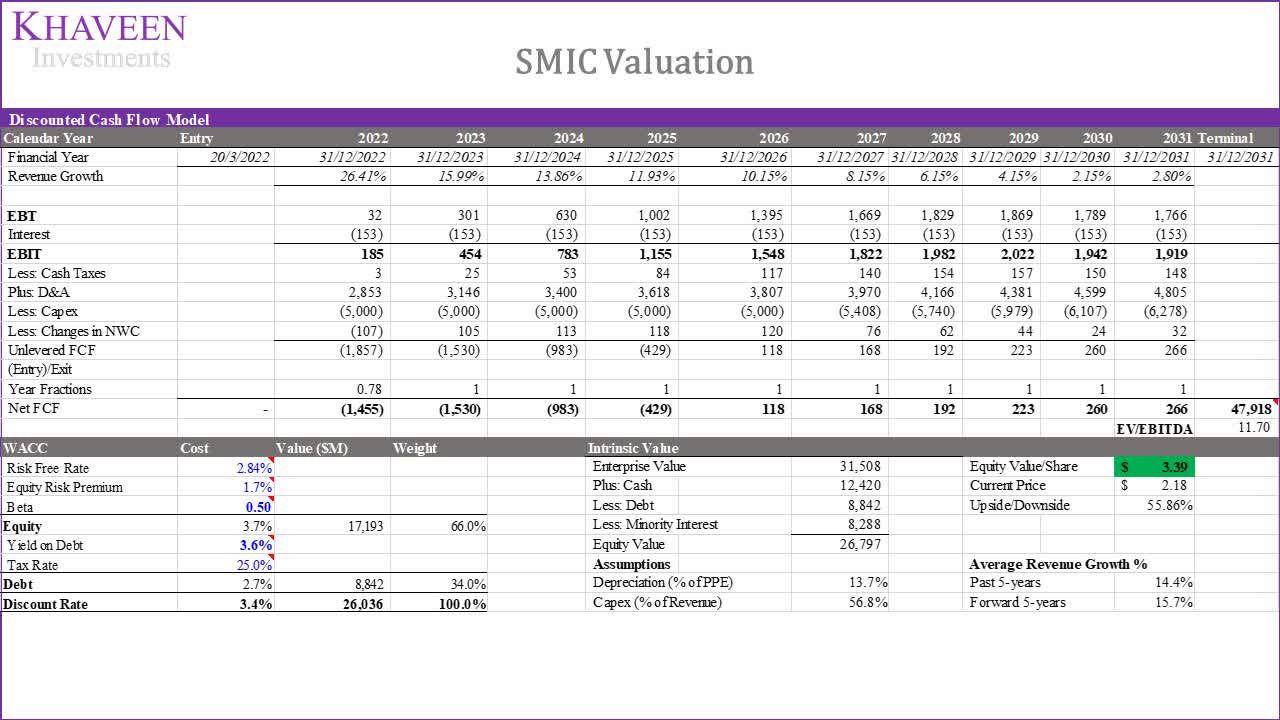
|
Company |
Target Price |
Upside |
|
TSMC |
$142.14 |
33.19% |
|
SMIC |
$3.39 |
55.86% |
Source: Khaveen Investments
Verdict
|
Factor |
Advantage |
|
Geopolitics |
SMIC |
|
Government Support |
SMIC |
|
Geographic Revenue |
SMIC |
|
Sanctions |
TSMC |
|
Technology Comparison |
TSMC |
|
Process Node |
TSMC |
|
Core Equipment |
TSMC |
|
Capacity Expansion |
SMIC |
|
Market Dominance |
TSMC |
|
Foundry market share |
TSMC |
|
Top customers |
TSMC |
|
End Markets |
TSMC |
|
Wafer Pricing |
TSMC |
|
Valuation |
SMIC |
|
Overall |
TSMC |
Source: Khaveen Investments
To summarize, we compared TSMC and SMIC in terms of three main factors which were their geopolitical, technological and market dominance advantages. For the geopolitical factor, we determined that SMIC edges our TSMC in this area as it has strong government support such as government funding for R&D, joint ventures for capacity expansion and tax incentives. It also has more exposure to the fast-growing Chinese semiconductor market at a higher market forecasted CAGR of 12.8% through 2028 higher than the total market growth of 8.6%, accounting for half of its revenues. However, we believe it loses out to TSMC when it comes to government sanctions as SMIC had been hit the hardest such as being placed on the US’s entity watch list and sanctioned by the Dutch government for ASML EUV equipment purchases. Notwithstanding, we believe TSMC wins over SMIC in the other two factors.
In terms of its technological capabilities, we determine that TSMC is superior due to its advanced process technology at the leading edge below 7nm nodes while SMIC mainly manufactures based on 28nm nodes. We believe SMIC’s sanctions could be a headwind for it to obtain core equipment to enhance its technological capabilities while TSMC has a long-standing partnership with ASML. Though, we projected SMIC’s wafer growth (9.9%) based on its capex to be higher than TSMC (8%).
Finally, we believe that TSMC is superior to SMIC in terms of its market dominance accounting for 57% of the market share while SMIC’s share is below 5%. TSMC’s top customers are larger than SMIC with average revenue of more than 4 times higher than SMIC and average revenue growth of more than twice that of SMIC’s. TSMC is also exposed to high growth end markets such as automotive (12.3% CAGR) and higher performance computing (7.9% CAGR) than all of SMIC’s end markets. Lastly, TSMC also commands superior wafer pricing almost 5 times higher than SMIC. Therefore, we believe that TSMC is superior to SMIC in the foundry market. In terms of valuation, however, we derived a higher upside for SMIC shares.
Overall, we believe TSMC is the better foundry than SMIC and rate TSMC as a Strong Buy with a target price of $142.14 and SMIC a Strong Buy with a target price of $3.39 (HKD26.60).
Be the first to comment