

SimonSkafar/E+ via Getty Images
Tractor Supply Company (NASDAQ:TSCO) is a company with a strong operational track record that has greatly rewarded investors. It is highly efficient at growing profits and maintains a measurable competitive advantage. Nonetheless, the price seems to be overextended slightly. As a result, we rate the stock as neutral.
Industry Overview
TSCO operates in the retail industry, which is expected to grow at a CAGR of approximately 4.5% over the next 5 years. Although not the most exciting industry growth rate out there, it demonstrates that the industry is viable and in a healthy state.
Furthermore, the retail industry is quite fragmented. This means that there is an opportunity for larger players such as TSCO to consolidate the industry through smart acquisitions. TSCO currently has a 7% share of what it considers its total addressable market:
Investor Presentation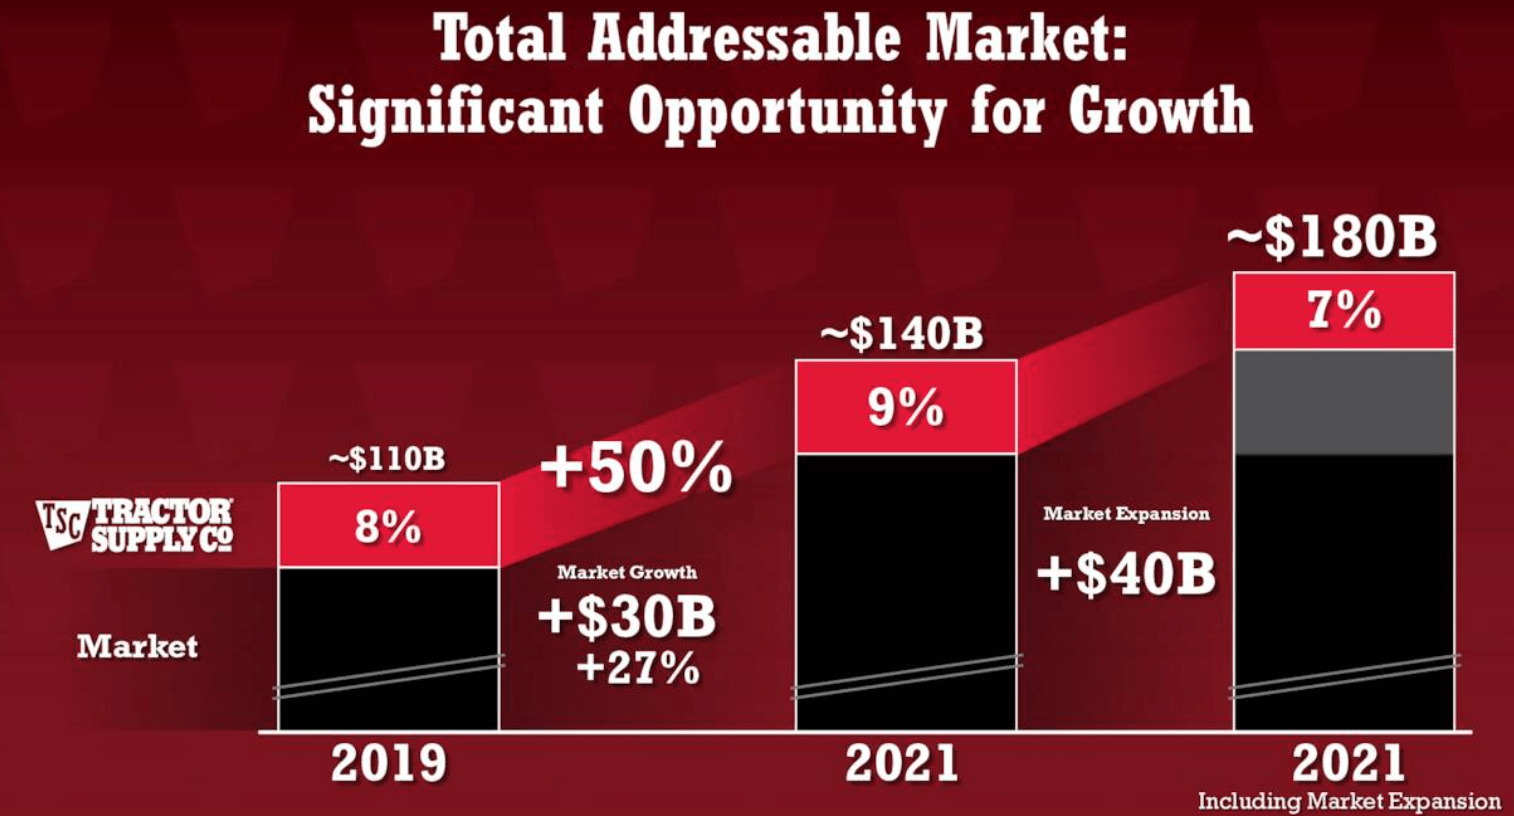
Excluding the market expansion, we can see that it has been gaining market share, as it grew from 8% in 2019 to 9% in 2021. Furthermore, having a small market share is a great catalyst for long-term growth because it gives the company a lot of runway to do so. This, of course, is if TSCO continues to execute correctly going forward.
One of its growth strategies includes increasing its number of stores to 2,700, up from its previous target of 2,500. Currently, it operates 2,003 stores, up 178 stores from the previous year. It plans to open stores at a pace of 75-80 per year, meaning it will achieve its target within a decade.
However, the fastest-growing segment in retail is e-commerce, primarily driven by the increasing reliance on smartphones. Luckily, TSCO’s percentage of sales that come from e-commerce currently stands at 7%, above the average of its peers but still lagging a few.
Investor Presentation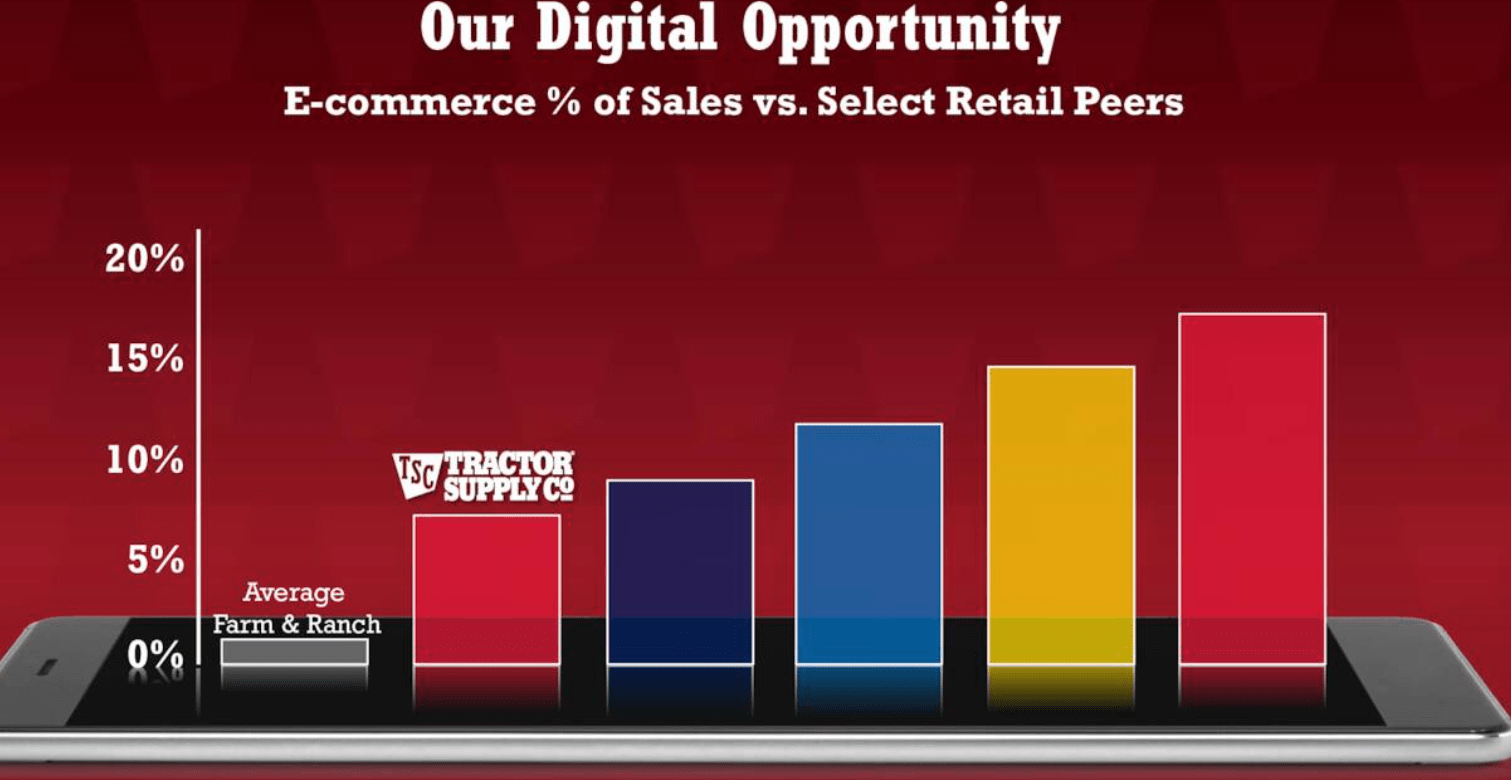
The company has set a target of generating over 15% of its revenue from e-commerce going forward. This seems achievable since e-commerce growth for TSCO has been in the double digits for 38 quarters. Including this focus on e-commerce has proven to be an important growth catalyst as well since 1.4 million first-time customers in 2021 came through its digital channel.
Next, we will compare how TSCO stacks up against 2 of its biggest competitors – Lowe’s (LOW) and Home Depot (HD). The metrics we will use are operating margins, return on invested capital, and free cash flow. We want to analyze the overall trends of each metric to see which company is performing best and to see if they are reasonably predictable.
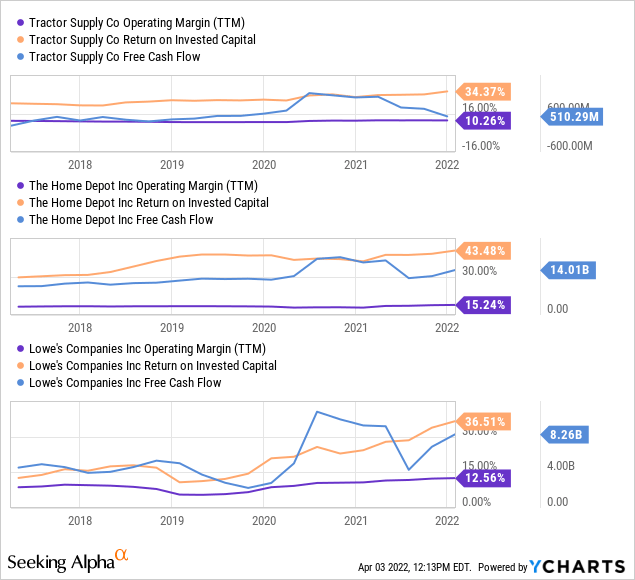
Overall, all 3 companies have very similar trends with similar margins, efficiency (measured by ROIC), and free cash flow growth. However, TSCO has relatively underperformed, with a lower operating margin and ROIC.
Nevertheless, it’s not that far away from LOW and HD, and it likely has the capability to eventually catch up or at least close the gap. If TSCO achieves margin expansion, it would be a growth catalyst because it would increase profitability and potentially lead to a multiple expansion if macroeconomic conditions remain favorable.
The main risks TSCO and the industry as a whole face at this current moment are supply chain issues and inflation. It’s no secret that the supply chain has been the main catalyst for inflation with the recent conflict in Ukraine only making things worse. This has led to a yield curve inversion which tends to precede recessions. Although we don’t currently believe a recession is in the cards for 2022, things could be different in 2023 or 2024.
As a result, it is important that investors monitor the economy and recognize that current earnings estimates may potentially be revised downwards going forward.
DuPont Analysis
When taking a look at TSCO’s return on equity, we can see that the trend has been increasing upwards at an attractive pace. If you’ve read 100 Baggers by Christopher Mayer, or if you have a good understanding of stocks, you probably know that stocks with a high return on equity tend to outperform, which is why it is an important metric to watch.
Unlike the previous section, we will not compare TSCO to LOW and HD because both companies have a negative equity value. Therefore, the comparison would be of little value.
TSCO’s return on equity trend is as follows:
Finbox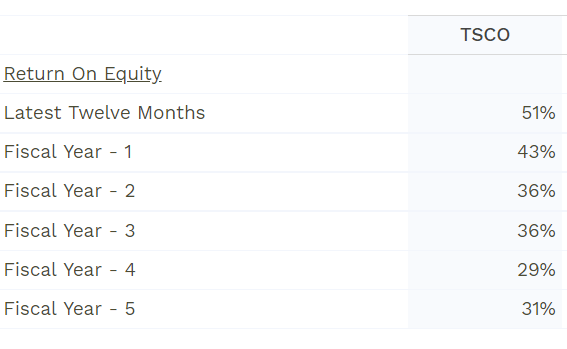
This would suggest that TSCO is very efficient at using its capital. However, let’s take a deeper look at just how efficient the company truly is. When breaking down the ROE trend into a DuPont analysis, we can separate it into three different parts: net profit margin, asset turnover, and equity multiplier. An increase in ROE is ideal when it is driven by increases in profit margins and asset turnover as opposed to leverage (equity multiplier).
The DuPont analysis is useful because it helps determine the key drivers of return on equity. It helps investors and managers identify operational strengths and weaknesses so that they can be addressed accordingly.
TSCO requires a lot of assets in the form of inventory and property, plant, and equipment. Thus, measuring the turnover rate of assets and the leverage required to obtain these assets, as well as their impacts on profitability, paints a great picture of management’s ability.
Finbox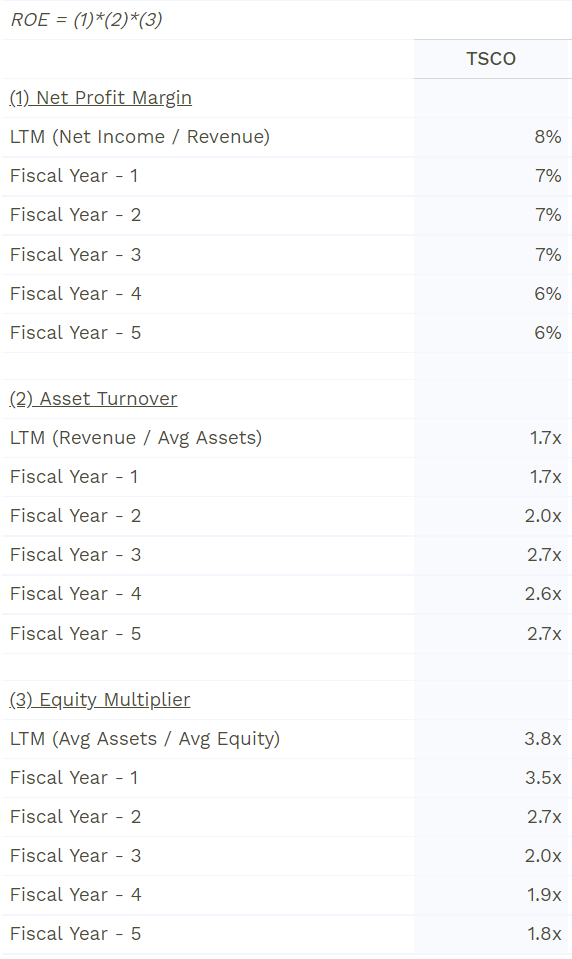
The first thing we notice is that the profit margin has increased from 6% to 8%. Although that might not seem that impressive, it represents an approximate margin expansion of 33%. Furthermore, on higher revenue, this translates to a 128% increase in profits on an absolute basis. Undoubtedly, this type of performance is strong and has rewarded shareholders.
However, the 2 remaining metrics aren’t exactly ideal. Asset turnover has declined while leverage has increased drastically. Technically, this would suggest that TSCO has seen a reduction in efficiency. However, we see it differently. Our view is that although asset turnover was 63% higher in 2016, profits are now 128% higher than they were in 2016. Thus, the decline in asset turnover is more than offset by profitability.
Similarly, leverage increased by 111% which is also below the increase in profit over the same time period. As a result, it’s clear that the company is very well managed.
Limitations of DuPont Analysis
The limitation of this model is that there is a risk of financial manipulation by the company’s accountants. Nevertheless, we don’t have reason to believe TSCO is manipulating its financials, as its Sloan ratio is in the safe zone. The Sloan ratio measures the degree of accruals vs. reported earnings. It was invented by Richard Sloan in 1996.
According to Finbox: “A Sloan Ratio between -10% and 10% is generally considered safe. If the Sloan ratio exceeds 25% or is less than -25% for consecutive years may be cause for concern. Tractor Supply has a Sloan ratio in the Safe Zone.” You can see its historical Sloan ratio in the chart below.
TSCO sloan ratio (Finbox)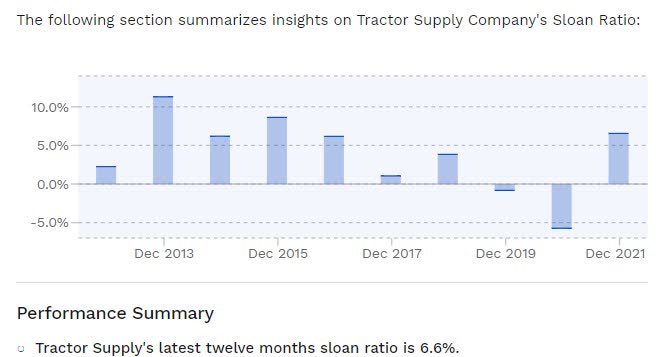
Another limitation is that the DuPont analysis model doesn’t tell us whether a metric is too high or too low, leaving it up to investors to use their best judgment.
Competitive Advantage
One of the quickest and most convenient ways of measuring a company’s competitive advantage is by taking a look at gross margins. That is because it represents the amount consumers are willing to pay for products above the cost of producing them. Companies without a competitive advantage tend to find themselves in pricing wars, which ultimately lead to poor performance and unpredictable results.
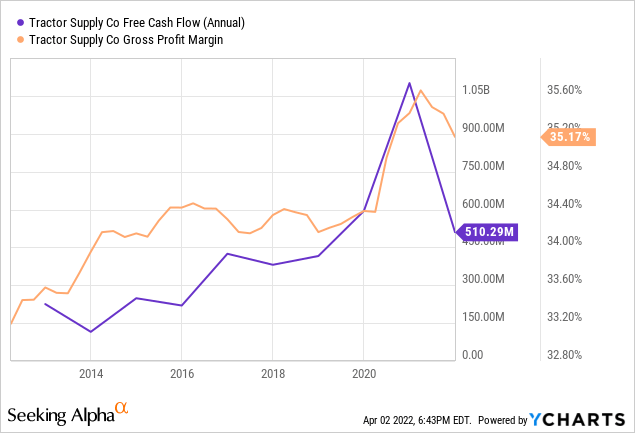
In TSCO’s case, gross margins have been steadily increasing over the past decade, indicating that competitors haven’t been able to chip away at its profitability. This has also led to the company seeing steady increases in free cash flow, making the company reasonably predictable. This predictability gives investors more confidence, which leads to potentially higher valuation multiples that benefit long-term investors.
Valuation
To value TSCO, we will use the H-Model, which is similar to a three-stage DCF model. The H-Model assumes that growth will decelerate linearly over a specified period of time. We believe this is a reasonable assumption as companies gradually slow down as they mature.
The formula is as follows:
Stock Value = (CF(1+tg))/(r-tg) + (CF*H*(hg-tg))/(r-tg)
Where:
- CF = cash flow per share
- tg = terminal growth rate
- hg = high growth rate
- r = discount rate
- H = half-life of the forecast period
For TSCO, we used the following assumptions:
- CF = $4.03 per share (excludes stock-based comp)
- tg = 2.424% (used 30-year U.S. Treasury yield)
- hg = 33.0% (based on analysts’ estimates for next year)
- r = 7.3%
- H = 5 years (we are assuming it will take 10 years to reach terminal growth)
As a result, we estimate that the fair value of TSCO is approximately $211.01 under current market conditions.
Final Thoughts
Tractor Supply Company has a strong track record of operational excellence and of rewarding shareholders. However, the current valuation appears to be a little stretched under the current market conditions.
Furthermore, due to higher inflation, there is some uncertainty as to how it will impact consumer spending habits. We expect economic growth to slow down and initial forecasts for 2022 to likely be revised downwards. Whether TSCO will fall into this camp remains to be seen. As a result, we remain neutral on the stock until we have some more clarity.
Be the first to comment