

jetcityimage/iStock Editorial via Getty Images
Tractor Supply Company (NASDAQ:TSCO) has a strong foundational history of growing its business under the direction of the same senior leaders. The company offers investors a dependable dividend with long-term sustained double-digit sales growth. The past five years have seen Tractor Supply outpace the S&P 500, with a 2022 rebound, rising 13.22% from an opening low of $179.67 per share on May 23, 2022, to a closing share price of $203.44 on July 9, 2022. TSCO is a strong growth and income stock that is not showing signs of slowing down anytime soon.
Company Profile
Tractor Supply is the largest “rural lifestyle” specialty retailer in the United States. As of March 2022, the Tractor Supply Company banner consists of 2,003 stores located in 49 states. In addition, Tractor Supply owns the small-box retailer Petsense. Petsense is a small-box retailer looking to compete with PetSmart and Petco (WOOF), delivering products and services to domestic pet owners in small to mid-sized communities. At the end of FY2021, Petsense consisted of 178 stores across 23 states.
Company Operations
TSCO has been holistically growing over the past decade by managing to grow its same-store sales while increasing its bricks-and-mortar footprint. Since 2014, TSCO has grown its footprint by 799 stores, which is about a ~6% increase in store count each year. Simultaneously, same-store sales grew at a rate of ~10.75% over the past five years, seeing a 40% two-year growth in same-store sales during 2020 and 2021. This is an important precedent as many company’s rely on their growing footprint to help drive their revenues, often with a moderate same-store sales growth.
Historically, TSCO has a profit margin of ~7%, with the net income increasing by 27% year over year for the past five years. In contrast, sales revenue is growing at 18%. With net income increasing at a higher rate than sales, this shows that TSCO’s management is continuing to grow sales while simultaneously finding ways to limit or reduce expenses, becoming more profitable. Below is a series efficiency metrics from FY2017 through FY2021.
|
FY2021 |
FY2020 |
FY2019 |
FY2018 |
FY2017 |
|
|
Inventory turns |
3.92 |
3.23 |
3.27 |
3.24 |
3.19 |
|
Days in Inventory |
93 |
113 |
112 |
113 |
114 |
|
ROA |
17% |
15% |
15% |
||
|
ROE |
52% |
48% |
36% |
38% |
29% |
|
Average Transaction Value |
$51.90 |
$46.89 |
$45.85 |
$44.61 |
$44.42 |
Due to a change in reporting made in Q1 2019, some of TSCO’s data, related to total assets and total liabilities are incompatible with the FY2018 and FY2017 data.
As noted in the chart above, the average basket size has continuously increased year over year at a rate of ~5.5%. Likewise, management has increased net income at a faster rate than the growth in assets and equity, thus showing both ratios becoming more appealing over time.
From an operations perspective, Tractor Supply has shown consistent capabilities in growing its sales, increasing its profit margins, increasing ROE and ROA, simultaneously growing both new store and same-store sales, while the basket value has been increasing at a rate higher than historic inflation.
Executive Team
The executive team is made up of a mix of long-term Tractor Supply Company veterans and newer leaders. The average tenure of the executive team is 10 years, with half of the team having a minimum of 10 years’ of tenure. CEO Hal Lawton, CFO Kurt Barton, and the chief technology officer have all been with Tractor Supply company for 20 years or longer, with the chief merchandising officer having 17 years of tenure. TSCO has a strong core leadership that has designed, implemented, and achieved enormous results over the past 12 years, growing the company from a mid-cap firm with $2.5B in market capitalization in Q2 2010 to a large-cap company with $23.1B in market cap in Q2 2022. This is a total market cap growth of 811.84% over the 12 years, translating into a 20.22% market cap growth each year for the past 12 years.
Dividends
Tractor Supply Company has a forward dividend of $3.68, with a yield of 1.88%. The last quarterly dividend announcement was made on May 11, 2022, at $0.92 per share. TSCO has shown 11 years of consistent dividend growth with a five-year dividend growth rate of 23.81%. The dividend ratio is 28.44%, showing that the company’s dividend rate and dividend growth is supported by their operations.
In February 2022, TSCO increased the quarterly dividend rate from $0.52 per share, annualized at $2.08 per share, to $0.92 per share, annualized at $3.68 mentioned above. This is a 77% increase in their dividend per share payout on both a quarterly and annualized basis, assuming the quarterly dividend payouts remain constant at $0.92 share for the remaining two quarters. Over the past five years, when TSCO sets their dividends per share, it generally remains constant throughout each fiscal year. At no point in the past five years has TSCO decreased their dividend payout once they increased it.
Tractor Supply Company Dividend History (Seeking Alpha)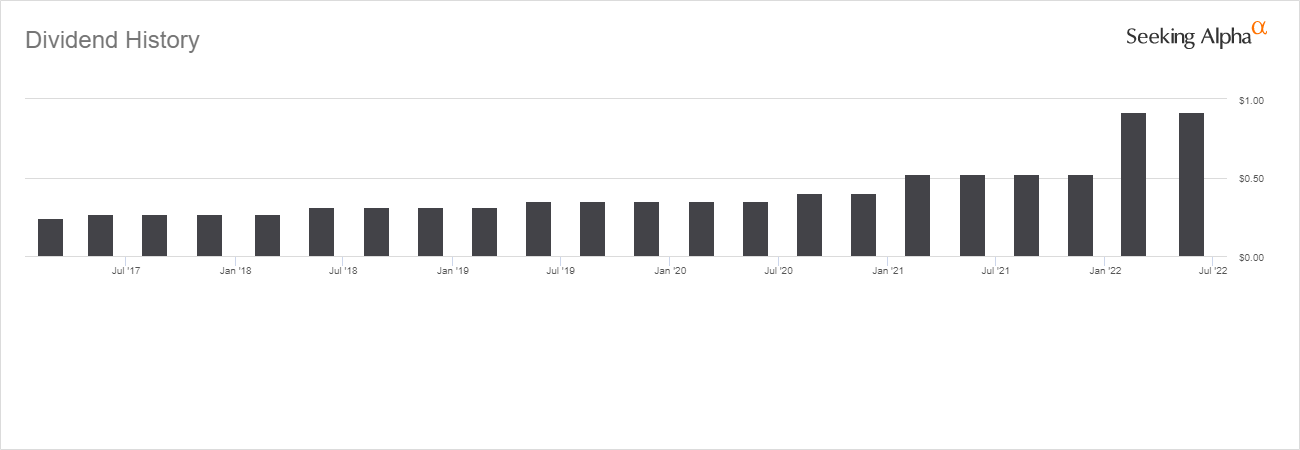
On a 12-year basis, TSCO has only decreased their dividend twice. Once was on Nov. 30, 2010, (payout date), decreasing the dividend per share from $0.14 per share to $0.07 per share. The second time was on Dec. 3, 2013 (the payout date), with the dividend per share being cut in half, decreasing from $0.26 to $0.13 per share. Since then, the dividend has continuously grown. While Tractor Supply is still a far cry from being included among the Dividend Aristocrats, it has consistently rewarded investors with a healthy and dependable dividend that has a history of year-over-year growth.
Near-Term Risks
On June 6, 2022, Tractor Supply updated its Q2 growth estimate to 8%. There are two key obstacles that could prevent TSCO’s from hitting its 2022 forecast. The first is inflation and the second is the diesel shortage. If the diesel shortage hits the suggested levels, TSCO will experience reduced inventory and increased inbound transportation costs.
The supply shortage and increased inbound expenses will inflate TSCO’s prices further. TSCO’s price parity is more on the elastic side of the demand curve, which will result TSCO’s gross markup increasing as they cannot pass all the inflationary costs along to their consumers. Over the past few years, the gross margin has increased from 34.3% in 2017 to 35.16% in 2022. From 2020 to 2021, the gross profit margin decreased fractionally from 35.42% to 35.16%. This shows that Tractor Supply has found ways to reduce their cost of goods sold while simultaneously increasing its sales revenue. The inflationary costs of 2022, plus the significantly increased diesel costs, will force a reduction in their gross profit margin. It would not be unreasonable to see their gross profit margin dip back into the low 34% range.
The diesel and inflation risks are predominately near-term risks all derived from the supply chain shortage coming out of the pandemic. EIA is currently forecasting that diesel prices will be about $1.00 per gallon less at years end than it was in June of 2022, a drop from $5.204 per gallon in June to $4.26 in December. For 2023, diesel prices are forecast at an average of $4.139 per gallon, which is 35.5% higher than pre-pandemic diesel prices.
Despite the diesel risks to the company’s inbound transit costs, leadership has shown an aptitude for controlling their up-stream expenses, as has been noted by their increasing profit margins. This risk does not appear to be a long-term obstacle that will prevent Tractor Supply from maintaining incredible growth during the foreseeable future.
Discounted Cash Flow Valuation
In order to create an EPS forecast, I utilized a 12.82% growth rate for each of the next six years (2022 through 2027). Starting in 2028, the growth rate decreases by 1.78% per year until the growth rate reaches a constant 4% growth rate starting in 2032.
| 2022 | 2023 | 2024 | 2025 | 2026 | 2027 | 2028 | 2029 | 2030 | 2031 | 2032 | |
| Forecasted Earnings Per Share | $9.35 | 10.55 | $11.90 | $13.43 | $14.62 | $16.21 | $17.74 | $19.18 | $20.48 | $21.58 | $22.44 |
| Growth Rate | 12.84% | 12.84% | 12.84% | 12.84% | 12.84% | 12.84% | 11.06% | 9.29% | 7.53% | 5.76% | 4% |
In order to find an intrinsic value, the future earnings are discounted utilizing a 10.59%. This is found employing a risk-free rate of 3.13%, using a slightly higher risk premium.
Relative Valuations
For both price/earnings and price/sales, I took a historic aggregate of Tractor Supply’s P/E and P/S and used them to calculate a one-year price estimate based upon current growth estimates.
Relative Valuation ranges for Tractor Supply Company using P/E and P/S ratios (Table Created by Author)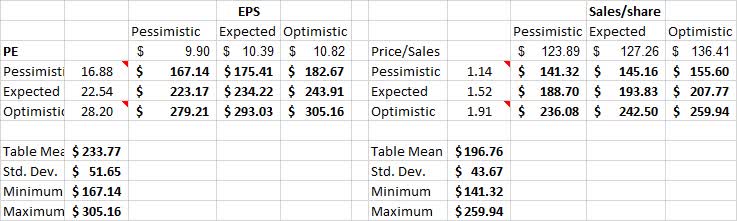
The P/E ratio forecast suggests a July 2023 target price of $233.77, representing a 14.91% increase. The P/S ratio estimates a 12-month price target of $196.76, a 3.28% decreased based on the current market price.
Valuation Summary
The table below shows my overall valuation for Tractor Supply with a weighted average price target of $223.51 per share. With a 10.59% required return, the $223.51 current estimated value is expected to result in a one-year target price of $247.19, returning a possible 21.50% over the current stock price.
Valuation Summary (Table created by author)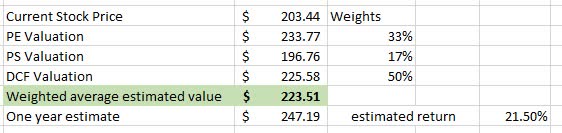
Conclusion
Tractor Supply is an undervalued growth company offering a sturdy dividend, along with dependable underlying financial results. Tractor Supply is currently trading at $203.44 with a one-year price target of $247.19, based on the current market risks.
Be the first to comment