

dszc/E+ via Getty Images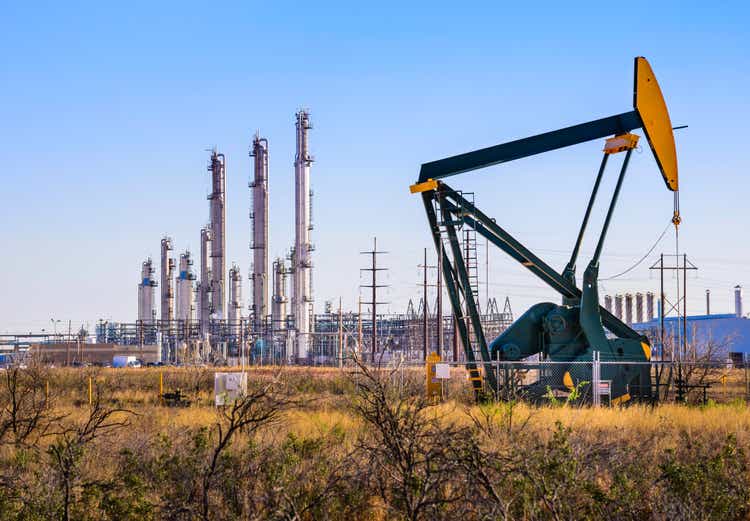
Introduction and Overview
Tourmaline Oil Corporation (OTCPK:TRMLF) is a gas-weighted senior Canadian E&P with operations in the Duvernay, Deep Basin and Montney. These formations stretch the Grande Prairie, Central Alberta, Peace River, and Southeast BC regions of the WCSB.
In the assessment below we will deconstruct Tourmaline within two main contexts and prove that Tourmaline is an industry leader in terms of its operatorship and return of capital initiatives:
- Operational Assessment: Tourmaline remains one of the most prolific operators in the WCSB, maintaining meaningful reserves, moderate declines and boasting impressive drilling results.
- Economic Assessment: Tourmaline is poised to generate meaningful free cash flow at current strip prices, has implemented an impressive special dividend, and has the opportunity to increase return of capital via its outstanding NCIB share buyback capacity.
Given its incredible operatorship, meaningful special dividend and presence in the Duvernay it is fitting to crown Tourmaline as the undisputed “Drilling & Dividend Duke of the Duvernay”. As a result, we have a bullish outlook on Tourmaline and recommend a buy.
Macro Energy Backdrop
We have previously deconstructed the case for a continuing strong crude oil market (CL1:COM) and hold a similar outlook in the natural gas market (NG1:COM).
The ongoing Russian-Ukraine conflict continues to sustain high global natural gas pricing and a bullish price outlook remains supported by expectations of a tighter supply and demand balance. North American gas is now demanding a geopolitical risk premium as countries are beginning to evaluate the role that North American LNG can play in providing stability to global energy needs.
Henry Hub pricing outlook continues to remain bullish on a combination of a colder finish to withdrawal season, continued record LNG outflows and robust power generation demand. Furthermore, Canadian natural gas underpinned by AECO benchmark, also continues to remain strong trailing the increasing Henry Hub pricing. NGL outlook is also bullish on improved ethane forecasts due in part from lower propane/butane forecasts. Propane and butane outlook are not as strong due to the US Administration temporarily removing restrictions on summer sales of higher ethanol blends.
In light of the strong gas pricing backdrop, Tourmaline is well positioned for meaningful free cash flow generation and shareholder upside.
Operational Assessment
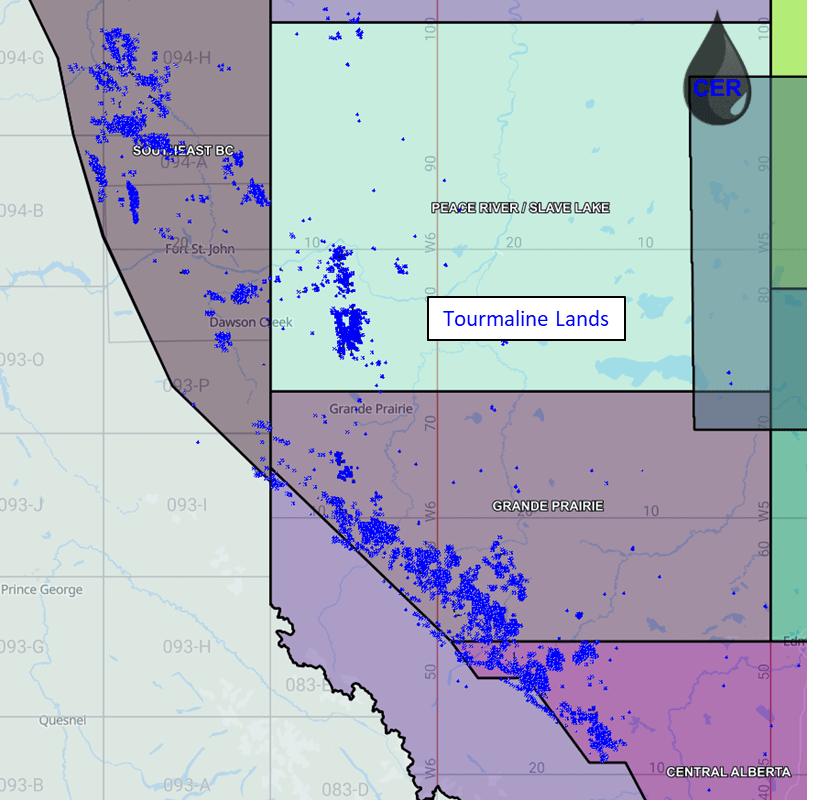
Tourmaline is a major upstream Canadian producer with 80% of its production from natural gas, and the balance from natural gas liquids and light oil. Tourmaline is concentrated in the Deep Basin, Northern BC Montney, and Duvernay zones of the WCSB. These zones are located in the Southeast BC, Peace River, Grande Prairie, and Central Alberta regions as illustrated by the map below.
For context, the below table summarizes Tourmaline’s position across all assessed regions in the Western Canadian Sedimentary Basin. Note that values may not be exact as they include several underlying assumptions and simplifications.
Figure 1: Summary of Land Position and Production by Region (XI technologies, geoSCOUT, formatted and filtered by CER) Figure 2: Summary of Land Position and Production by Region (source: XI technologies, geoSCOUT, formatted and filtered by CER)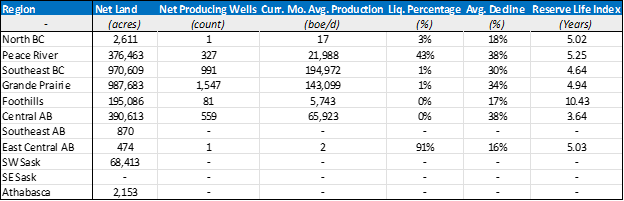
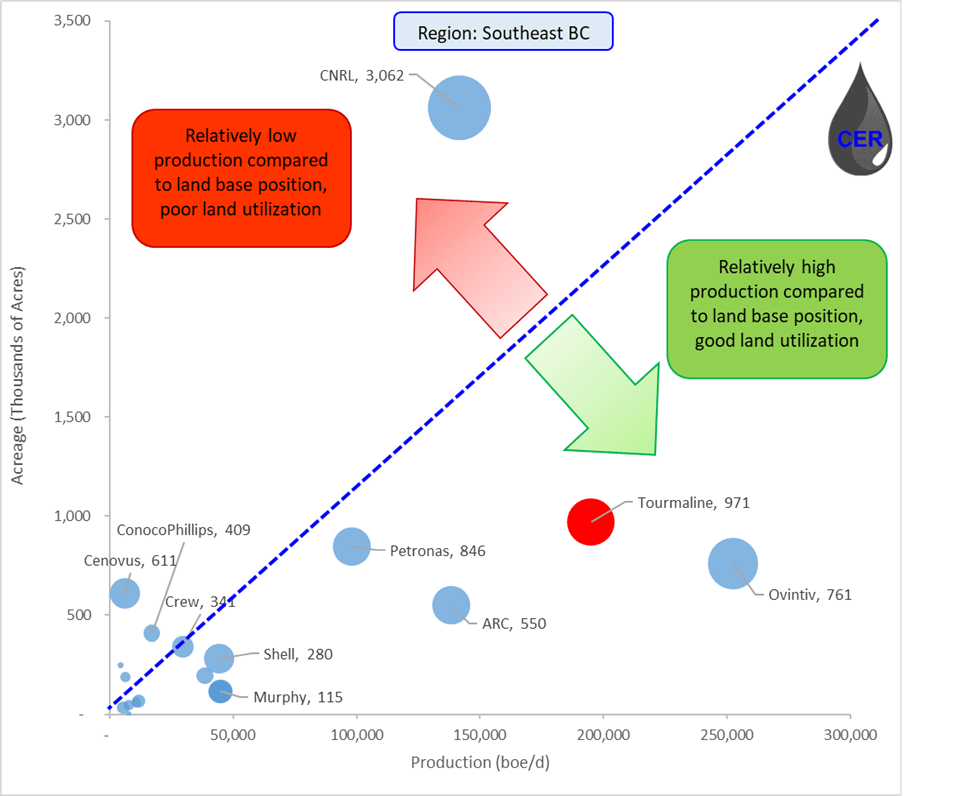
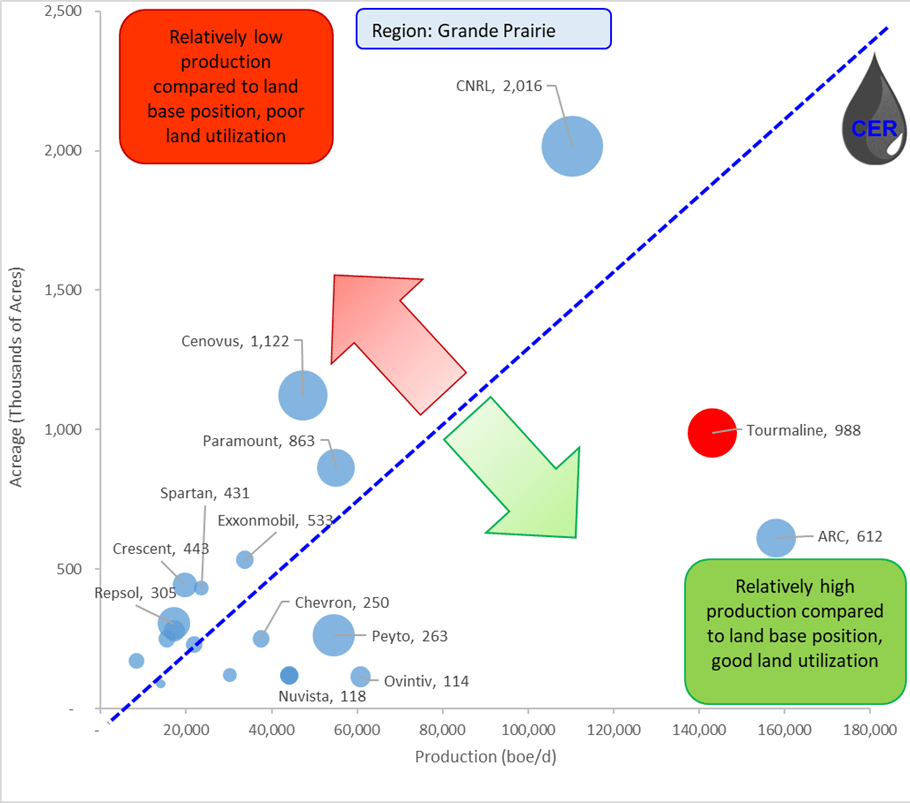
Acreage and Production
In all regions where it operates, Tourmaline maintains a commanding position when it comes to land use. Proving that the company is quickly deploying capital to grow production once new acreage is acquired. In the four regions where Tourmaline operates, it is one of the top three operators when it comes to land utilization. Overall, it’s a testament to efficient land management across the company and supports an outperform and Buy recommendation.
Figure 3: Net Acreage (Y-Axis), Production (X-Axis) and Net Well Count (bubble size) by Operator (source: XI technologies, geoSCOUT, formatted and filtered by CER) Figure 4: Net Acreage (Y-Axis), Production (X-Axis) and Net Well Count (bubble size) by Operator (source: XI technologies, geoSCOUT, formatted and filtered by CER) Figure 5: Net Acreage (Y-Axis), Production (X-Axis) and Net Well Count (bubble size) by Operator (source: XI technologies, geoSCOUT, formatted and filtered by CER) Figure 6: Net Acreage (Y-Axis), Production (X-Axis) and Net Well Count (bubble size) by Operator (source: XI technologies, geoSCOUT, formatted and filtered by CER)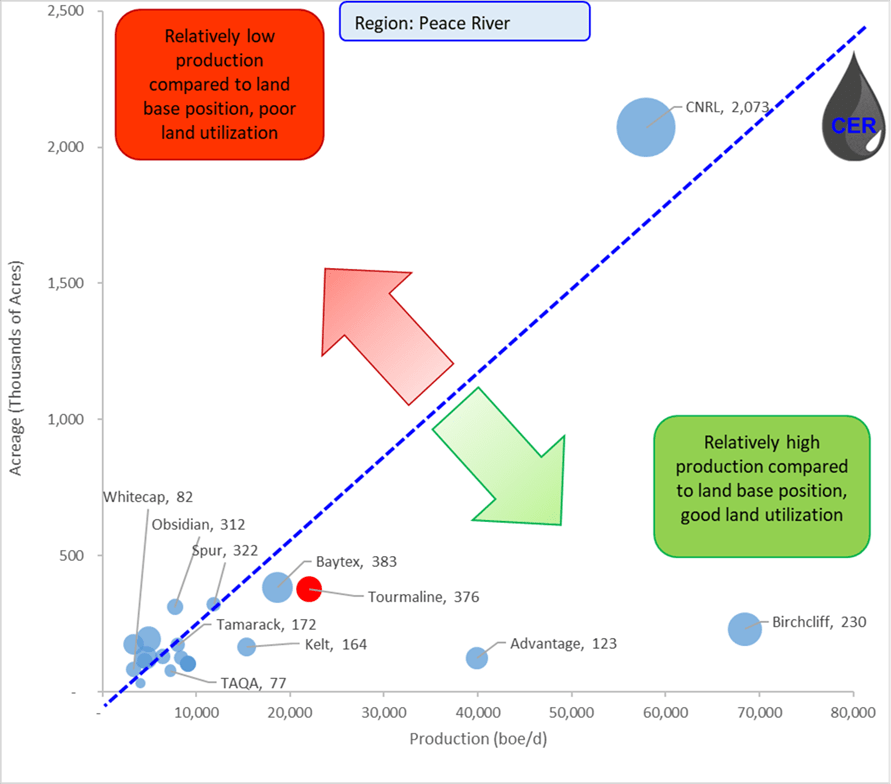

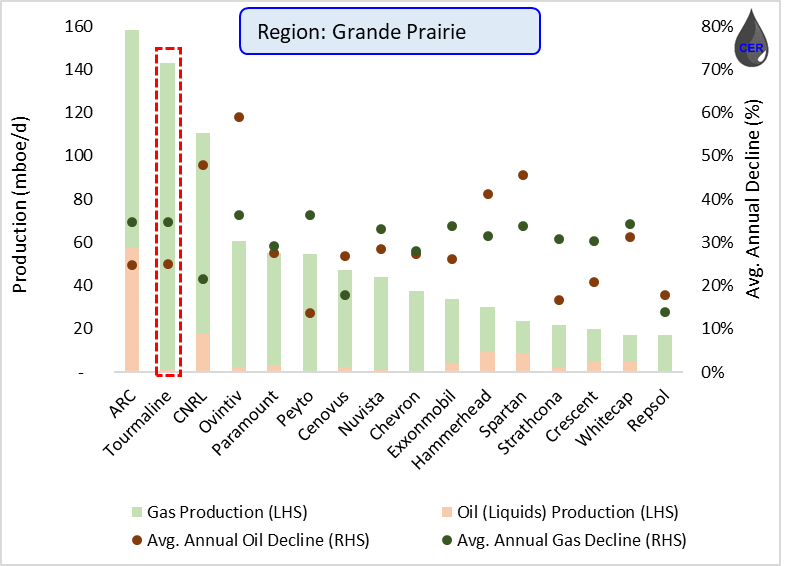
Production Decline
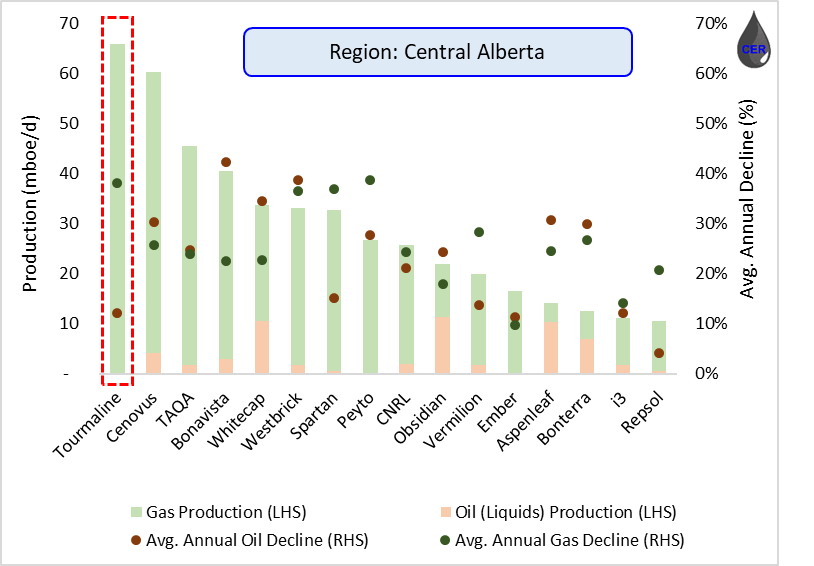
Tourmaline maintains its position as a top operator when it comes to gross production in every region where it operates. Furthermore, it is also subject to moderate decline rates. This is a notable consideration, as Tourmaline’s future success is closely dependent on its successful exploration, drilling and completion activities in the area. This is especially important given that both labor and material pricing are accelerating in line with ballooning inflation. In May, Tourmaline increased its 2022 capital budget to account for service cost increase ($75 million) and exploration cost increase ($25 million). The company noted cost inflation to increase by 10-15% in 2022.
Figure 7: Production (LHS) and Average Annual Decline (RHS) by Operator (source: XI technologies, geoSCOUT, formatted and filtered by CER) Figure 8: Production (LHS) and Average Annual Decline (RHS) by Operator (source: XI technologies, geoSCOUT, formatted and filtered by CER) Figure 9: Production (LHS) and Average Annual Decline (RHS) by Operator (source: XI technologies, geoSCOUT, formatted and filtered by CER) Figure 10: Production (LHS) and Average Annual Decline (RHS) by Operator (source: XI technologies, geoSCOUT, formatted and filtered by CER)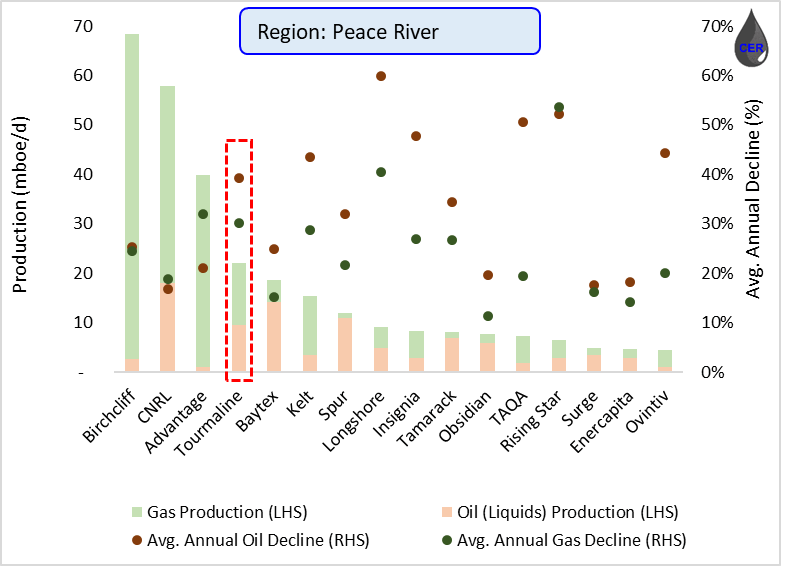

Drilling Activity
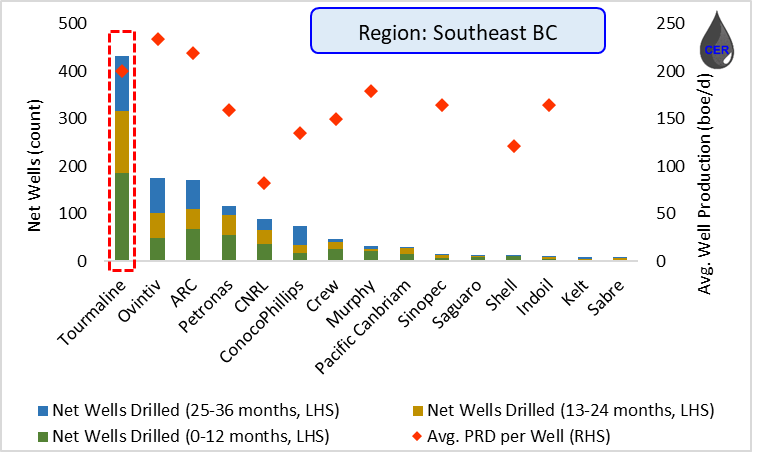
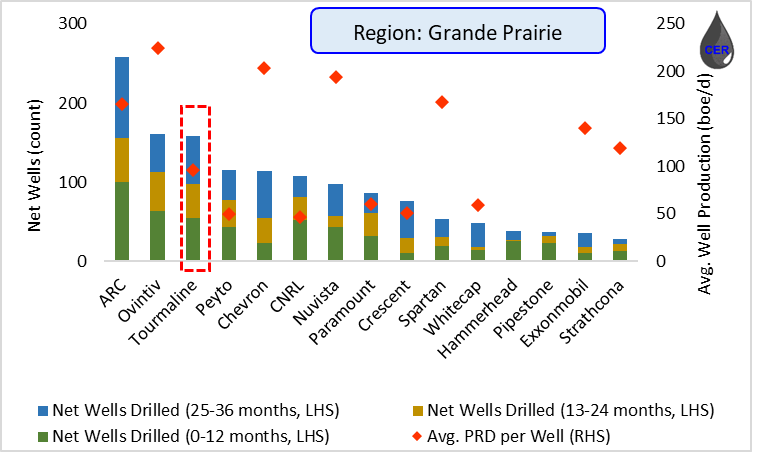
Tourmaline continues to remain active in the first quarter, with 66 net new drills, completing 72 net new wells and bringing production online of 85 net wells. More impressively, Tourmaline achieved record low drilling times with a 3500m Lower Charlie Lake horizontal well in just 11.7 days, a Northeast BC Montney 2000m horizontal well in 4.9 days and a 2000m Deep Basin well in 11.3 days. The drilling results underpin Tourmaline’s operational performance and will eventually materialize into shareholder returns from improved D&C efficiencies and lower costs. As illustrated by the plots below, Tourmaline remains one of the top operators in each region when it comes to drill count addition. Furthermore, Tourmaline also maintains above average production per well compared to peers in each region, indicative of accurate geological mapping, and an effective D&C program further supporting an outperform rating and buy recommendation.
Figure 11: Net new drills (LHS) and Avg. Production (RHS) by Operator (source: XI technologies, geoSCOUT, formatted and filtered by CER) Figure 12: Net new drills (LHS) and Avg. Production (RHS) by Operator (source: XI technologies, geoSCOUT, formatted and filtered by CER) Figure 13: Net new drills (LHS) and Avg. Production (RHS) by Operator (source: XI technologies, geoSCOUT, formatted and filtered by CER) Figure 14: Net new drills (LHS) and Avg. Production (RHS) by Operator (source: XI technologies, geoSCOUT, formatted and filtered by CER)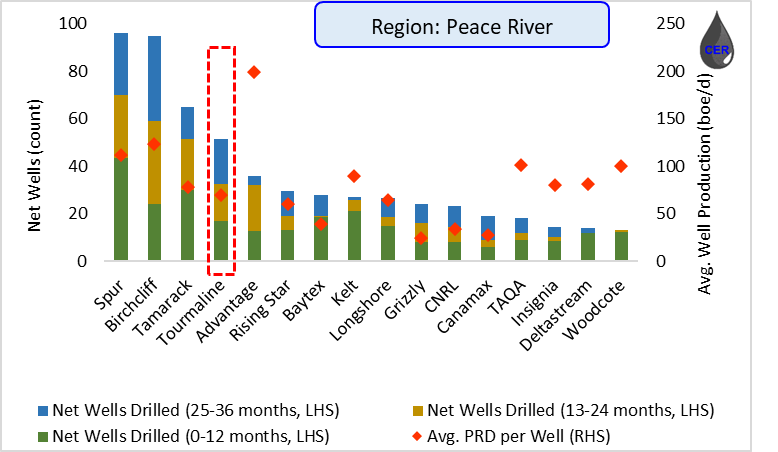

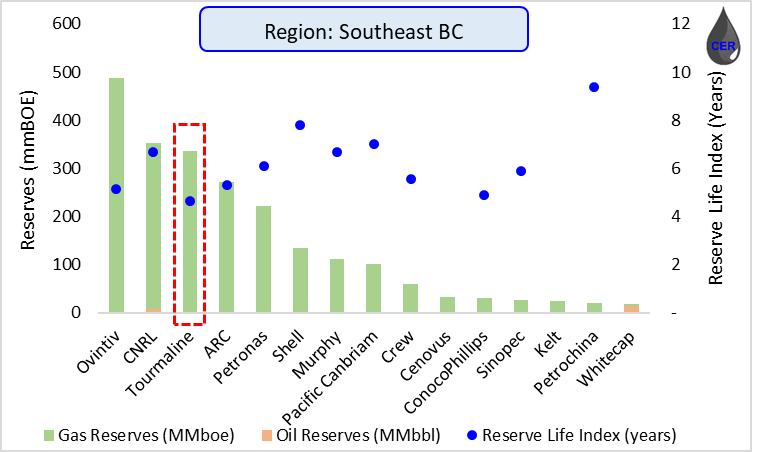
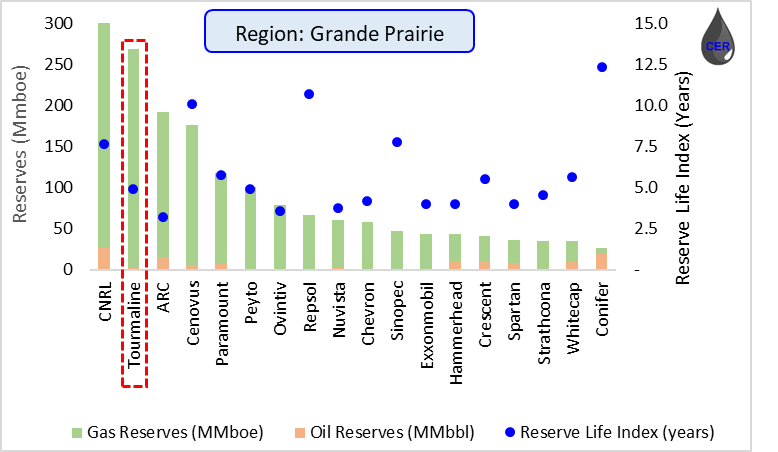
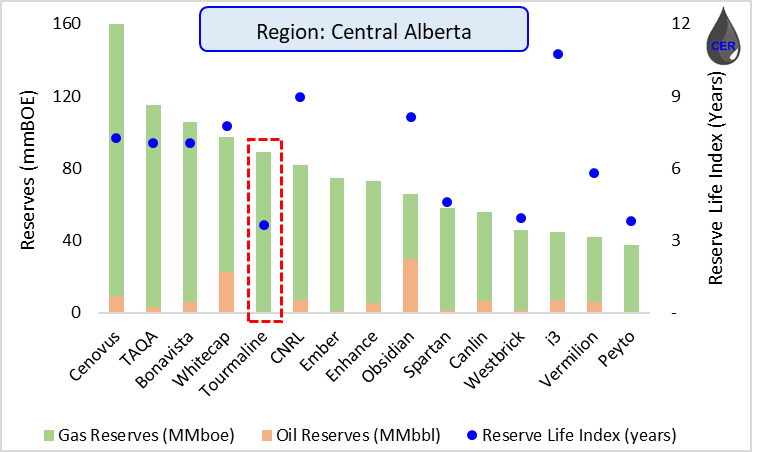
Reserves
Tourmaline maintains healthy reserves in every region, with both oil (PDP +26% YoY, 2P +35% YoY) and natural gas (PDP +29% YoY, 2P +26% YoY) booked reserves increasing meaningfully year over year. Total 2P reserves increasing 28% YoY or ~C$12/share, partly due to accretive acquisitions of Black Swan and Saguaro. Furthermore, Tourmaline maintains incredibly competitive drilling inventory with over 13,000 drilling locations providing the flexibility for profitable development without the need to pursue expensive resource addition through A&D. As illustrated by the plots below, Tourmaline maintains some of the highest reserves in the region and healthy PDP reserve life indices, further supporting an outperform rating and buy recommendation.
Figure 15: Reserves and RLI by Operator (source: XI technologies, geoSCOUT, formatted and filtered by CER) Figure 16: Reserves and RLI by Operator (source: XI technologies, geoSCOUT, formatted and filtered by CER) Figure 17: Reserves and RLI by Operator (source: XI technologies, geoSCOUT, formatted and filtered by CER) Figure 18: Reserves and RLI by Operator (source: XI technologies, geoSCOUT, formatted and filtered by CER)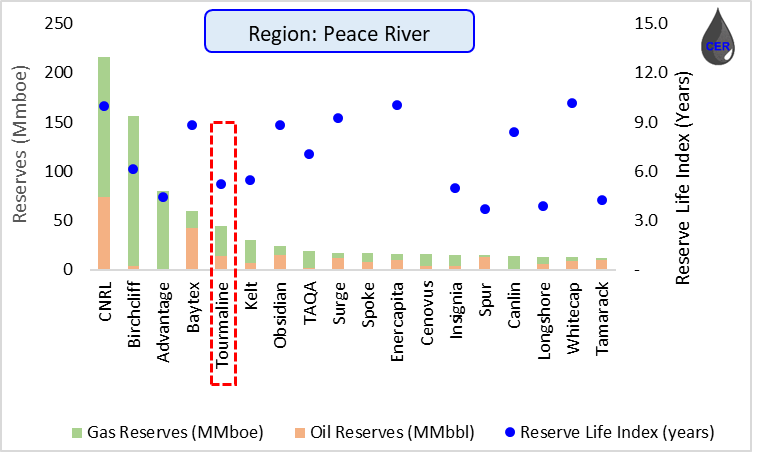
Economic Assessment
In the following sections we consider Tourmaline’s latest earnings and breakdown its intrinsic valuation; starting with a commodity pricing outlook, production forecast, calculating field and corporate netbacks, and finally by discounting free cash flow back to present value.
Earnings
In Q1 2022 results remained in line with Wall Street expectations, with production at 507,059 boe/d which drove cash flow per share of $3.18. Capital investment was $458 million, however 2022E capital spending was increased by $100 million in light of increasing cost inflation. Furthermore, Tourmaline disclosed a $1.50/share special dividend back in May opening the way for more to come in Q2 and Q3 given the strong market backstop. Last week, Tourmaline also announced a 12.5% increase to the base dividend (+$0.10/share per annum) which is likely to be further supplemented by meaningful share buybacks given the limited NCIB usage to date (Tourmaline has cancelled 200k shares out of the 13.5 million share NCIB limit). These return of capital initiatives are well supported by Tourmaline’s meaningful free cash flow generation, estimated at $4.1 billion or 18% FCF yield at current strip prices.
Production
Tourmaline’s management provided competitive guidance with targeting over 510,000 boe/d production by 2022 exit, and putting Tourmaline as the largest Canadian natural gas and NGL producer. To remain conservative, we have only increased production by 2% per year after 2023, as we believe it will be difficult to accelerate production growth given the increasing labor and material costs.
Figure 19: Production Outlook (source: 2021 Annual Presentation, formatted and filtered by CER)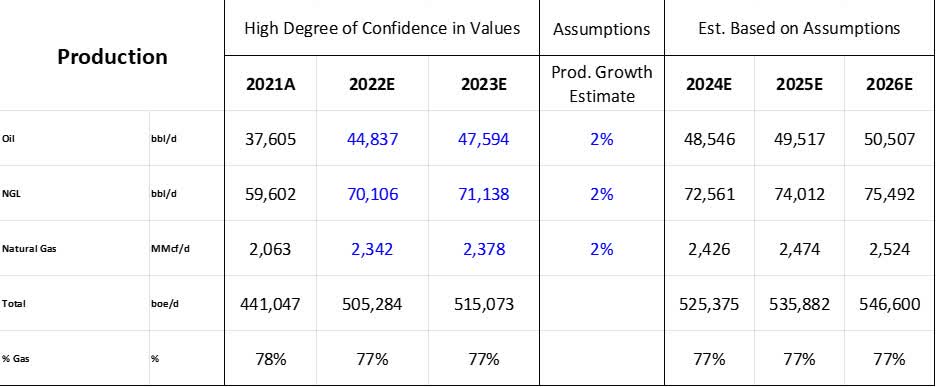
Netbacks
Given the current high gas pricing environment, Tourmaline is positioned to generate meaningful netbacks. A sensitivity to highlight are its hedging cost; roughly 37% of 2022 production and 15% of 2023 production remains hedged with fixed price contract. This may put some downward pressure on its bottom line compared to other peers such as Birchcliff, with relatively lower production hedged.
Figure 20: Operational Netback (source: 2021 Annual Presentation, formatted and filtered by CER)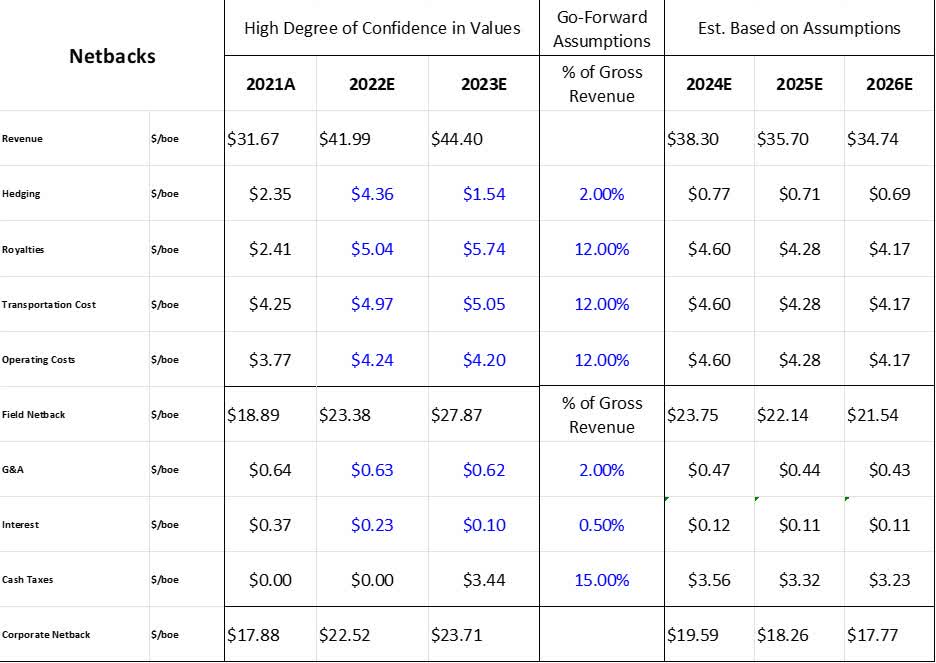
Cash Flow
Given the ballooning gas prices of these past weeks, a consistently tight gas market and continually escalated geopolitical tensions Tourmaline is well positioned to outperform the overall market in the foreseeable future. Given Tourmaline’s operational leadership and, we believe an 8% discount rate is appropriate. As such, the present value of Tourmaline’s falls between C$75 and C$80 per share, implying a 6% upside from the current pricing. Moreover, we must also consider the meaningful base and special dividend yield. In the last three quarters, Tourmaline paid out $3.50 / share in special dividends, and it is likely that another $1.50/share per quarter will be paid out in special dividends over the next three quarters.
Figure 21: Free Funds Flow and Present Value (source: 2021 Annual Presentation, formatted and filtered by CER)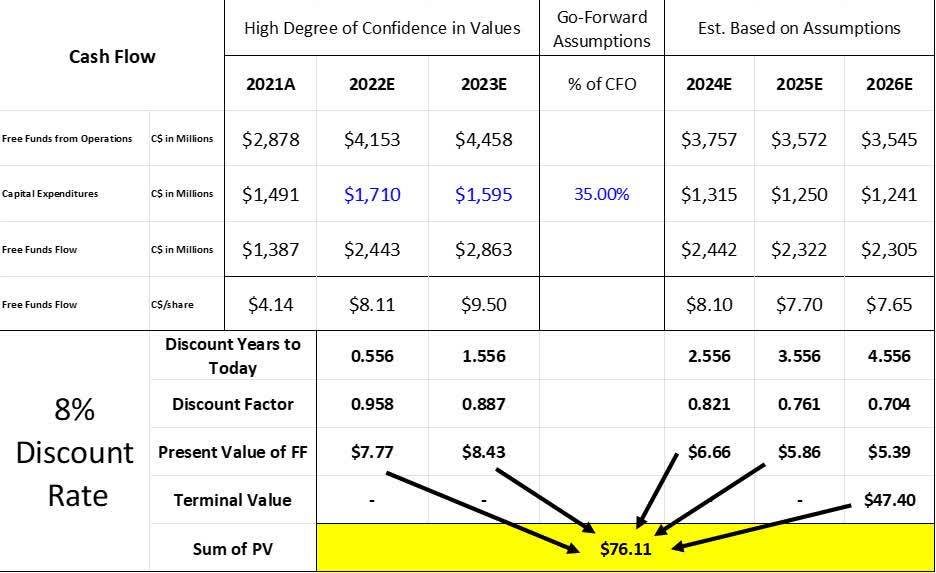
Conclusion
Tourmaline is an experienced gas-weighted operator who continues to raise the bar given its excellent operatorship, outstanding recent drilling results, moderate declines and meaningful reserves in place. Tourmaline has begun deploying a substantial return of capital program with multiple special dividends, and a base dividend increase. Moreover, it is poised to generate significant free cash flow at current prices giving it enough horsepower to accelerate its return of capital via share buybacks as well. As a result we maintain a bullish outlook on Tourmaline and recommend a buy.
Be the first to comment