


10’000 Hours/DigitalVision via Getty Images
The Top 10 Dividend Payers Series continues with our October 2022 Edition. This series is dedicated to exploring stocks that offer attractive dividends and are worthy of further examination. An attractive dividend does not guarantee that a company is poised to perform well but companies that perform well often offer attractive dividends.
Today, I’m going to review my top 10 dividend payers for October and take a closer look at one pick this month: QUALCOMM Incorporated (QCOM).
Dividend Strategy Recap
Read our April edition to review important statistics about dividends. To recap that article, dividends offer the following indications:
- Dividend stocks tend to perform better during bear markets and reduce portfolio volatility.
- S&P 500 stocks that pay dividends have performed better than stocks that do not pay dividends or cut dividends.
- Generally, stocks that pay an above average dividend yield at an above average payout ratio perform best.
One reason that dividend investing is so powerful is the compounding effect of dividend reinvestment. By reinvesting dividends investors can achieve outsized returns for long term investments. Since 1980, 75% of the returns of the S&P 500 came from dividends when reinvested, demonstrating the importance of considering your dividend strategy.
There are major implications for retirees who cannot reinvest the dividends they need for income. For this example, we will model two identical companies with different payout ratios and dividend rates. In this case the retiree investor is not reinvesting dividends and will sell equity of the 3.3% dividend paying stock to produce the same amount of income as the 7.5% dividend paying stock. After 15 years the investment in the 3.3% dividend payer has returned a higher total return than the 7.5% dividend payer when Return on Assets is 10%. In this case the retiree is better to invest in the 3.3% dividend stock.
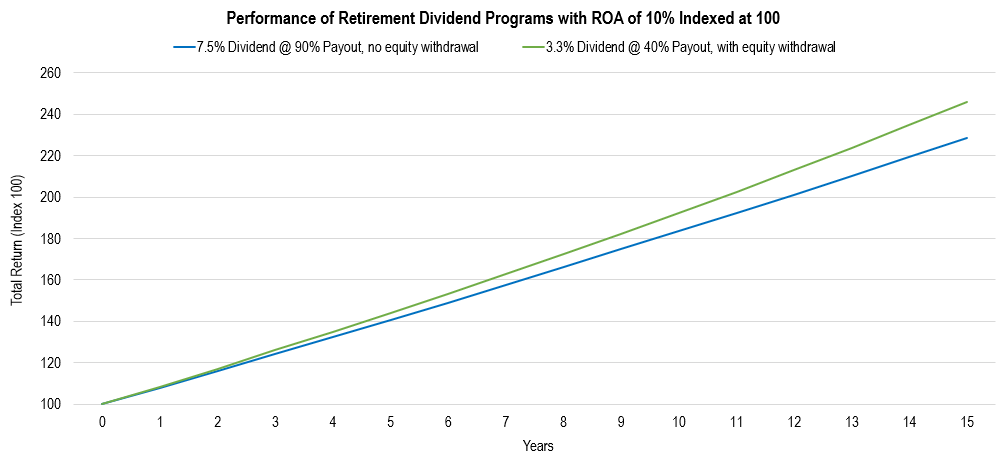
Chart by author
When we reduce the ROA from 10% to 7%, we can see that the 3.3% paying stock no longer produces a higher total return. The selling of equity for income cannot be overcome with growth. The return from the 3.3% payer is decelerating and approaching a limit. This is because if the retiree lives long enough, they will one day sell their last share of stock for income. In this case the retiree is better off investing in the 7.5% payer stock.
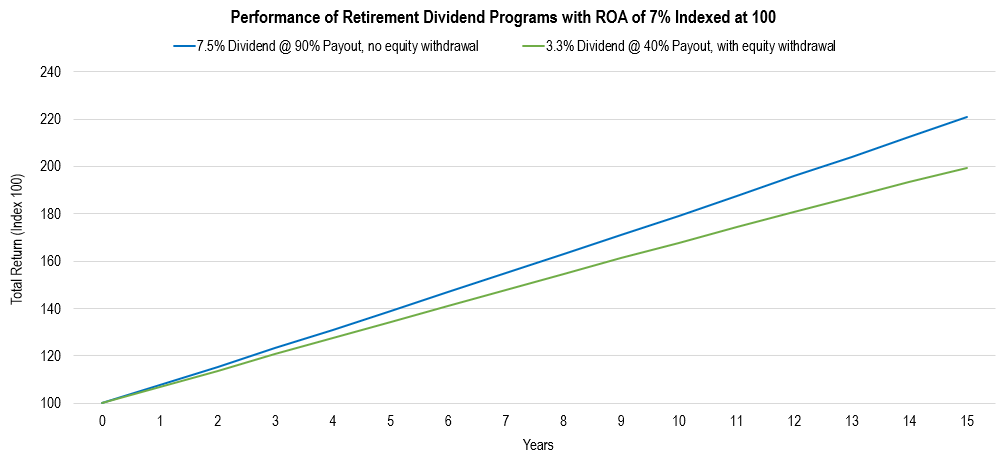
Chart by author
As we have seen, choosing a good dividend stock is not as simple as looking for the highest yield you can find. Often high dividend yields are a warning that the company is experiencing problems. Based on this information I have formulated four dividend payer goals:
- Maximize total return
- Deliver a meaningful yield
- Experience strong dividend growth
- Provide a margin of safety against dividend cuts
Top 10 Dividend Payers
The purpose of this exercise is to identify potentially strong dividend payer equities that are worthy of further examination. This exercise does not analyze overall investment suitability and is not an assessment of risk. The lists are not recommendations, though I will mention if I own any of the names on the list.
Screening
The exercise begins with a stock screen that eliminates attributes which compromise my goals. I use the Seeking Alpha Stock Screener to sort equities based on the following qualifications. I implement substitutions to the data for REITs and MLPs.
| Metric | Screen |
| Dividend Yield FWD | >2% |
| Payout Ratio | <150% |
| 5Y Dividend Growth | >2% |
| Years of Dividend Growth | >3 |
| EPS/FFO/CFO FWD | >-3.0% |
| Cash From Operations | >-200M |
| Return on Assets | >3% |
| Debt to Equity | <500% |
| Debt to FCF | >-10% |
Ranking
The screen results in 121 stocks to rank. The ranking uses an equation that determines the percentile of each metric based on ideal ranges and assigns a weighted score according to an order of prioritization in the table below. The maximum ranking score is 10. The score should be viewed relative to other scores.
| Metric | Reinvestment Strategy Priority | Retirement Strategy Priority |
| Dividend Yield FWD | Low | High |
| Payout Ratio | High | Low |
| 5Y Dividend Growth | Low | Medium |
| Years of Growth | Low | Medium |
| Revenue Growth FWD | High | High |
| Net Income 3Y Growth | Low | Low |
| EPS/FFO/CFO Growth FWD | High | High |
| Net Income Margin | High | High |
| Return on Assets | Medium |
High |
Top 10 Dividend Payers for Reinvestment
| Ticker | Name | Dividend Yield FWD | Score | |
| 1 | CTRA | Coterra Energy Inc. |
2.10% |
5.9 |
| 2 | IIPR | Innovative Industrial Properties, Inc. |
7.39% |
4.6 |
| 3 | EOG | EOG Resources, Inc. |
2.40% |
4.4 |
| 4 | TXN | Texas Instruments Incorporated |
3.00% |
4.3 |
| 5 | PLD | Prologis, Inc. |
2.98% |
4.0 |
| 6 | QCOM | QUALCOMM Incorporated |
2.45% |
3.9 |
| 7 | SIMO | Silicon Motion Technology Corporation |
2.89% |
3.8 |
| 8 | EXR | Extra Space Storage Inc. |
3.34% |
3.8 |
| 9 | NVS | Novartis AG |
4.25% |
3.7 |
| 10 | AVGO | Broadcom Inc. |
3.42% |
3.6 |
Top 10 Dividend Payers for Retirement
| Ticker | Name | Dividend Yield FWD | Score | |
| 1 | CTRA | Coterra Energy Inc. |
2.10% |
5.2 |
| 2 | IIPR | Innovative Industrial Properties, Inc. |
7.39% |
4.7 |
| 3 | EOG | EOG Resources, Inc. |
2.40% |
4.2 |
| 4 | TXN | Texas Instruments Incorporated |
3.00% |
4.1 |
| 5 | QCOM | QUALCOMM Incorporated |
2.45% |
3.9 |
| 6 | SIMO | Silicon Motion Technology Corporation |
2.89% |
3.7 |
| 7 | LYB | LyondellBasell Industries N.V. |
5.87% |
3.4 |
| 8 | NNN | National Retail Properties, Inc. |
5.40% |
3.4 |
| 9 | MMM | 3M Company |
5.15% |
3.4 |
| 10 | AVGO | Broadcom Inc. |
3.42% |
3.4 |
Taking a Closer Look At Qualcomm Inc.
Both lists this month include Qualcomm Inc. The semiconductor and telecommunications company has offered $0.75 per share of dividends over the past two quarters which equals a dividend yield of about 2.45% at current share price. The company earns outstanding dividend grades from Seeking Alpha with an A grade for safety and an A+ grade for growth.
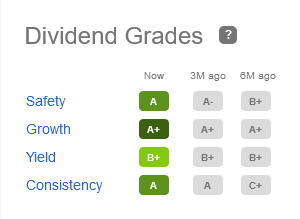
Seeking Alpha
Over the last 16 years the company has delivered a dividend CAGR of 12.74%. Consensus estimates expect the dividend to increase by 7% in 2023 and 5.2% in 2024. This would continue the company’s 18 years of consecutive dividend increases and seems very plausible with a payout ratio at a conservative 23.35%.
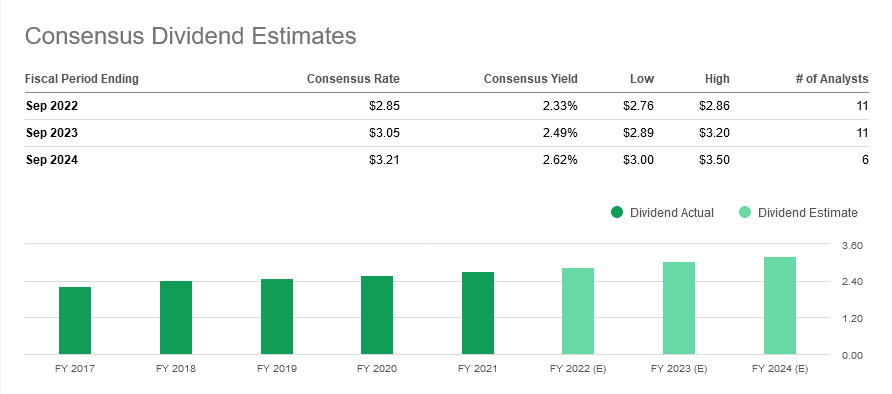
Seeking Alpha
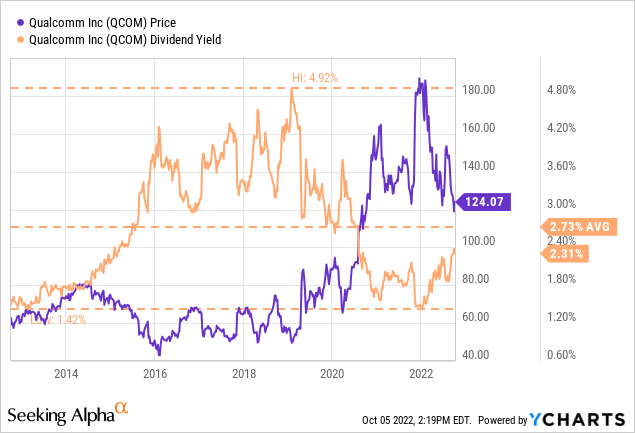
I would like to see a higher dividend yield. Over the past 10 years QCOM has averaged a dividend yield of 2.73%. In 2019, the dividend yield was at its highest at 4.92%. Shares have returned a total of 162% since that time.
QCOM is attractively rated by SA authors, Wall Street, and the SA Quant. Each rating is a buy. Analyst price targets are strong with a minimum price target of $130 per share which is 4.5% above the current share price.

QCOM Ratings Summary (Seeking Alpha)

Seeking Alpha
QCOM trades at an adjusted operating earnings P/E of 9.75. This compares to the 16-year normal P/E multiple of 17.98. The valuation is quite attractive, especially if future growth estimates are accurate. Earnings per share estimates over the next 3-5 years are expecting 23% CAGR according to Seeking Alpha, 15.45% according to FAST Graphs, and 7.62% according to Yahoo.
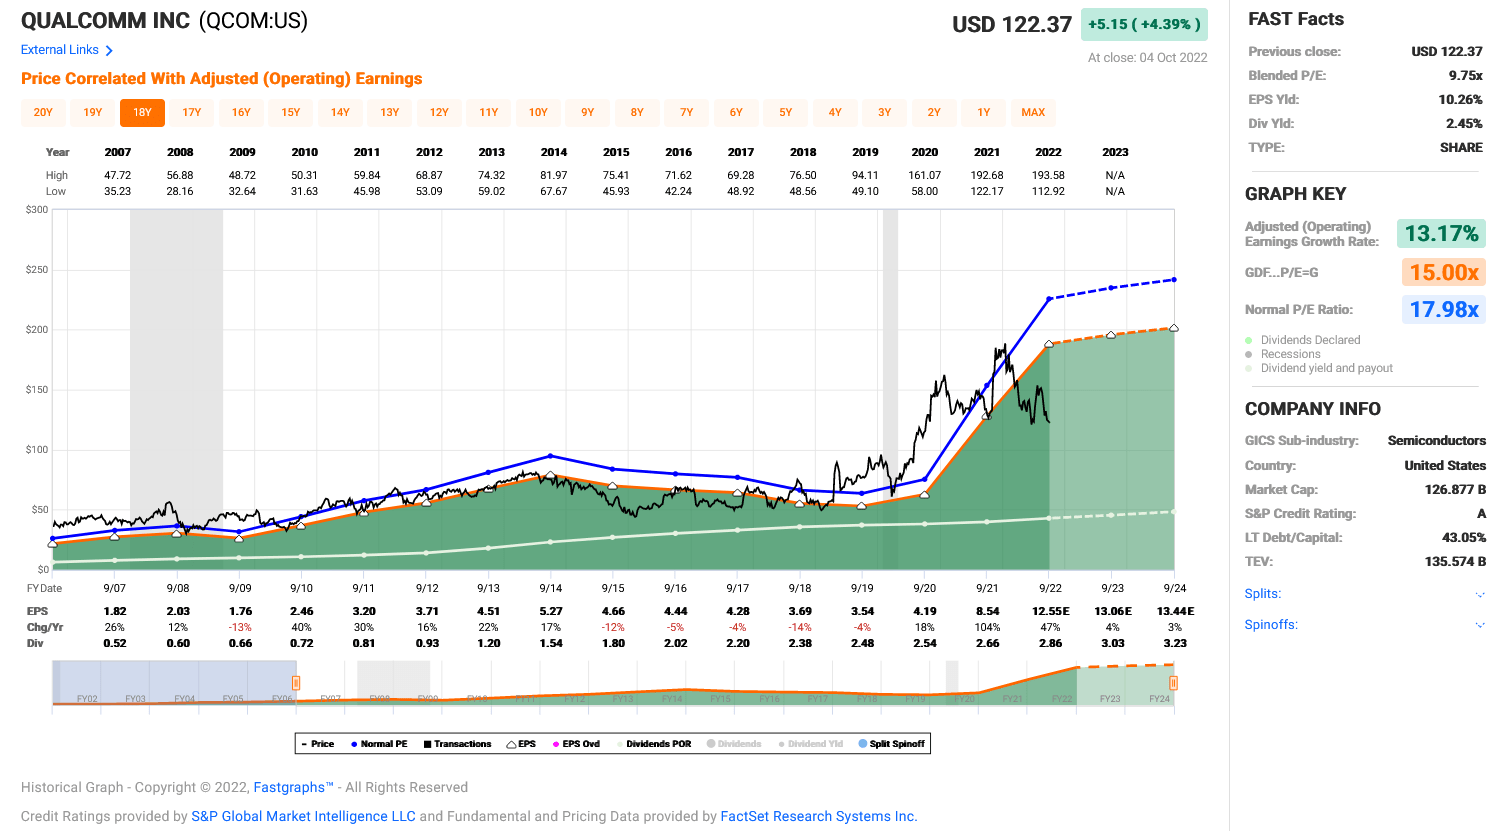
FAST Graphs
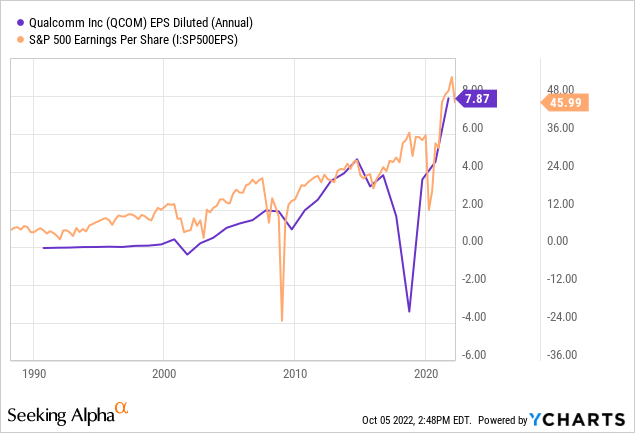
Despite strong long term growth expectations, I remain skeptical that growth estimates in the short term are realistic. Earnings growth estimates for 2023 range from 3.3-3.6%. I think QCOM is likely to experience negative earnings growth next year.
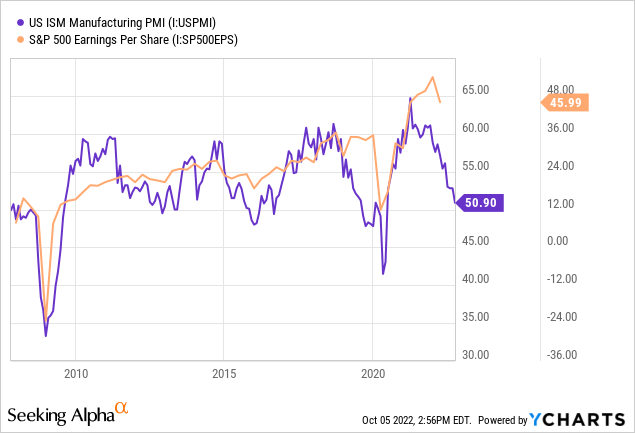
QCOM earnings tend to correlate with earnings of the S&P 500 as the company’s business model generally relies on the strength of the overall economy.
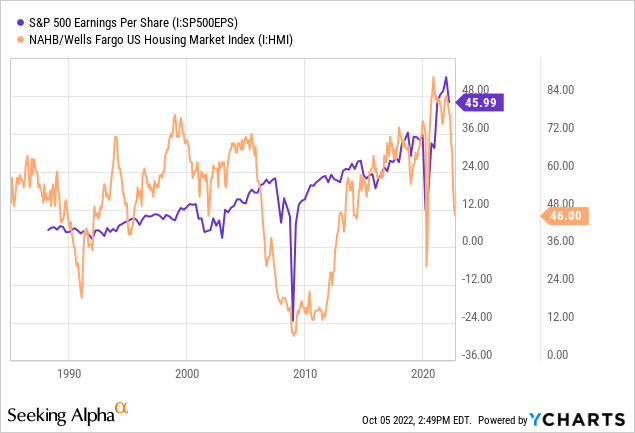
The issue is that I am expecting weakness in the U.S. economy going forward and as a result weakness in earnings. The NAHB Housing Market Index is one indicator of economic activity and tends to lead earnings lower. The index has decidedly declined from 84 to 46 over the last three quarters. This data strongly suggests negative earnings growth for equities in 2023.
Further supporting that forecast is the ISM Manufacturing PMI. This index measures U.S. economic activity and has declined significantly over the last year. This decline suggests that earnings growth is likely to be negative in 2023.
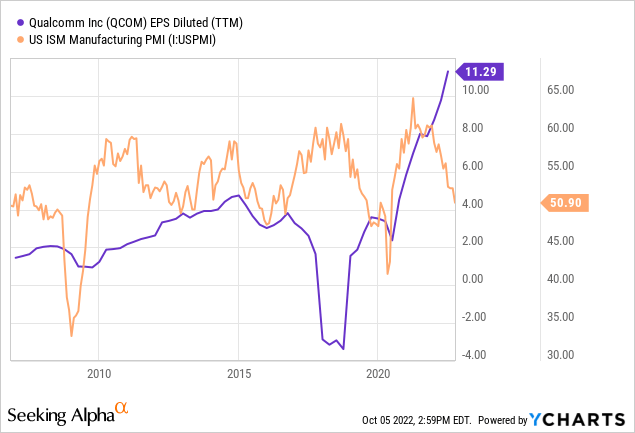
QCOM earnings often follow the ISM data during major changes in trend. Current EPS is significantly diverged from ISM data.
A slowdown in consumer demand for semiconductors has already begun. This is what Roosevelt Investment Group in New York senior fund manager Jason Benowitz had to say about it to Bloomberg:
There’s a palpable fear that the semiconductor cycle has begun to turn negative and demand is slowing. If the downturn turns out to be deeper and longer and more broad, then we would expect technology to also underperform.
This comes after Micron Technology (MU) revised its forward guidance lower. In September, MU revised Q1 revenue guidance lower to $4.0-4.5 billion compared to analyst consensus of $6 billion. This follows the Q4 revenue revision in June that expected $6.8-7.6 billion in revenues compared to analyst consensus of $9 billion.
In July, QCOM revised its Q4 revenue guidance by a much smaller degree with expectations of $11-11.8 billion compared to analyst consensus of $11.86 billion. QCOM is benefiting from a development this week where the Supreme Court declined to hear an appeal from Apple Inc. against QCOM over smartphone patents. QCOM gets to keep the patents and continue supplying Apple products with hardware. Shares have rallied nearly 10% since the decision.
The technical chart is supporting the idea that earnings growth is not going to be strong in 2023. The QCOM chart has lost support at the $122 per share level while a potential head and shoulders setup has developed. In addition, on the daily chart (not pictured) there is a huge gap from 2020 starting at $93 a share.
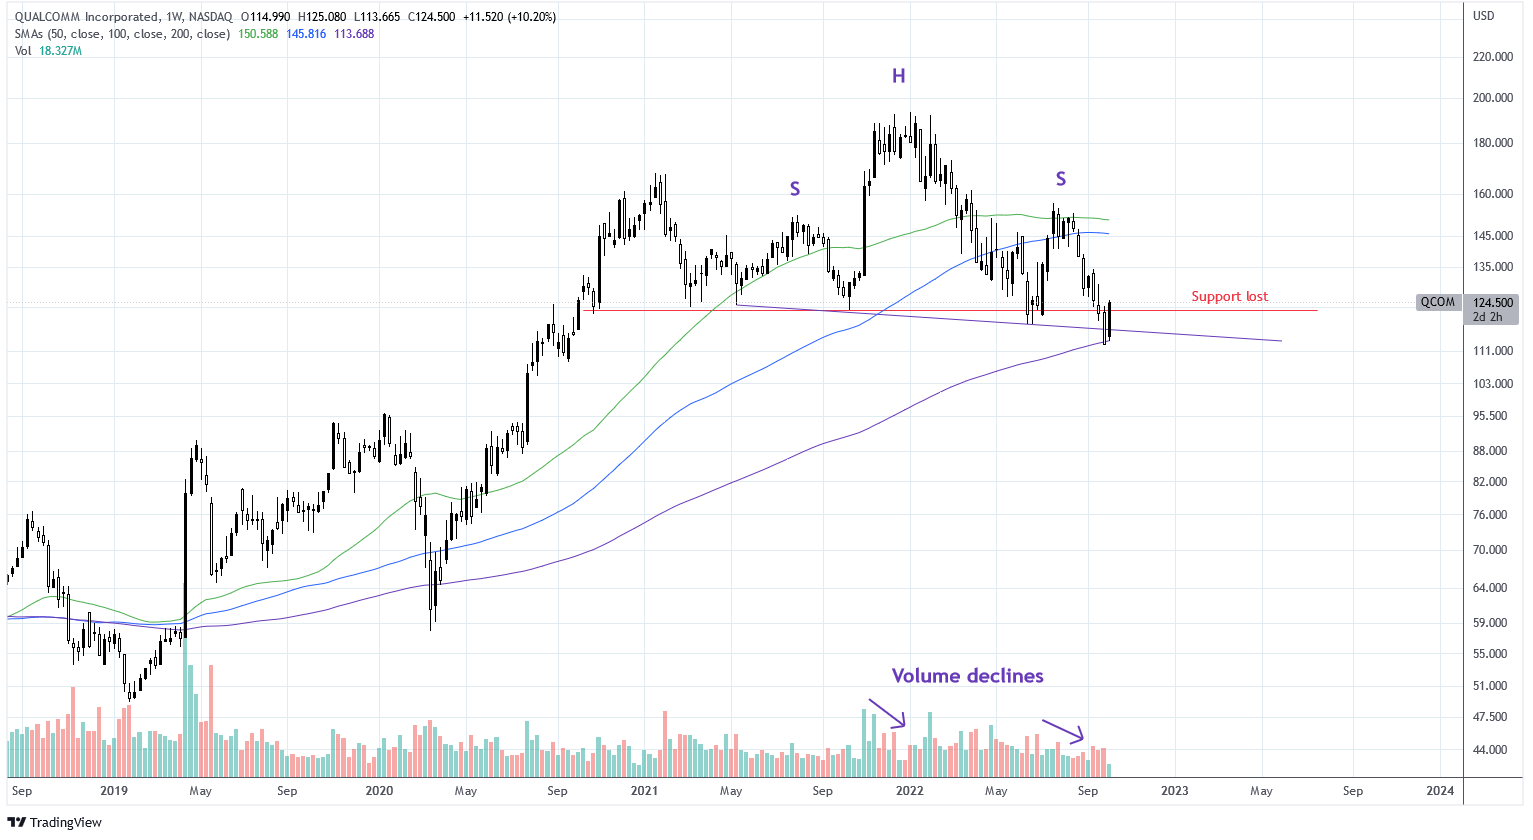
Charts by TradingView (adapted by author)
Qualcomm is on my watchlist. I think that forward earnings estimates are too generous for next year. However, earnings could decline by 40-45% and valuations would only return to the 16-year normal multiple.
I would like to see three things occur as I build a position in QCOM:
- The dividend yield return to its 10-year average of 2.73%. This would correspond to a share price of $110.
- The gap filled at $93 a share.
- Earnings revisions over the next quarter or two that better account for changing economic conditions.
In the meantime, I plan to continue researching the company and refining my entry points for dollar cost averaging. I hope you enjoyed this broad overview of QCOM.
See you next month.
Be the first to comment