

SweetBunFactory/iStock via Getty Images
In this analysis of Tokyo Electron Limited (OTCPK:TOELF), we examined the company following its strong growth during FY2022 of 30.3%. This strong growth propelled it from the 3rd highest market share in 2020 to the highest in 2021. However, we examine the company’s inventory turnover to identify the potential reasons which could include supply chain issues for its recent drop in quarterly revenues by 16.1% QoQ. Following this, we examine its revenue breakdown by Logic and Memory segments and projected its revenue growth going forward.
Company Data, SEMI, Khaveen Investments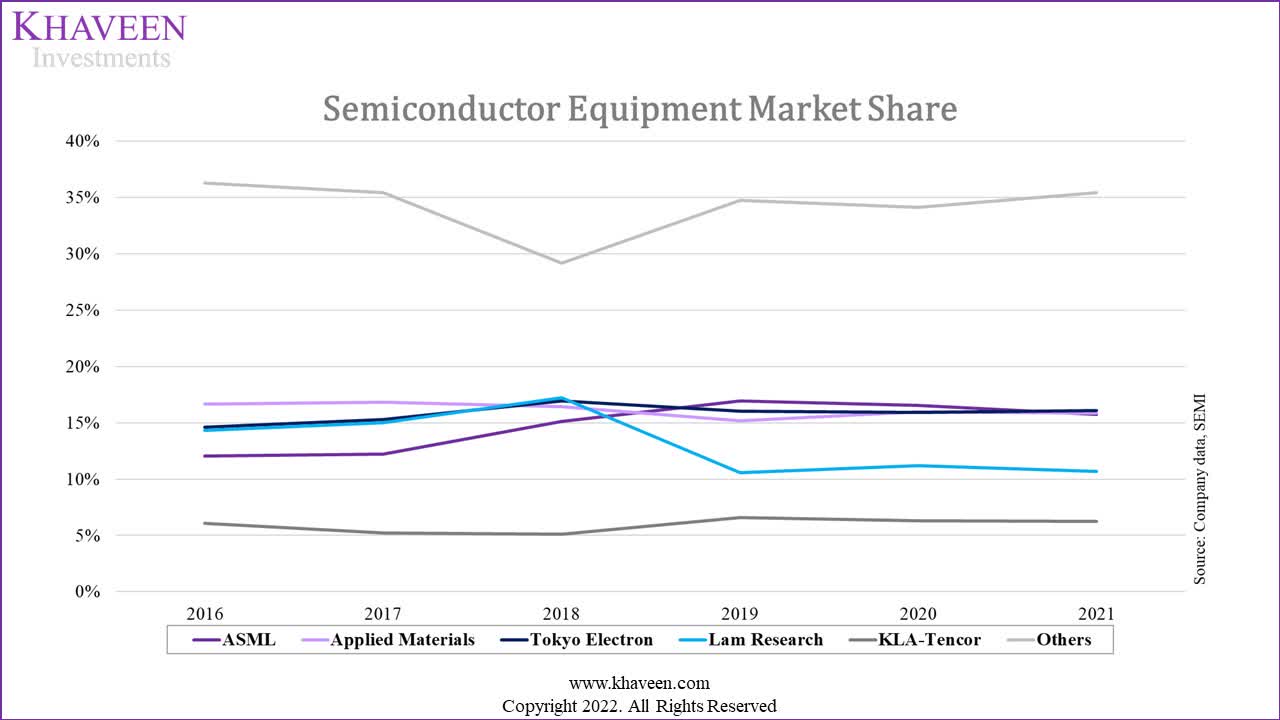
High Growth Despite Supply Chain Issues
|
Companies |
2021 Growth % |
Revenue CAGR 5-year |
|
Applied Materials (AMAT) |
34.1% |
12.7% |
|
ASML (ASML) |
24.0% |
19.8% |
|
LAM Research (LRCX) |
17.8% |
16.5% |
|
KLA (KLAC) |
33.1% |
21.5% |
|
Tokyo Electron |
30.3% |
17.9% |
|
Average |
27.9% |
17.7% |
Source: Company Data, Seeking Alpha, Khaveen Investments
As seen in the table above, Tokyo Electron’s revenue growth in 2021 and its 5-year revenue CAGR are 2.4% and 0.2% above its respective averages. We analyzed the company to determine if it has superior supply management as compared to its other competitors which allowed it to increase its YoY growth % from 20.5% to 30.3% over the past fiscal year.
According to the recent Q1 FY2023 earnings briefing, management has indicated that…
some sales were recognized in Q4 by putting forward the shipment because of high demand.
Management also stated…
on the other hand, there are some shipments shifted to the second quarter as well.
To understand the impact of supply chain disruptions on Tokyo Electron, we analyzed the company’s inventory turnover over the past 5 years and compared it to its competitors.
|
Efficiency Analysis (FY) |
2018 |
2019 |
2020 |
2021 |
2022 |
TTM |
10-year Average |
|
Inventory Turnover Ratio |
2.23x |
2.04x |
1.76x |
1.95x |
2.27x |
2.00x |
2.33x |
|
Days Inventory Outstanding (days) |
164 |
179 |
208 |
187 |
161 |
183 |
168 |
Source: Tokyo Electron, Khaveen Investments
As previously mentioned in our research of Texas Instruments (TXN), the…
company inventory turnover ratio measures its COGS over average inventory and indicates strong sales with higher ratios but could also signal its inventory is not enough to support its sales.
The company’s turnover ratio was on an increasing trend from FY2020 to FY2022, largely in line with its above industry 5-year revenue CAGR. An increasing number of days inventory outstanding from 161 days to 183 days also indicates a reduction in sales or a surplus in supply, as well as it being higher than its 10-year average of 168 days.
|
Inventory Turnover Ratios |
2018 |
2019 |
2020 |
2021 |
TTM |
10-year Average |
|
Applied Materials |
2.63x |
2.18x |
2.47x |
2.86x |
2.71x |
3.35x |
|
ASML |
1.68x |
1.69x |
1.68x |
1.66x |
1.48x |
1.62x |
|
Lam Research |
2.92x |
3.00x |
3.27x |
2.71x |
2.27x |
3.58x |
|
KLA |
1.49x |
1.63x |
1.69x |
1.74x |
1.50x |
1.88x |
|
Tokyo Electron |
2.04x |
1.76x |
1.95x |
2.27x |
2.00x |
2.33x |
Source: Company Data, Khaveen Investments
Despite its efficiency ratios below its 10-year averages, Tokyo Electron fared average among other semiconductor equipment manufacturers. Applied Materials and Lam Research have consistently led in inventory turnover ratios whereas ASML and KLA have lagged due. Notably, all the companies mentioned were below their 10-year averages.
|
Inventories (JPY bln) (FY) |
2018 |
2019 |
2020 |
2021 |
2022 |
TTM |
10-year Average |
|
Finished products |
221 |
234 |
268 |
270 |
184 |
219 |
|
|
% of total |
64.1% |
66.1% |
68.3% |
65.0% |
38.7% |
39.3% |
63.0% |
|
WIP |
75.5 |
62.8 |
69.5 |
80.7 |
144 |
165 |
|
|
% of total |
21.9% |
17.7% |
17.7% |
19.4% |
30.5% |
29.6% |
22.1% |
|
Raw materials and supplies |
48.1 |
57.3 |
54.9 |
64.8 |
146 |
174 |
|
|
% of total |
14.0% |
16.2% |
14.0% |
15.6% |
30.8% |
31.1% |
14.9% |
|
Total |
344 |
354 |
392 |
415 |
474 |
557 |
|
|
Growth % |
45.6% |
2.9% |
10.7% |
5.9% |
14.1% |
13.1% |
|
|
COGS |
656 |
752 |
675 |
834 |
1,091 |
1,124 |
|
|
Growth % |
37.3% |
14.7% |
-10.2% |
23.5% |
30.9% |
||
|
Revenue Growth % |
48.1% |
8.4% |
-9.1% |
20.5% |
30.3% |
14.9% |
Source: Tokyo Electron, Khaveen Investments
As seen above, finished products as a % of total inventory have dropped from an average of 63.0% to 39.3%, likely due to the increase in sales made in Q4 FY2022. WIP, raw materials and supplies have more than doubled since FY2021, indicating that management has taken efforts to prevent a shortage of parts to reduce supply chain disruptions. We can see that COGS increased by JPY32 bln, which is a lower growth compared to its total inventory increase of JPY83 bln, thus resulting in a decrease in the inventory turnover ratio from FY2022 to TTM. Thus, we believe Tokyo Electron is still facing supply chain issues due to its low % of finished products despite its inventory turnover ratio decreasing to 2.00x.
There is also a high correlation between COGS and revenue growth as both have moved in tandem over the past 5 years. Since management brought forward sales from Q1 FY2023 to Q4 FY2022, revenue growth has further increased despite a sharp drop in finished products. However, as we continue to see finished products as a % of total inventory under 40%, we do not expect Tokyo Electron to be able to continue its high growth.
Superior Growth In DRAM
|
Tokyo Electron Revenue (JPY bln) (FY) |
2018 |
2019 |
2020 |
2021 |
2022 |
5-year CAGR |
|
Non-volatile memory (NAND) |
325 |
338 |
150 |
252 |
324 |
|
|
Growth % |
111.2% |
3.9% |
-55.7% |
68.0% |
28.9% |
-0.1% |
|
DRAM |
191 |
274 |
155 |
236 |
391 |
|
|
Growth % |
100.5% |
43.7% |
-43.4% |
52.2% |
65.6% |
19.7% |
Source: Tokyo Electron, Khaveen Investments
Tokyo Electron’s revenue is broken down into its Logic and Memory segments, its Memory segment consists of NAND and DRAM revenues. Based on the table above of Tokyo Electron’s revenue breakdown by NAND and DRAM segments, its DRAM segment shows superior growth with a higher 5-year revenue CAGR of 19.7% from FY2018 to FY2022 compared to its NAND segment at a CAGR of -0.1%. We compared Tokyo Electron’s segment revenue growth with the DRAM and NAND semiconductor market revenue in the table below.
|
Worldwide Semiconductor Revenue ($ bln) |
2017 |
2018 |
2019 |
2020 |
2021 |
5-year CAGR |
|
Flash memory (NAND) |
56.5 |
63.2 |
46.0 |
56.7 |
68.6 |
|
|
Growth % |
45.3% |
11.9% |
-27.2% |
23.1% |
21.1% |
5.0% |
|
DRAM |
71.71 |
99.66 |
62.48 |
67.04 |
94.92 |
|
|
Growth % |
76.4% |
39.0% |
-37.3% |
7.3% |
41.6% |
7.3% |
Source: WSTS, IC Insights, Trendforce, Khaveen Investments
As seen above, the DRAM market grew at a higher 5-year CAGR at 7.3% compared to NAND at 5%. This is in line with Tokyo Electron where its DRAM segment outperformed its NAND segment. Thus, we attribute its outperformance to the superior DRAM market growth compared to the NAND market. According to our analysis on Micron (MU) previously, we analyzed the increase in DRAM pricing and “attributed rising demand for DRAM” as well as the “shift towards DDR5 further supports our forecast for DRAM pricing to increase going forward with the existing price premium”, which we believe are fundamental reasons for the superior growth of the DRAM market.
|
Tokyo Electron Revenue (JPY bln) |
2021 |
2022 |
2023F |
2024F |
2025F |
2026F |
2027F |
|
Non-volatile memory (NAND) |
252 |
324 |
341 |
358 |
375 |
394 |
414 |
|
Growth % |
68.0% |
28.9% |
5.0% |
5.0% |
5.0% |
5.0% |
5.0% |
|
DRAM |
236 |
391 |
419 |
449 |
482 |
517 |
555 |
|
Growth % |
52.2% |
65.6% |
7.3% |
7.3% |
7.3% |
7.3% |
7.3% |
Source: Tokyo Electron, Khaveen Investments
Therefore, we expect the company’s DRAM segment revenue growth to remain superior to the NAND segment growth and projected its revenue growth based on the historical 5-year DRAM and NAND market CAGR of 7.3% and 5% respectively which translates to revenues of JPY 414 bln for its NAND segment and JPY555 bln for its DRAM segment by 2027.
Increasing Sales From The Logic Segment
|
Tokyo Electron Revenue (JPY bln) (FY) |
2018 |
2019 |
2020 |
2021 |
2022 |
5-year CAGR |
|
Logic |
299 |
277 |
460 |
475 |
784 |
|
|
Growth % |
-0.8% |
-7.4% |
66.3% |
3.3% |
64.9% |
27.3% |
|
Memory |
516 |
612 |
305 |
488 |
715 |
|
|
Growth % |
107.1% |
18.6% |
-50.2% |
60.0% |
46.6% |
8.5% |
Source: Tokyo Electron, Khaveen Investments
Furthermore, we compared Tokyo Electron’s revenue between its Logic and Memory segment (comprised of NAND and DRAM) in the table above. The company’s Logic and Memory segments were similar in size at JPY784 bln and JPY715 bln in revenue respectively, but its Logic segment had a higher 5-year CAGR of 27.3% compared to its Memory segment at only 8.5%.
|
Worldwide Semiconductor Revenue ($ bln) |
2017 |
2018 |
2019 |
2020 |
2021 |
5-year CAGR |
|
Logic |
102 |
109 |
107 |
118 |
155 |
|
|
Growth % |
11.7% |
6.9% |
-2.5% |
11.1% |
30.8% |
10.9% |
|
Memory |
123 |
156 |
124 |
127 |
159 |
|
|
Growth % |
60.4% |
26.8% |
-20.9% |
2.8% |
25.2% |
6.3% |
Source: WSTS, IC Insights, Trendforce, Khaveen Investments
Based on the table above of the Logic and Memory semiconductor market, the Logic semiconductor market had a higher 5-year CAGR of 10.9% compared to the Memory market at a CAGR of 6.3%. This is a similar trend with Tokyo Electron where its Logic segment had superior growth compared to the Memory segment above.
|
Customers (JPY bln) |
2022 |
% of Total Revenue |
2021 |
% of Total Revenue |
|
Samsung Electronics (Logic and Memory) (OTCPK:SSNLF) |
312.3 |
15.5% |
256.7 |
16.6% |
|
Intel (Logic) (INTC) |
304.0 |
15.1% |
193.7 |
12.5% |
|
TSMC (Logic) (TSM) |
231.4 |
11.5% |
164.3 |
10.6% |
Source: Tokyo Electron, Khaveen Investments
According to its annual report, Tokyo Electron’s top 3 largest customers are Samsung, Intel and TSMC representing 42.1% of revenue. We analyzed the company’s customer capex in the following table below. These companies’ capex is important for Tokyo Electron as the company’s revenue is derived from these companies’ capex spending.
|
Capex ($ bln) |
2017 |
2018 |
2019 |
2020 |
2021 |
5-year CAGR |
|
Samsung |
24.2 |
16.9 |
19.9 |
27.9 |
38.1 |
|
|
Growth % |
114.2% |
-30.2% |
17.8% |
40.2% |
36.6% |
12.0% |
|
Intel |
15.8 |
11.2 |
14.4 |
20.8 |
25.2 |
|
|
Growth % |
-38.9% |
-28.7% |
28.2% |
44.4% |
21.0% |
12.4% |
|
TSMC |
11.3 |
10.3 |
15.3 |
18.0 |
30.2 |
|
|
Growth % |
-7.1% |
-9.3% |
49.3% |
17.4% |
67.6% |
27.8% |
Source: Tokyo Electron, Khaveen Investments
As seen, TSMC, the company’s 3rd largest customer had the highest 5-year CAGR for its capex at 27.8% followed by Intel, its second-largest customer at 12.4% while Samsung has the lowest CAGR among the 3 companies at 12%. Overall, this highlights the superior growth of its pure-play logic customers’ capex which we believe explains Tokyo Electron’s Logic segment outperformance to its Memory segment.
|
Tokyo Electron Revenue (JPY bln) |
2021 |
2022 |
2023F |
2024F |
2025F |
2026F |
2027F |
|
Logic |
475 |
784 |
870 |
965 |
1,070 |
1,187 |
1,317 |
|
Growth % |
3.3% |
64.9% |
10.9% |
10.9% |
10.9% |
10.9% |
10.9% |
Source: Khaveen Investments
All in all, we believe the company’s top logic customers capex growth supports its Logic segment growth. We expect the company’s Logic segment to continue to outperform its Memory segment growth. We projected the company’s Logic segment growth on the Logic semiconductor market 5-year historical CAGR of 10.9%. With this, we projected its Logic revenue to reach JPY1,317 bln by 2027.
Risk: Supply Chain Disruptions
We believe Tokyo Electron’s revenues could be impacted if it continues to face shipping backlogs in the US and Europe which make up nearly 20% of its yearly revenues. In its medium-term plan issued in June 2022, Tokyo Electron plans to incorporate “proactive procurement strategies to ensure smooth delivery to customers” to reduce delays which we believe could help the company work around its supply chain issues.
Verdict
We expect its Logic segment would remain the key driver of its revenue growth at a growth rate of 10.9% based on the Logic market growth and buoyed by its major customers’ capex. Furthermore, we expect its Memory segment growth to be supported by the superior growth of DRAM compared to NAND.
|
Tokyo Electron Revenue (JPY bln) |
2021 |
2022 |
2023F |
2024F |
2025F |
2026F |
2027F |
|
Logic |
475 |
784 |
870 |
965 |
1,070 |
1,187 |
1,317 |
|
Growth % |
64.9% |
10.9% |
10.9% |
10.9% |
10.9% |
10.9% |
|
|
Memory |
488 |
715 |
760 |
807 |
857 |
911 |
968 |
|
Growth % |
46.6% |
6.2% |
6.2% |
6.2% |
6.3% |
6.3% |
|
|
Total Revenue |
963 |
1,499 |
1,629 |
1,772 |
1,928 |
2,099 |
2,286 |
|
Growth % |
55.6% |
8.7% |
8.7% |
8.8% |
8.9% |
8.9% |
Source: Tokyo Electron, Khaveen Investments
We expect the revenues of Tokyo Electron to grow at an average of 8.8% in the next 5 years as seen in the table above which we believe is appropriate due to its supply constraints and shortages as we analyzed the company’s larger decline in finished products compared to its total inventory. According to analysts’ estimates, the average target price of Tokyo Electron on the Japan stock exchange is JPY46,900 ($314) which is an upside of 22.2%, thus we rate the company as a Buy.
Be the first to comment