

Ryan Rahman/iStock Editorial via Getty Images
This is my third article on the Motley Fool 100 Index ETF (BATS:TMFC), a passively-managed exchange-traded fund that invests in an around 100-strong cohort of mega/large-cap U.S. stocks, which The Motley Fool analysts consider are poised to outperform the market over time. These are bellwether companies with resilient margins and robust growth prospects. In fairness, they should boast premium valuation in most cases. But is this an adequate proposition amid the prevailing zeitgeist? This year has been painful for this strategy.
I have never been especially enthusiastic about the fund’s prospects in the higher interest rates environment. In the first note published in January, I did acknowledge the ETF’s comparatively short history was nothing short of successful, with alpha delivered in 2019 and 2020, though total return in 2021 was marginally weaker compared to the iShares Core S&P 500 ETF (IVV).
However, the market regime had changed. It is complicated not to notice it when the bear market is raging. The unstoppable FAANGM and broad tech sector rally (acronyms vary) has no longer been the case already in January. And TMFC’s equity mix titled towards high-multiple growth echelon was the wrong place to be as the growth premia re-evaluation was about to gain momentum. And even though TMFC has been declining almost incessantly this year, I am not yet confident whether the infliction point is near, and whether the bulls are about to regain control.
Bellwethers drift lower as growth premia become thinner
2022 for TMFC has been simply calamitous, with only March being more or less successful, with a positive total return of around 5%. April was totally disastrous; it appeared its worst month since its inception in January 2018. The depth of decline dwarfs both December 2018 and March 2020. What is more discouraging is that in both cases, it staged a recovery, especially sharply rebounding in April 2020 as the market was enthusiastically rallying after the first few weeks of the pandemic chaos. This year, it has continued drifting lower in May and June. The first half of July did not offer relief either.
Created by the author using data from Portfolio Visualizer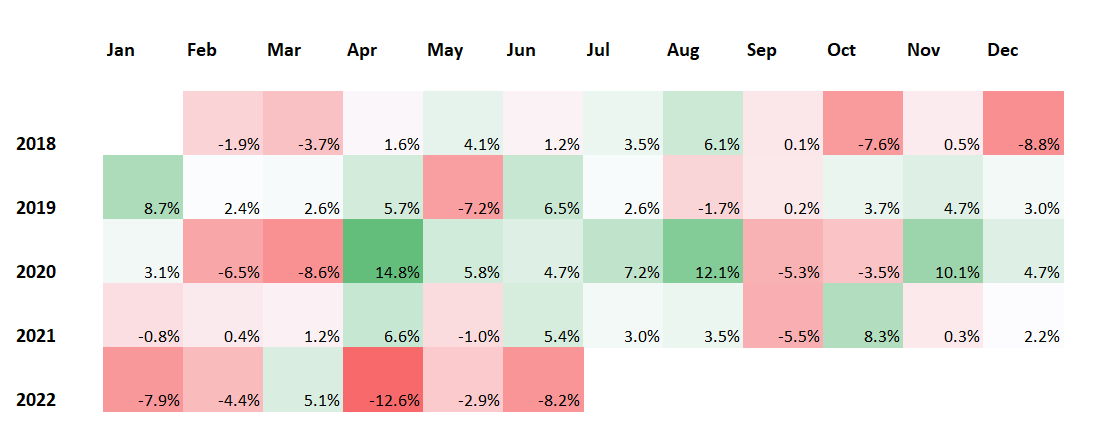
Since my April article, TMFC’s price has declined by ~12.5%, underperforming the S&P 500, partly proving my point that the exorbitant valuation of most of its holdings would be a drag on its performance, regardless of how solid was its exposure to the profitability factor.
Today, I would like to provide an in-depth review of the fresh version of the TMFC portfolio, addressing the additions/deletions made during the quarterly reconstitution, and harness the power of the Quant data to answer the question of whether factors have become more supportive of the upside.
A few minor portfolio adjustments, similarly bloated valuations
In the wake of TMFC’s underlying index’s most recent quarterly reconstitution, six stocks were shown the door while five were added; both groups have weights of just a few percentage points. That is to say, the portfolio remained comparatively homogeneous as its principal positions have not been changed. So at least judging by this year’s investment decisions made by the fund, it keeps its equity mix more or less stable, as the large-cap cohort of the TMF recommendation universe does not face major revamping.
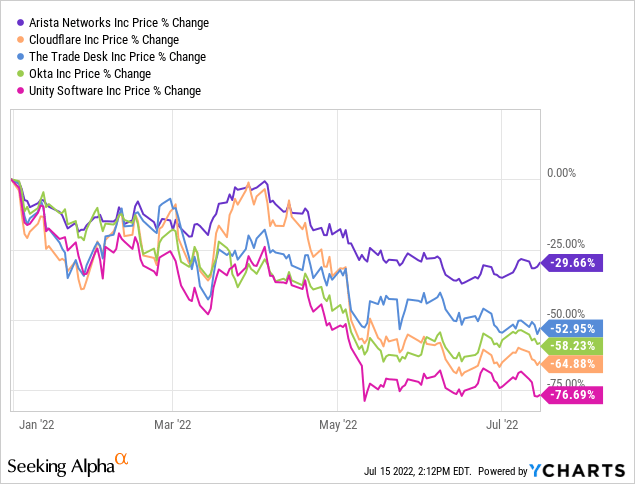
As the dataset on its website illustrates, TMFC now has no exposure to the following companies that were present in the end-April version of its portfolio:
| Arista Networks (ANET) | 0.18% |
| Cloudflare (NET) | 0.16% |
| The Trade Desk (TTD) | 0.14% |
| Okta (OKTA) | 0.11% |
| Unity Software (U) | 0.11% |
| Embecta (EMBC) | 0.01% |
As I mentioned in the previous article, EMBC is a small-cap company spun off from Becton, Dickinson and Company (BDX), a healthcare equipment manufacturer, in April. It did not look fit into the TMFC large-cap high-conviction strategy, so it was removed upon the reconstitution as I expected.
The other five stocks have likely seen their TMF bullish ratings removed, and thus were ousted from the TMFC portfolio. It should be noted that their performance this year has been simply dismal, with U’s catastrophic decline recently exacerbated by the acquisition announcement and the trimmed FY growth outlook being the deepest in the group.
The five additions are shown below:
| Texas Instruments (TXN) | 0.79% |
| S&P Global (SPGI) | 0.64% |
| Lowe’s Companies (LOW) | 0.64% |
| Copart (CPRT) | 0.14% |
| CoStar Group (CSGP) | 0.12% |
Interestingly, CPRT could be found in the January version of the portfolio, then the fund exited its position, and now it seems it once again showed up in the TMF recommendation universe and qualified from the TMFC portfolio. The same is fair in the case of CSGP.
Expectedly, little has changed in terms of sector exposure. It seems TMFC is still decidedly bullish on tech, with almost 42% allocated to it as of July 14. Its tilt looks somewhat permanent, owing to the market-cap weighting, so I do not expect it to change going forward. The consumer discretionary sector comes second, with a close to 16% weight. Of course, it holds Tesla (TSLA) and Amazon (AMZN); other stocks from the CS sector have just ~5.2% weight. There are trace amounts of energy and materials stocks, with a total weight of less than 1%.
The minor adjustments made to the portfolio discussed above beg a question of whether TMFC’s exposure to returns-driving factors has changed, for better or worse. Well, it merits guessing that the steep decline in the price could firstly result in a major improvement in valuation.
However, the harsh reality is that even after a stormy first half of 2022, the multiples across its holdings have compressed only slightly. We see just six value players (a B- Valuation grade or better) present in the fund, with 2.2% combined weight; almost nothing has changed since April when this figure stood at ~2.4%.
Created by the author using data from the fund and Seeking Alpha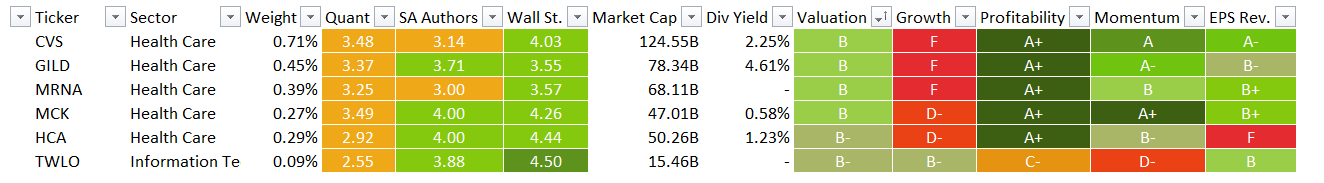
Below are selected valuation metrics for the group:
Data as of July 14 (Created by the author using data from the fund and Seeking Alpha)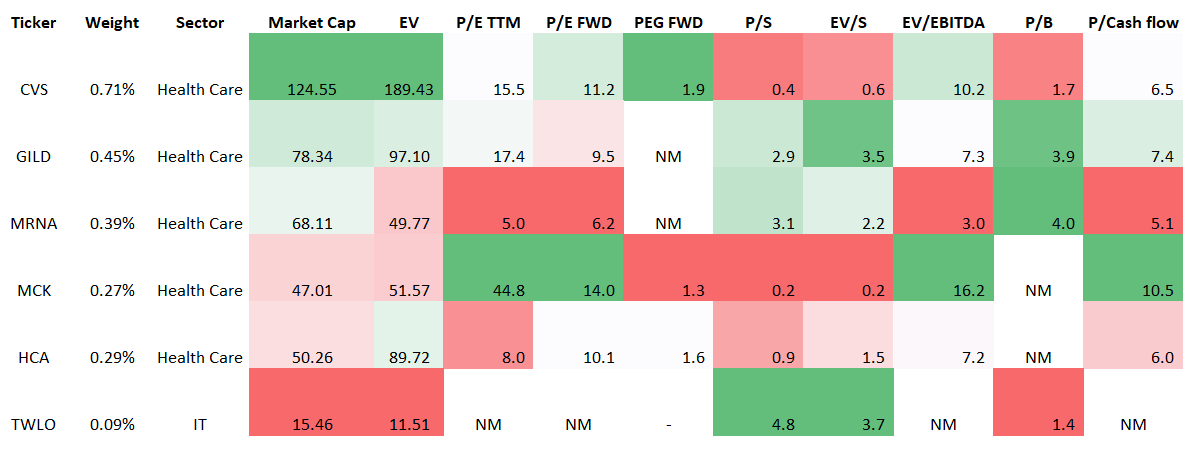
Around 80.3% are priced for perfection, having a D+ Quant Valuation grade or worse. This is better compared to January (~89%) but in line with April (~81%). And the top-20 cohort is still rife with stocks that are priced at a material premium to their sectors, partly justified by exemplary quality, but in many cases not backed by sector-leading growth rates.
Created by the author using data from the fund and Seeking Alpha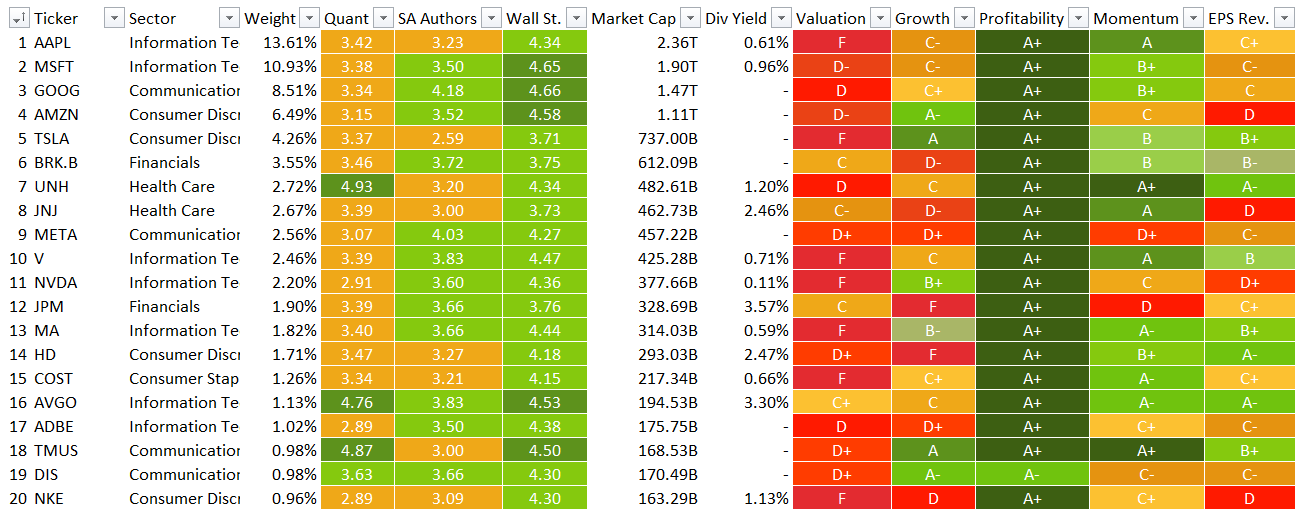
I also believe it is again worth touching upon growth profiles. In the April note, I said that I spotted a tendency the growth rates of the TMFC holdings were becoming weaker. This time, I should admit that the trend remains intact.
The weight of stocks with at least 20% forward revenue growth rates has fallen to ~28% to ~24%. The share of those with 20%+ Forward EPS growth rates has declined from ~54% to ~52.4%. The outlook for EBITDA has also become much bleaker: those with 20% growth rates and better account for only 48.8% vs. almost 60% in April.
Conclusion
The growth-centered strategies have been hit hard this year, TMFC being no exception. Initially, it was the investor exodus from high-multiple stocks as a preemptive step to prepare for the end of the ultra-loose monetary policy era. Then it was geopolitics that wreak havoc upon commodity markets, accelerated inflation, and spurred the reduction in growth premia in an anticipation of meaningfully higher interest rates. Of late, recession fears were added to this mix. Unfortunately, in this environment, I see no material reason to upgrade TMFC to a Buy.
Be the first to comment