

Torsten Asmus
The bond bubble burst
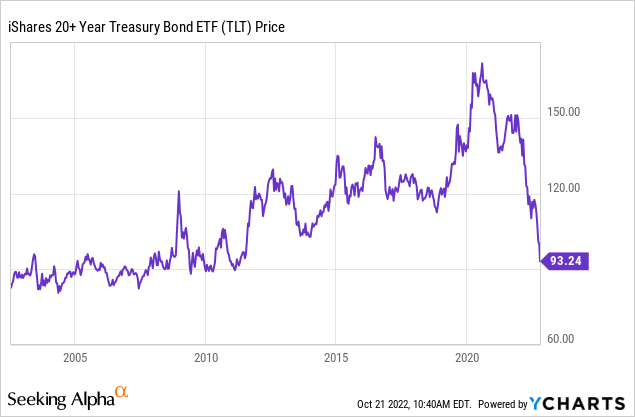
The ETF that tracks the price of long-term Treasury Bonds (NASDAQ:TLT) is down by 35% YTD in 2022 and down by 45% since July 2020. How about this, TLT is down by 24% since October of 2012 – that’s over the last 10 years. Lousy investment for anybody who bought it over this period. Even the investors who bought this ETF at the inception in 2002 are near the break-even point. The 2022 bond selloff qualifies as the bond bubble burst. Here is the TLT chart:
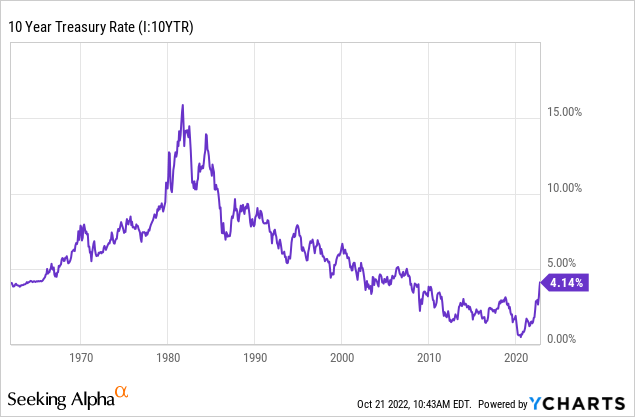
As the bond price decreases, the interest rate rises. Thus, the yield on 10Y Treasury bond increased from about 0.5% in 2020 to over 4% in 2022 as the bond bubble busted. Is now the time to buy TLT and take advantage of much higher yields? Or, will TLT continue to fall as the interest rates continue to rise?
The long-term chart of 10Y Treasury yields shows that we are approaching the key level of 5%, which was the support level in the 1990s, and the key resistance level right before the 2008 great financial crisis. I will make the case in this article that we are very likely to see the yield on 10Y Treasury rise to 5%, and thus TLT will likely continue to fall.
The nominal yield decomposition
The 5% yield level on 10-Year Treasury Bond is the nominal interest rate level, which can be decomposed into the 1) real interest rate and 2) the inflation expectations.
The chart below shows that during the 1980s and 1990s, the real interest rate and the inflation expectations were very close to each other and tracking each other perfectly. For example, in July of 2006, the nominal interest rate in 10Y Treasury was 5%, where the real interest rate was around 2.5% and the inflation expectations were also around 2.5%.
The chart also shows that after the 2000 dot.com bubble, the real interest rate (in red) started to trend below the inflation expectations (in blue). The brief period of relatively lower real interest rates in early 2000s caused the housing bubble and the great financial crisis in 2008.
The Fed stepped up the manipulation of interest rates via Quantitative easing (QE), or bond-buying program during the 2008 financial crisis and continued with several rounds of QE until the aftermath of the Covid-related shock in 2020. As a result, the real interest rates collapsed to near the 0% level, and even lower to below the -1% level, while the nominal interest rates converged with the inflation expectations, which remained around the 2.5% level on average.
FRED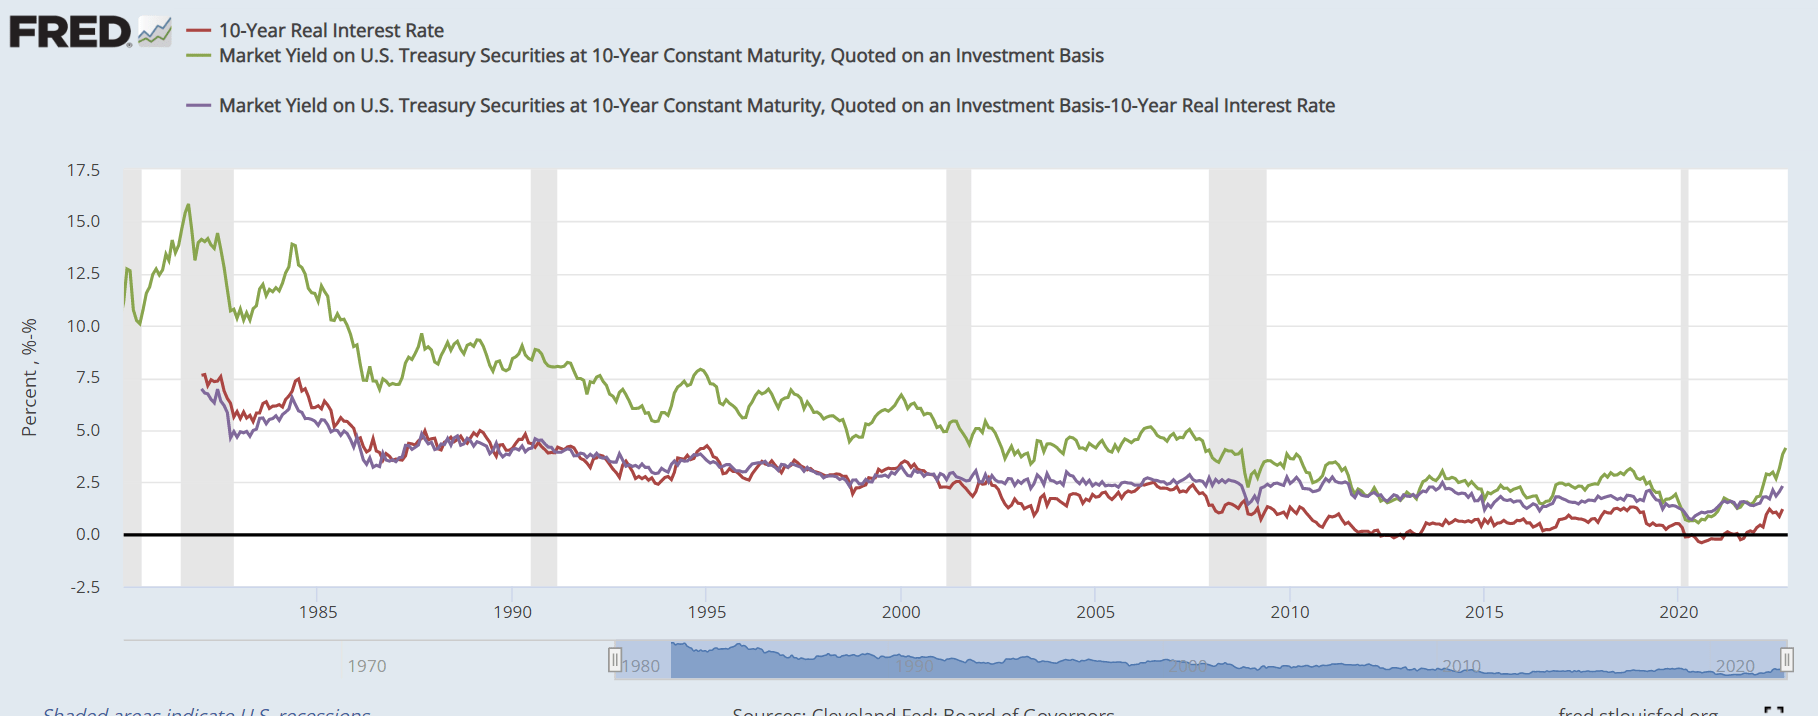
The inflation shock of 2022
The extra-long period of manipulated real interest rates eventually caused the massive inflationary shock, supported with the covid-related supply shock and the escalating geopolitical situation. The chart below shows the difference between the Federal Funds rate and the CPI inflation. Note, the Federal Funds rate (SHY) is usually above the headline CPI inflation, with the brief periods of inversion usually during the recessions.
However, after the 2008 financial crises, the Federal Funds rate was consistently below the CPI inflation. Such ultra-stimulative policy culminated in the record negative spread of over 8% in 2022 – where inflation spiked to over 8%, while the Federal Funds rate was still near 0%.
If the Fed is serious about reducing inflation, it has to increase the Federal Funds rate over the CPI inflation, and if the CPI stays above 8%, that means the Fed has to hike to over 8%. The Fed can only hope the CPI will fall.
Either way, the long-term rates are on defense as long as the Fed is chasing inflation higher over the near term, which does not bode well for TLT.
FRED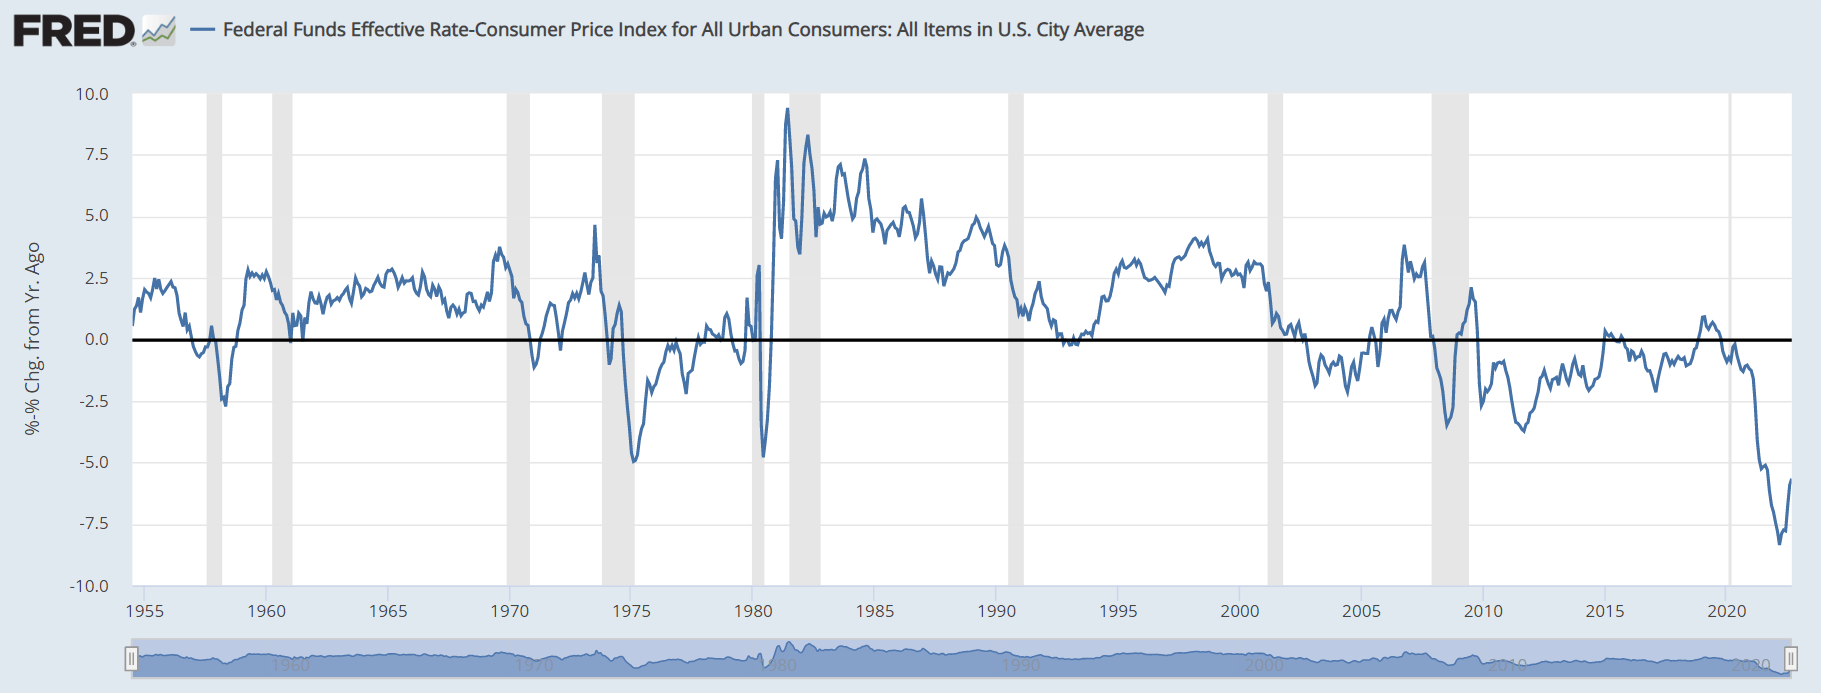
Long-term predictions
Over the longer term, I first assume that the Fed will have to allow the bond market to return to normalcy where the real interest rates would match the inflation expectations. In fact, the Fed is currently implementing the Quantitative Tightening (QT) program, and the real rates have been rising sharply in response.
Second, I assume that at minimum, inflation expectations would remain anchored at near the 2.5% level. Note, this is an optimistic scenario which assumes that that the CPI falls to near the long-term target of 2% over the near term. Thus, the real interest rates have to rise to around 2.5%, which produces at minimum 5% nominal interest rate on 10-Year Treasury.
The current equation:
Nominal yield 4.21% = Real yield 1.66% + Inflation expectations 2.55%.
Implication – the real yield is expected to continue rising towards the 2.5% level.
The upside risk
Obviously, the upside risk is the inability of the Fed to accomplish the 2% inflation mandate, and directly accepting the higher inflation target of 3-3.5% CPI inflation.
In my view, globalization has been the key dis-inflationary variables since the 1980s. Unfortunately, we are currently in an unfolding trend of de-globalization, which is longer-term inflationary. Thus, there is a considerate upside risk which could push the nominal yields on 10 Year Treasury Bonds above the 5% level.
The downside risk
The downside risk is obviously a very deep recession over the near term, which would possibly require another round of QE and negative real-interest rates.
In fact, I replicated the NY Fed’s recession probability model using the 10y-2Y spread as the predictor instead of 10y-3mo spread, and find that the probability of a recession over the next 12 months is very high, higher than before the 2008 recession. Here is the chart:
Global Academic View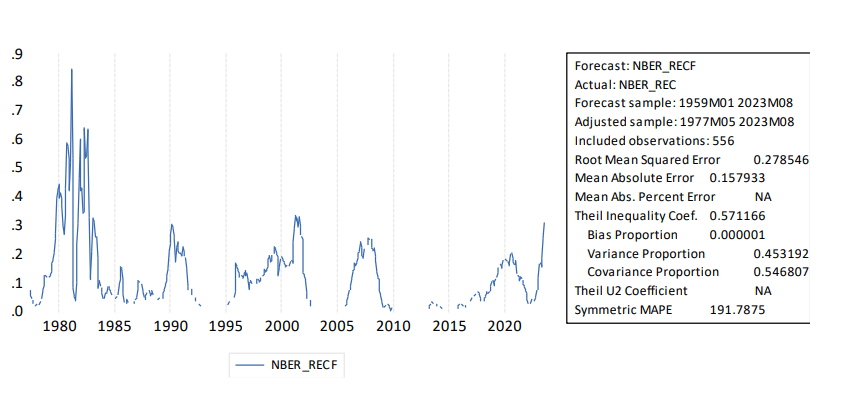
Thus, the downside risk is also very high. However, the issue is what happens if the US economy slips into a recession, while the CPI inflation remains significantly over the 2% target? This is definitely a nightmare scenario, but possible given the de-globalization induced inflationary pressures.
Implications
The ETFs that tracks long term Treasury rates TLT is still not a buy at these levels. Investors got used to the Fed’s manipulation of real interest rates, but this sems to be over for now. The real rates are on their way up, and the nominal rates will follow higher to above the 5% level.
It’s probably too late to sell now, for investors who didn’t sell before the crash. Shorting 10Y Treasury is risky given the high recession probability. For now, the strategy is to wait for the opportunity to buy, as the rates reach and exceed the 5% level, and as the recession approaches.
Be the first to comment