

artisteer/iStock via Getty Images
Time to de-risk. I posted an article on Seeking Alpha on June 24 entitled Two-And-A-Half Weeks Before Topping Out. In this article, I contended that the stock market had a relatively clear path for a bounce through the first full week of July before a series of major headwinds arrived that could push the market back lower. Following up on this past article, we have arrived at mid-July. And it is time to derisk.
Further changes on the margins. It is worth noting that this decision to derisk is only the latest in a series of adjustments at the portfolio strategy margins that I have been making since late last year. Barring extraordinary circumstances, at no point should investors be making major changes to their portfolio all at once. Instead, adjustments to a disciplined asset allocation strategy should be made gradually over time as new information and data are provided by the economy and the marketplace.
A properly diversified strategy should already be prepared in advance through its broad structure to withstand meaningful downside pressure in one or more of its component categories at any given point in time, as capital rotation to other asset classes should help offset declines. This is why a broad asset allocation strategy should not be limited simply to only stocks or a plain vanilla blend of stocks and bonds (i.e. 60/40) for that matter. True portfolio diversification involves a wide range of uncorrelated asset classes all working together to generate returns while managing against downside risk, thus working to optimize risk-adjusted returns.
Time to reduce stock allocations. It appears that the bounce in stocks may have run its course. And what a lackluster bounce it has been.
StockCharts.com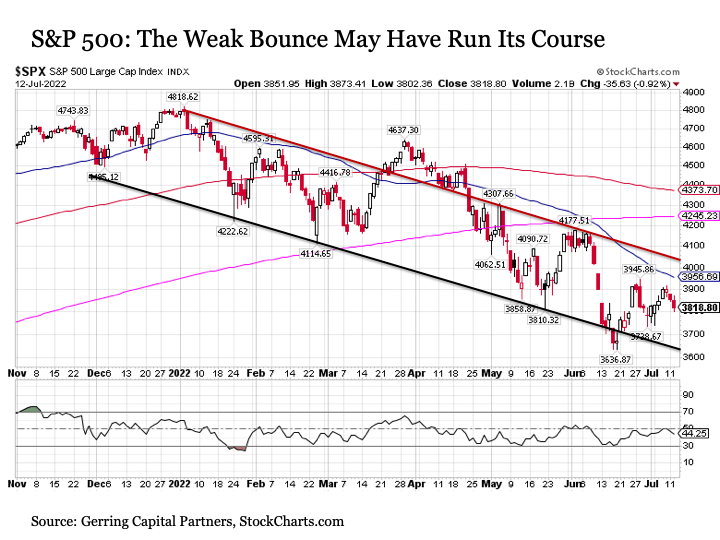
The S&P 500 initially surged from its fresh cycle lows of 3636 in mid-June to back above 3900 heading into the final week of the month. But since June 28, the market has been grinding back and forth, with a fade into the end of Q2 followed by solid four-day rally at the start of July and then three days of fading back lower through today. In the process, the S&P 500 has yet to come anywhere close to getting back to the top end of its downward sloping trading channel. And with its 50-day moving average (blue line in chart above) increasingly pressing down on the headline index, it may be hard pressed to get back to the top end of this range any time soon.
So why not hang on to see if the S&P 500 can still push higher back toward 4000 in the coming weeks? It is certainly possible that the S&P 500 could still find its upside mojo in the days ahead, but additional indicators suggest it may be a tough fight higher from here.
StockCharts.com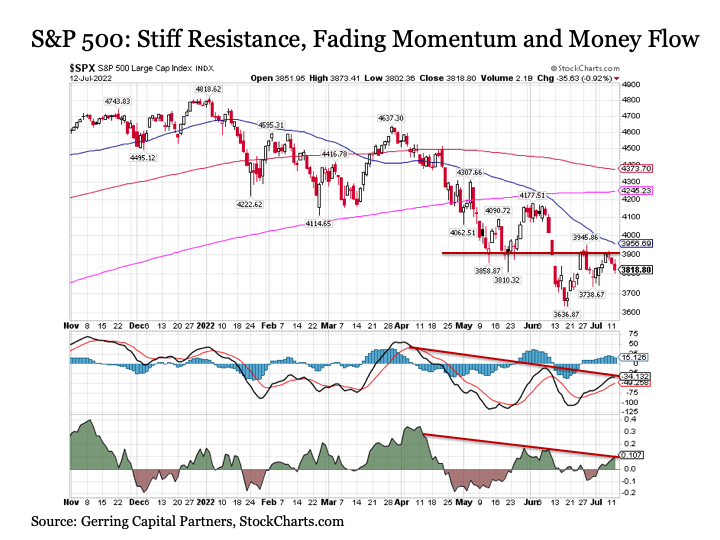
For example in the chart above, we see that the S&P 500 has encountered what has turned out to be stiff resistance over the past month at the 3900 level, which had been a level of support for the market back in May. In addition, not only is the Relative Strength Index (RSI) for the S&P 500 still remaining stubbornly stuck at 50 or below since the start of the year as shown in the previous chart, which is definitively bearish, but both momentum as measured by the MACD and the Chaikin Money Flow continues to steadily fade.
The going gets tough from here. Beyond the technicals, a variety of fundamental and mechanical market factors are also looming as potential downside threats in the days and weeks ahead.
First, the latest reading on inflation for June according to the Consumer Price Index (CPI) is set to be released on Wednesday morning. While the Core CPI has been fading for month, it is expected that the headline CPI for June is likely to come in hot thanks in part to gasoline prices that peaked last month. Although headline inflationary pressures may indeed ease from here to join its core counterpart that has already been cooling for the last few months, we won’t get any confirmation of this potential outcome until mid-August, by which the damage will be done including an additional nudge to an already highly reactive U.S. Federal Reserve at this point. And this assumes that headline inflation doesn’t actually reaccelerate by the time July is out.
Next, second quarter earnings season is just getting underway, and forward estimates still look awfully high for an economy that appears increasingly likely to be heading toward not only recession but a potential hard landing. While corporate earnings may remain resilient and hold their ground, the potential for downward revisions to the outlook could apply additional valuation pressure to a stock market that is already struggling (i.e. if the “E” is falling faster than the “P” in the P/E ratio, stocks could become more expensive even if they are declining sharply in price.
Also, the U.S. Federal Reserve stands ready to drop another 75-basis point rate hike onto capital markets toward the end of the month. The futures market right now is pricing in a more than 91% probability that we’ll see 75-basis point hike come July 27, so the announcement itself should not be a surprise to investors. But what is worrying is that overall market liquidity already becomes notably light in late July and throughout August. Given that stocks are already priced at a significant premium to historical valuations, any liquidity dislocations that might occur similar to what we saw with the flash crashes during the spring of 2010 or the summer of 2015 could lead to unexpected air pockets to the downside, particularly since the Fed no longer has the flexibility to intervene with policy support the way they once did.
As a result, now is a reasonable time to step aside by dialing back risk exposures in the stock segment of asset allocation strategies.
What to sell? This raises the reasonable next question of what positions make the most sense to exit at this stage. Leading the list would be the technology sector and the broader “tech heavy” NASDAQ. Unlike the S&P 500, the bounce in the NASDAQ brought it back to the top end of its downward sloping trading channel. But no sooner did it hit trendline resistance that just so happened to coincide with the downward sloping 50-day moving average, and the NASDAQ is back on the retreat to the downside.
StockCharts.com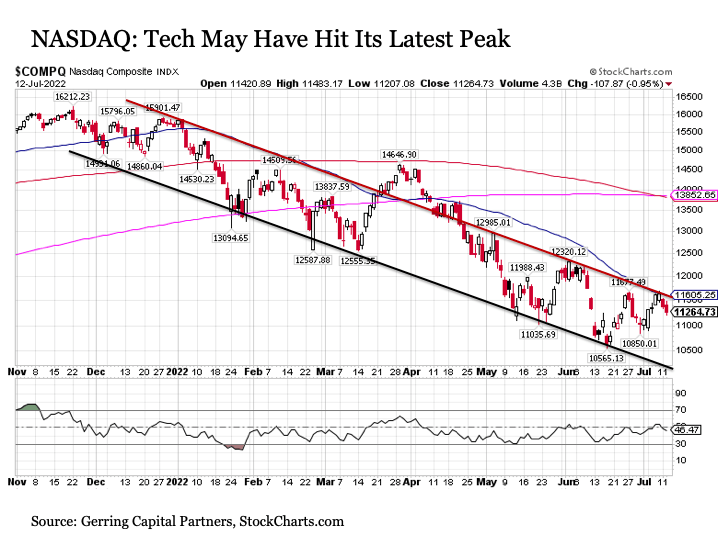
More broadly, scaling back on allocations concentrated in growth or cyclical sectors of the market would be prudent at this point if you haven’t exited these segments already, as these are the stock categories that are likely to continue to struggle the most given the tightening monetary policy backdrop and fading economic outlook.
What to hold? One should not want to completely eliminate their stock allocation with their broad portfolio strategy, so it is also reasonable to consider what makes sense to continue holding at this juncture. I remain inclined to continue to emphasize the following: value, quality, low volatility, defensive sectors, large caps, and specialized themes that are positioned to perform well despite the broader market environment.
Bottom line. The recent stock market bounce since mid- to late June appears to have largely run its course. And given the fundamental headwinds that loom ahead in the coming weeks coupled with the fact that late July and August is a time of the year where market liquidity becomes light and the risk for dislocations become elevated, now is a reasonable time to marginally scale back on stock exposures in a broader asset allocation strategy.
Be the first to comment