

chaofann
Long-term outperformance of individual stocks in the stock market is my main goal. That’s what I look for in this piece.
I recently wrote the article “Stocks To Buy And Hold Forever.”
It shared the same goal: finding stocks that perform better than others due to consistent growth, buybacks, and increasing dividends. I also look at the current valuation as even the best stocks get overvalued.
The idea is simple: find stocks with a strong story, perpetual growth of revenue and earnings, and consistent shareholder returns. These types of stocks tend to outperform the market in the long run.
Buy and hold shouldn’t be taken literally.
The business should adapt as new trends arrive. Otherwise, selling and looking for a better investment may be best.
An investor should keep an eye on the valuation of a company. Even the best company can become an expensive stock with little upside potential.
Trimming positions over time is also possible as you need cash as income.
I selected these 10 stocks previously:
- Alphabet (GOOG, GOOGL)
- Apple (AAPL)
- ASML (ASML)
- Best Buy Co (BBY)
- BlackRock (BLK)
- Costco Wholesale Corporation (COST)
- The Home Depot (HD)
- Mastercard Incorporated (MA)
- Microsoft Corporation (MSFT)
- Pool Corporation (POOL)
Selection Method
I kept the same method as last time.
These are my criteria for selecting what I consider buy and hold forever stocks.
- The first one is subjective. I look for a strong story behind the company. A sound strategy and clear goals make the investment case more attractive.
- Strong revenue growth per share and good profitability are essential.
- A high return on equity proves the management’s efficiency.
- Buybacks and dividends are signs of shareholder-friendly management. All listed companies regularly returned cash to the market through buybacks, dividends, and often both.
- Strong past performance on the stock market measured in total return helps to underwrite the previous points. It’s no indication of the future but underscores the market’s appreciation of the company, particularly if the valuation didn’t change too much.
Selection With Common Characteristics
I selected three stocks that I feel are underappreciated by the market:
Before I go deeper into these individual stocks, I want to highlight the common ground.
High Return On Equity
All three companies operate with a high ROE. Return on equity measures how efficiently management is at converting shareholders’ equity into net profits.
It’s a tool to measure a management team’s capital allocation decisions and its ability to increase shareholder value. It doesn’t tell anything about the current valuation of the company.
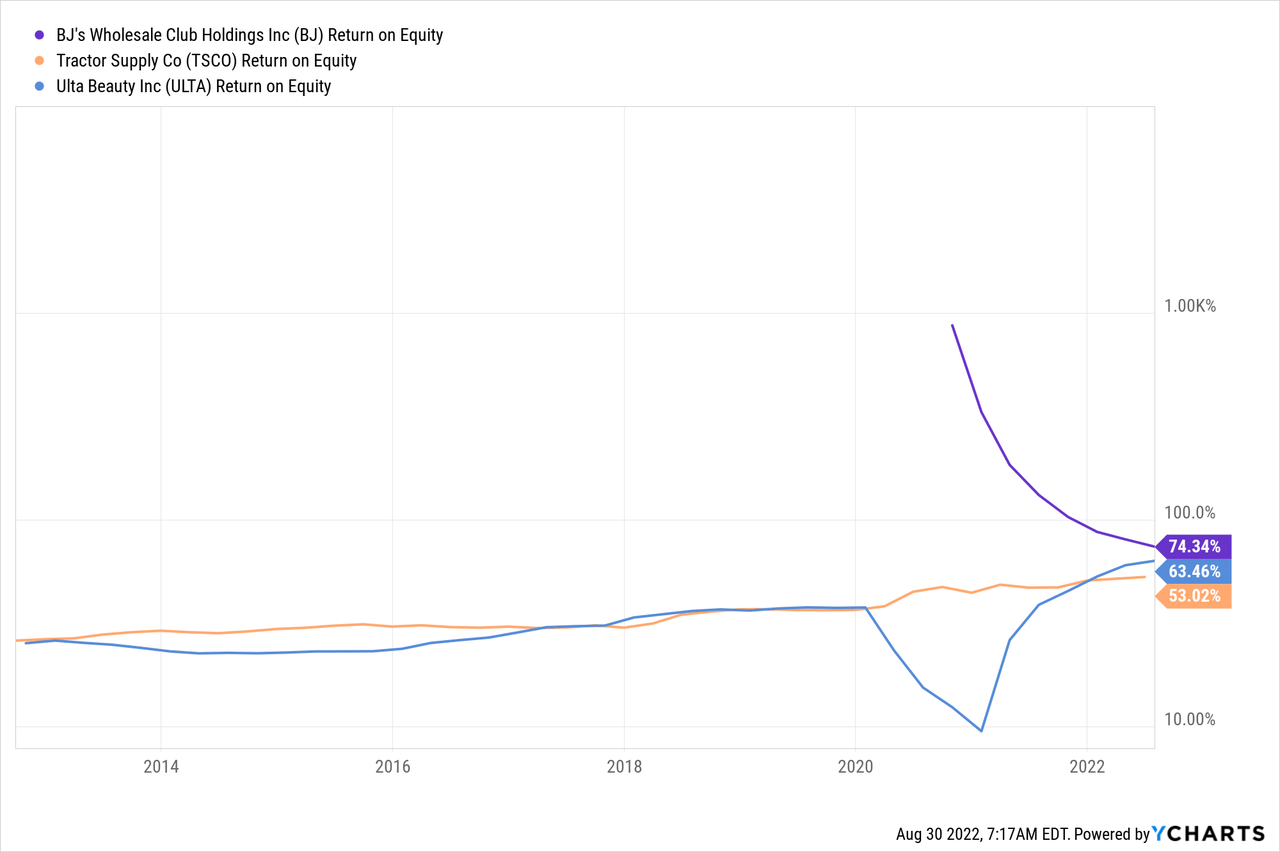
All three companies showed excellent ROE ratios in the past.
Growing Revenues
I talked about finding a strong story behind the company. I want to confirm this story with its past and expected revenue growth.
Investing isn’t about the past, but the past gives confidence in the company and management. History doesn’t repeat itself but often rhymes.
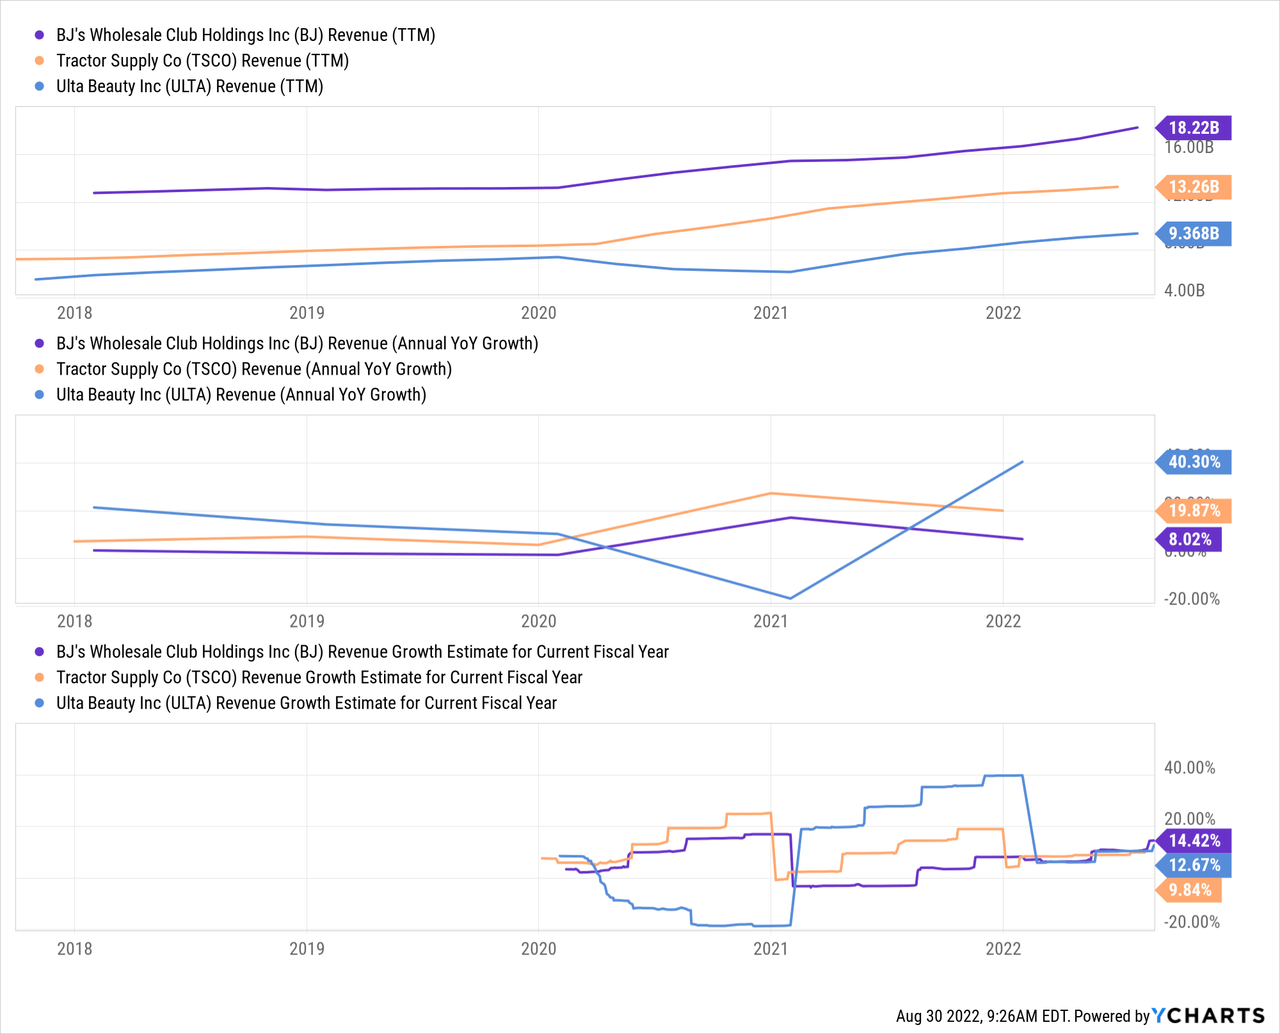
The past figures are good for all three companies. Forward revenue estimates from analysts also look positive for this year. I believe these three companies could sustain a strong growth rate for a long time due to their strategies.
Strong Past Performance
For the first article, I looked specifically at companies with a longer public history that outperformed the S&P 500 (SPY).
These three stocks outperformed the S&P 500 since they operate as public companies.
BJ’s history is short and not a sign of long-term outperformance yet. The others show excellent long-term appreciation.
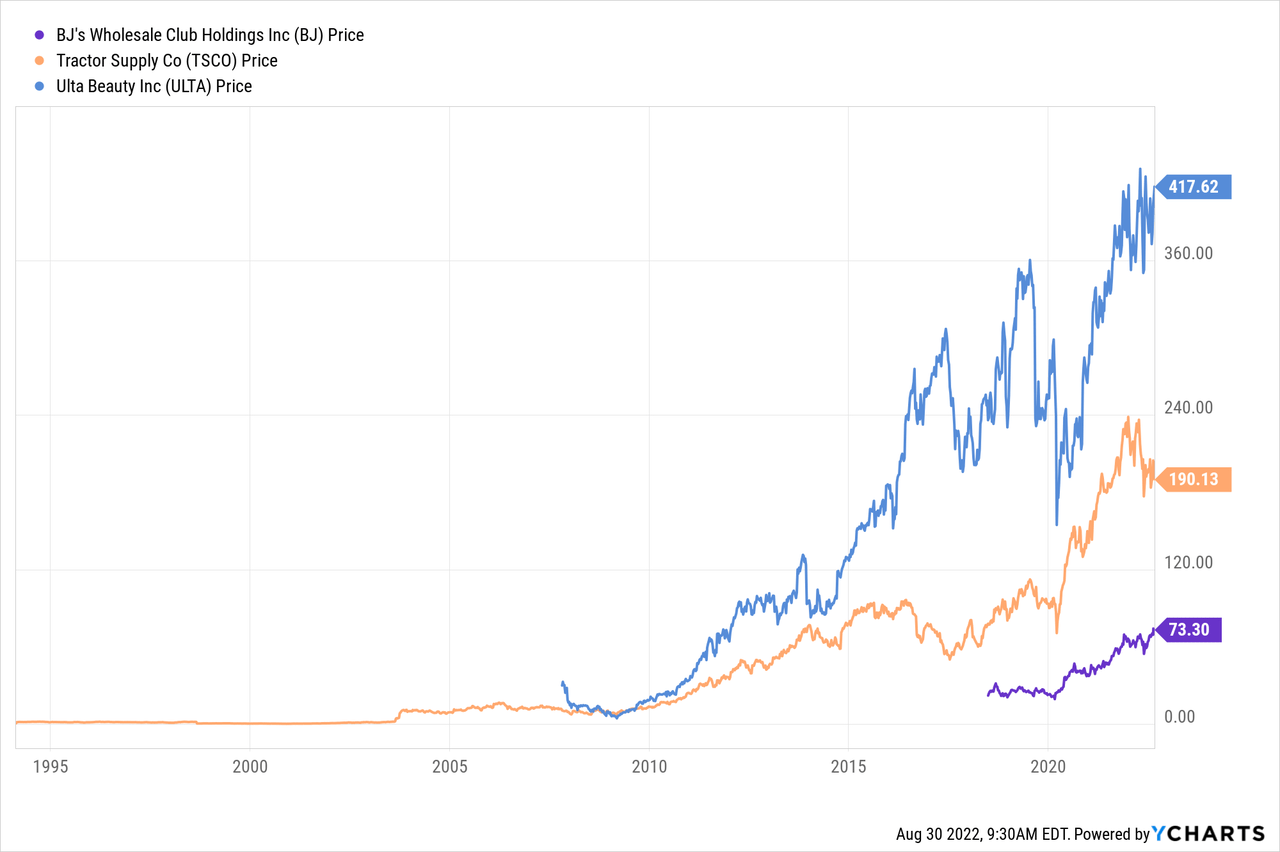
These increased stock prices shouldn’t be confused with expensive stocks. The current share price isn’t relevant to a company’s intrinsic value. A company is valued with ratios or other valuation models.
Positive Free Cash Flows And Shareholder Returns
Free cash flow is vital as this is what a company could use for shareholder returns. Potential buybacks or dividends are only possible if the company produces enough cash.
These three companies generate consistent positive free cash flows.
They all use buybacks for shareholder returns. Only TSCO pays a growing dividend. Regular shareholder returns are a sign of shareholder-friendly management.
BJ’s Wholesale Club Holdings
BJ’s is a warehouse club with low prices similar to Costco or Sam’s Club. It offers value to its members who pay an annual membership fee. The membership fee is an essential source of income as it almost wholly turns into earnings and free cash flow. The model behind these clubs is simple and appealing.
Growth Strategy
BJ grows the number of clubs it operates, its revenues and buying power, gets better deals for its members, and attracts more members per club. It creates a flywheel effect.
It expects to grow its number of locations by 4-5% annually going forward. Together with same-store sales and membership growth per club, it should translate to annual revenue growth of ~7-8%.
FCF And Shareholder Returns
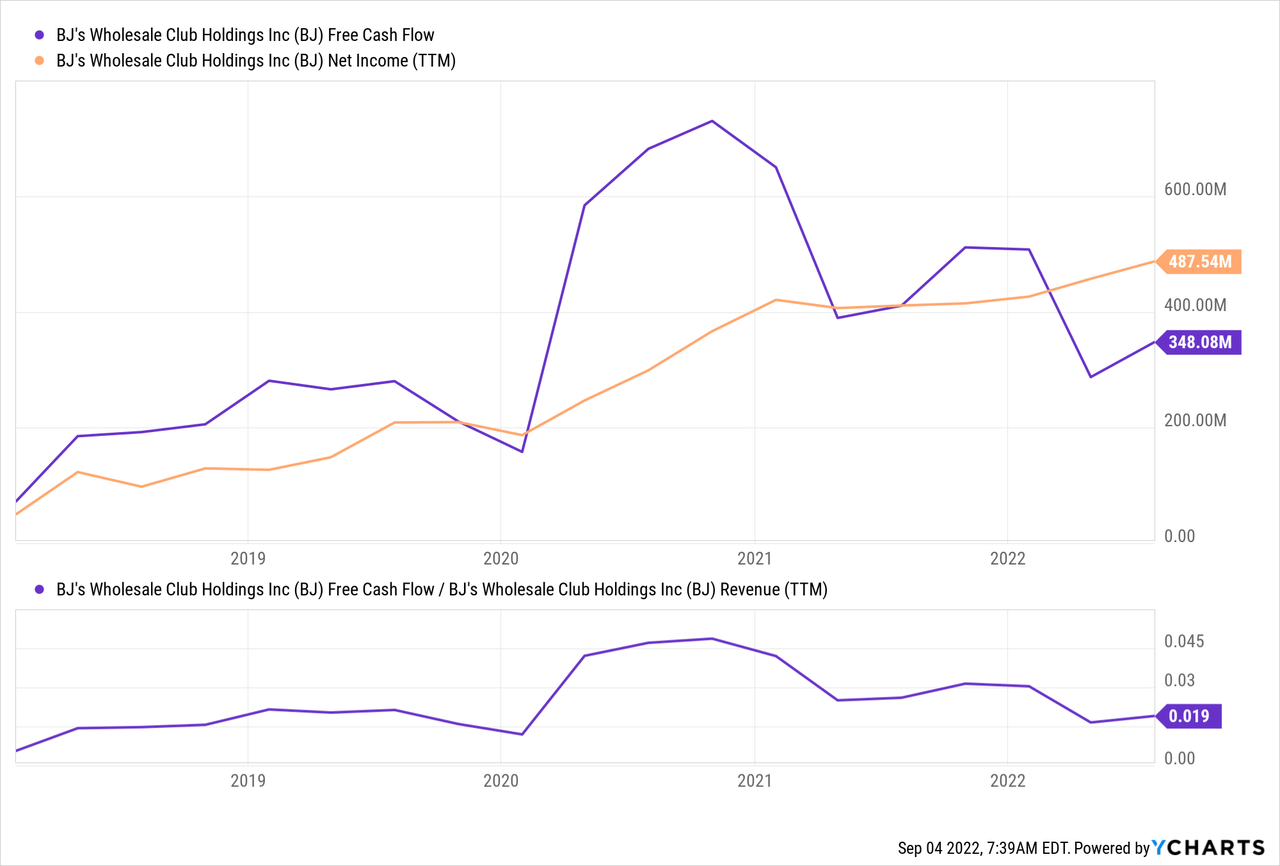
The free cash flow is lumpy as it often stocks up inventory for later quarters. It always gets in line with earnings. It mainly used its free cash flow (“FCF”) to reduce debt over the past couple of years.
BJ’s doesn’t pay a dividend and doesn’t plan a dividend soon. It’s public since 2018 and only used share repurchases to return cash to shareholders.
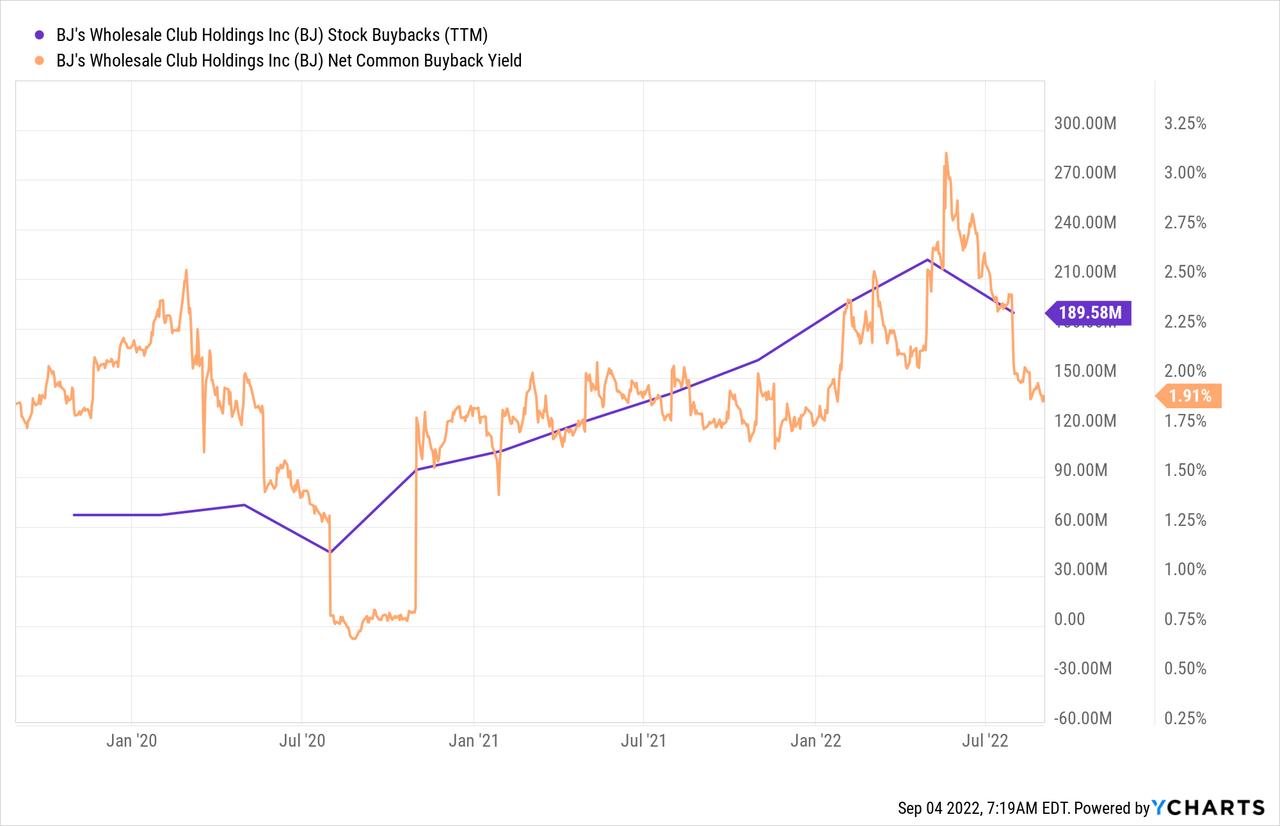
It has $413M left in its current buyback program. The buyback yield will probably remain relatively low as the company invests in growth.
Valuation
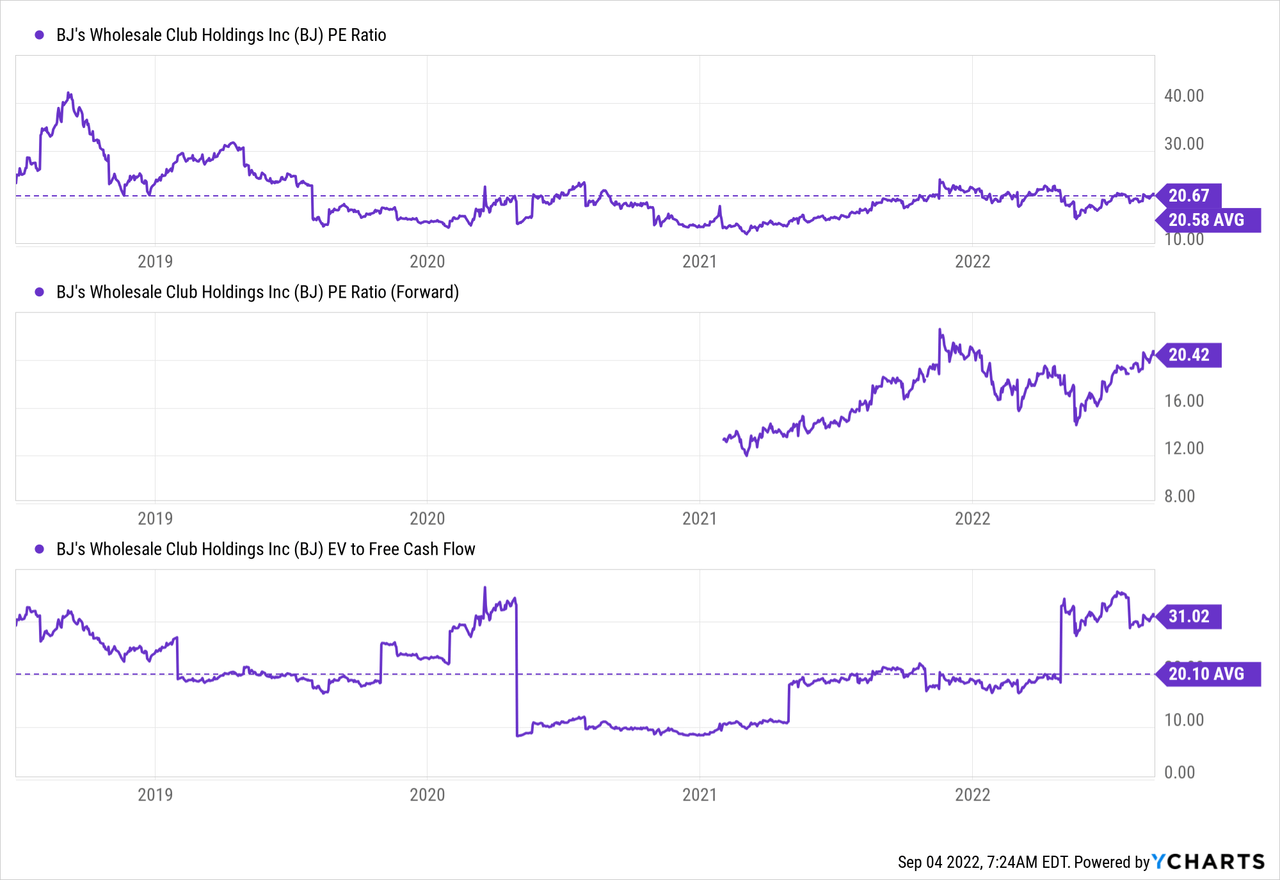
BJ’s valuation metrics are in line with its historic averages. EV to FCF is deformed due to its cash cycle and should normalize over the next few quarters. Its flawless performance makes the company a buy at the current valuation.
Please read my latest article about BJ’s for more extensive research.
Tractor Supply Company
The company is a rural lifestyle retailer in the U.S. It sells various products to recreational farmers, ranchers, and others. It operates in a niche that sees secular growth. The trend of people that want to live a rural lifestyle plays in its favor. It’s the U.S. market leader in its niche. The rural lifestyle was demonstrated to be recession-proof in the past.
Growth Strategy
Tractor Supply Co keeps growing the number of stores at a steady pace. It plans to open 70-80 Tractor Supply stores and 10 Petsense stores in 2022. It expects to keep up this 4% store growth pace until 2026. Acquisitions could add new growth avenues
FCF And Shareholder Returns
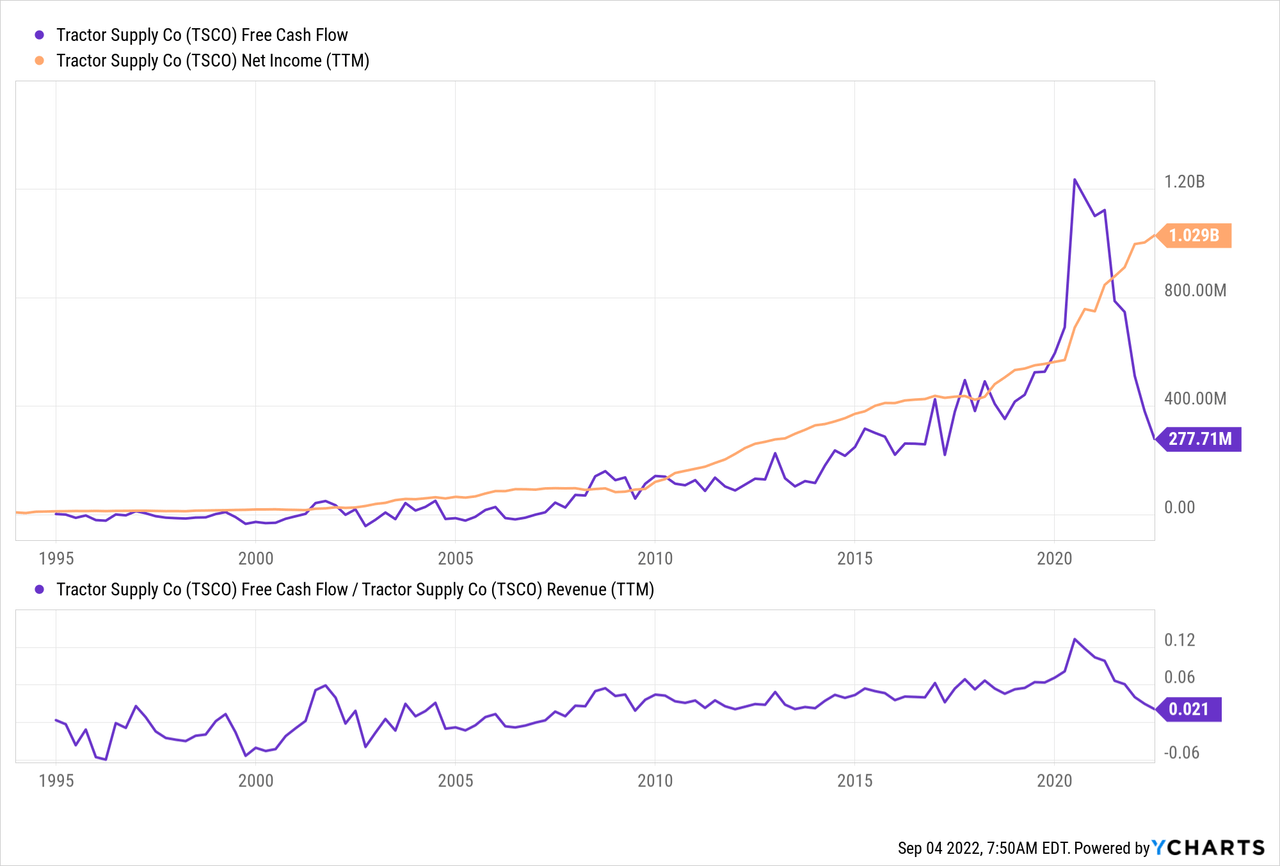
Free cash flow tends to fluctuate as inventory builds and decreases. I expect FCF to increase again over the next couple of quarters. TSCO uses its FCF for buybacks and a growing dividend.
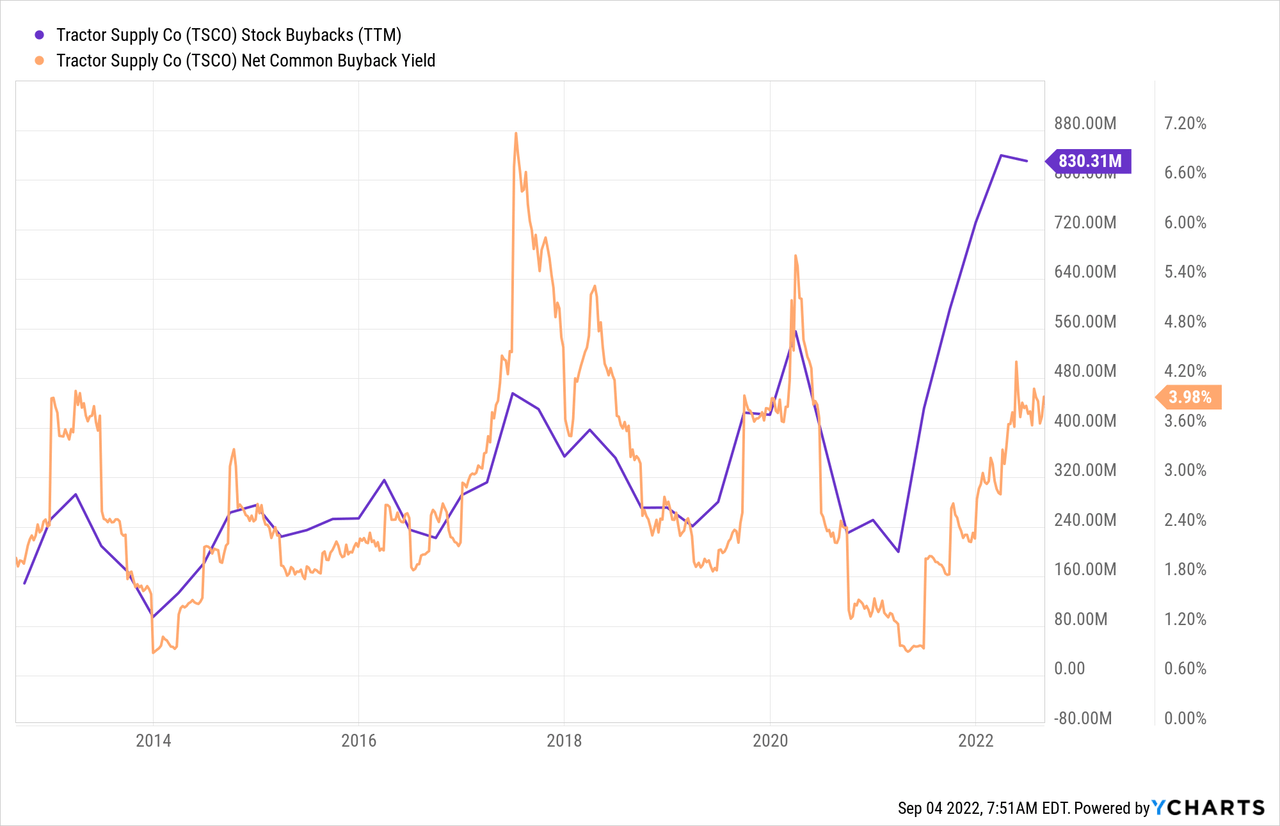
Buybacks reached an all-time high as TSCO is committed to returning cash to shareholders. It has $1.9B left under the current share repurchase program.
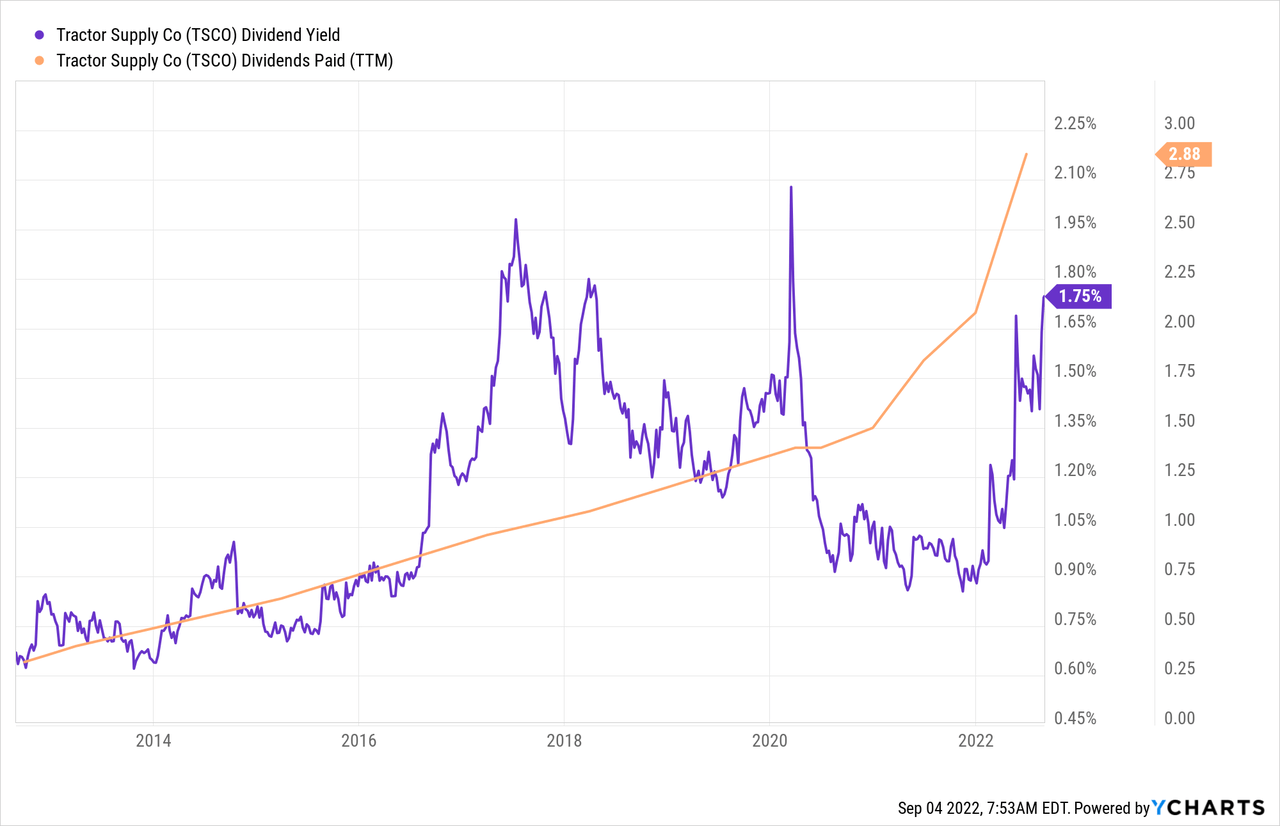
The quarterly dividend increased by a whopping 77% at the start of the year. Further dividend increases are likely as its payout ratio is 38%, and earnings should grow by double digits. The forward dividend yield is now 1.9%.
Valuation
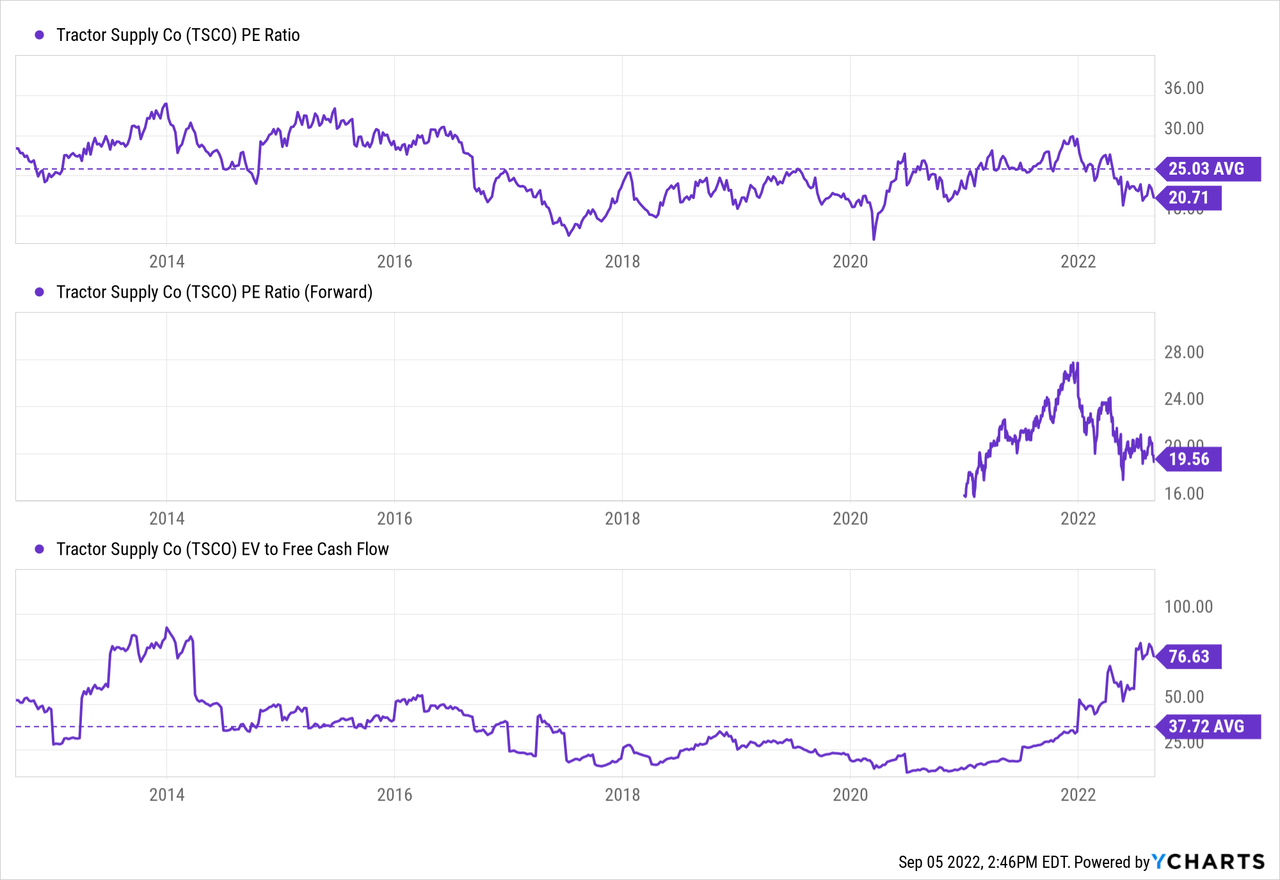
TSCO looks reasonably valued, with P/E well below its historical average. EV to FCF is far above the average due to the inventory increase.
Ulta Beauty
Ulta is another niche U.S. retailer. It offers a wide range of beauty products. It operates 1,325 stores with expansion possibilities for 1,500-1,700 stores.
The beauty sector keeps up firmly compared to other retailers due to the relatively low cost. It’s an affordable splurge for many people.
Growth Strategy
Ulta targets 5%-7% CAGR net sales growth by 2024. The latest earnings suggest this outlook was too conservative as the company grows ~10% in 2022. In the past, store openings happened at a decent pace, raising the number of locations by 3.5%-4% yearly. It expects 50 additional stores in 2022, or a 3.8% increase. It’s also opening locations in Target (TGT) stores.
FCF And Shareholder Returns
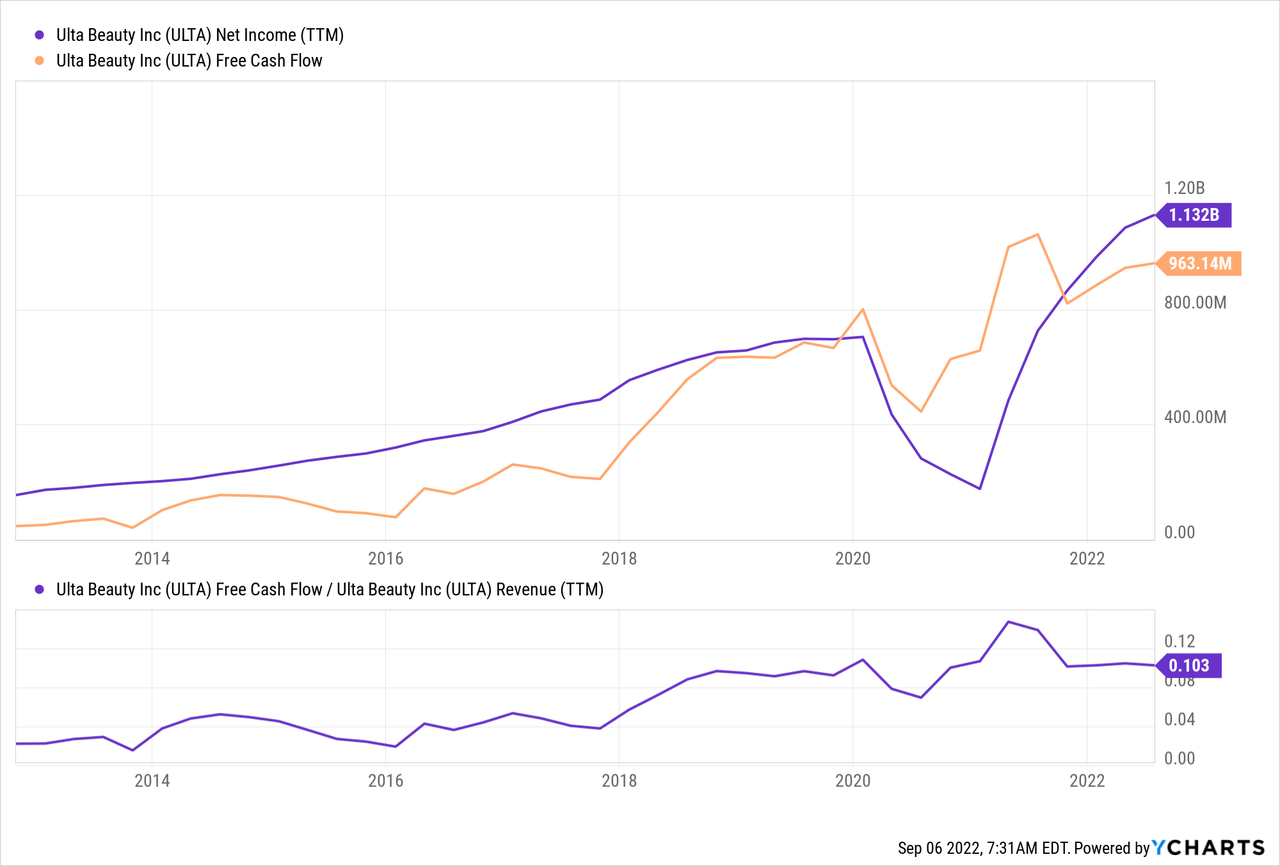
Ulta increased its FCF conversion as it grew. It achieves excellent figures while still growing revenues. Net income and free cash flow have been approximately synchronized in the past couple of years.
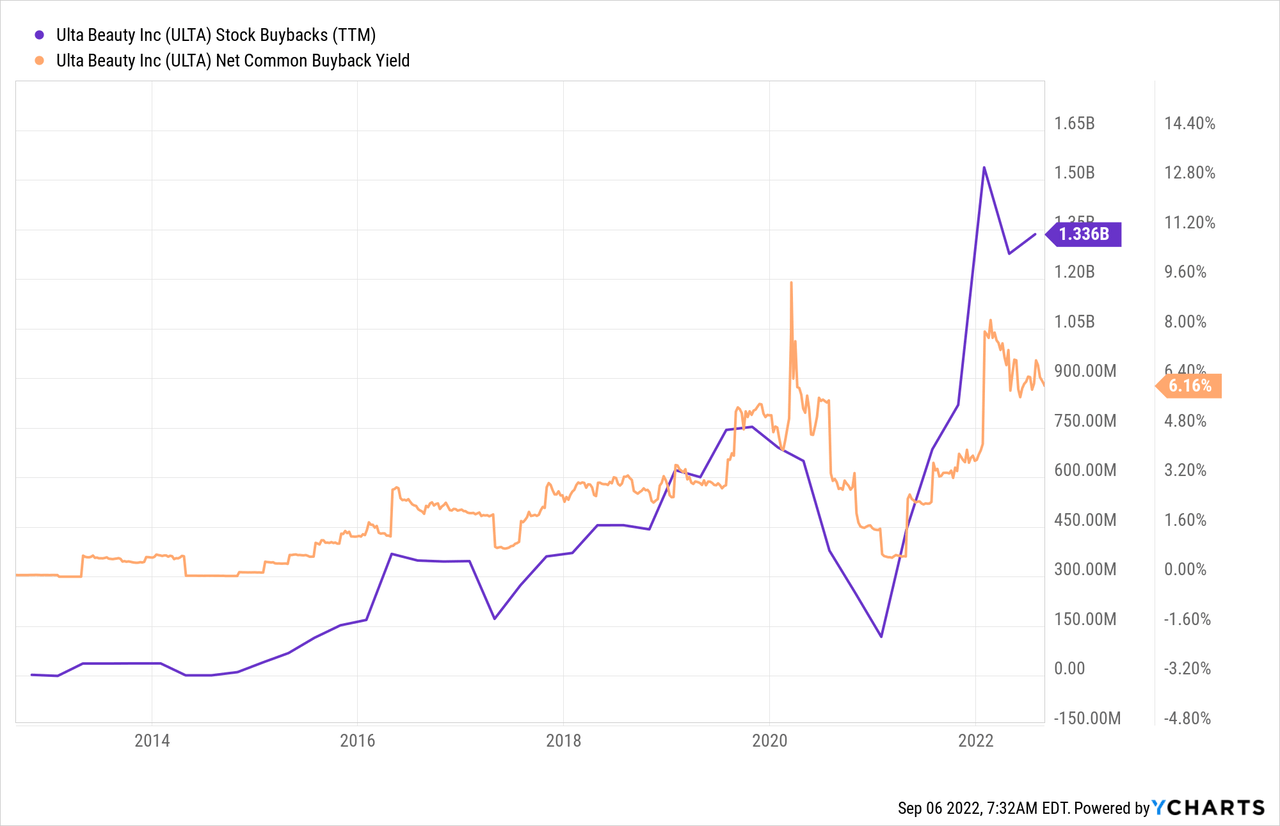
Ulta aggressively buys back shares with its free cash flow. The current program has $1.6B firepower left. It doesn’t pay a dividend.
Valuation
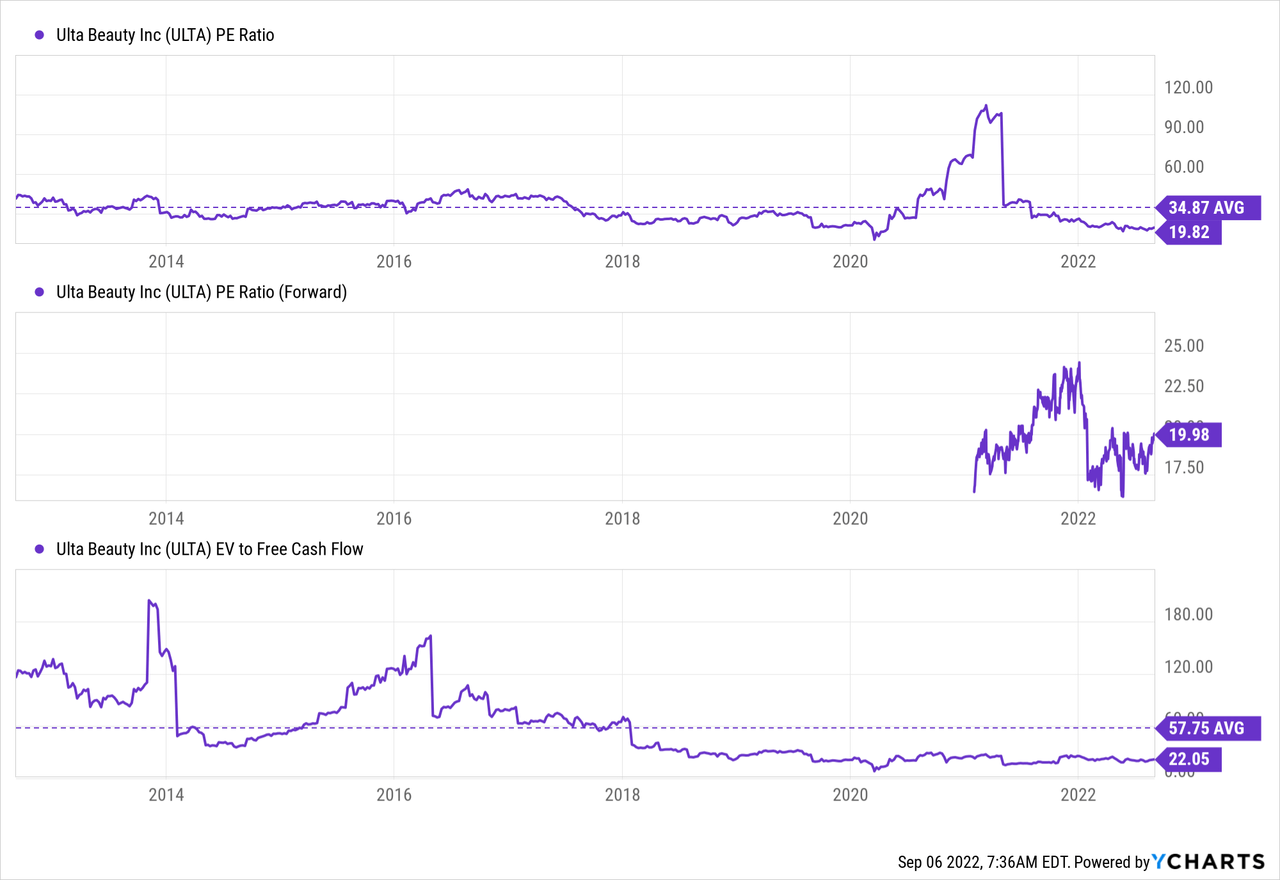
Ulta looks very reasonably valued. It’s well below its historical average. Some of the discount makes sense as the forward growth rate will be slower than in the past. A P/E of ~20 is reasonable for a stock with proven management and double-digit EPS growth.
Conclusion
Long-term outperformance is my main investment goal. I believe these stocks could become such winners as they’ve proven track records and are reasonably valued.
I’ve focused on stocks with developing locations in the U.S. Further diversification in sectors is desirable to create a robust long-term portfolio.
Tractor Supply Company was a suggestion in the comments of the previous article. I look forward to reading your ideas below!
Be the first to comment