

Darren415
This article was first released to Systematic Income subscribers and free trials on July 11.
The income market has enjoyed a well-deserved bounce after a horror-show that was June. We can see this in the CEF space which has rallied around 5% off its recent low.
Systematic Income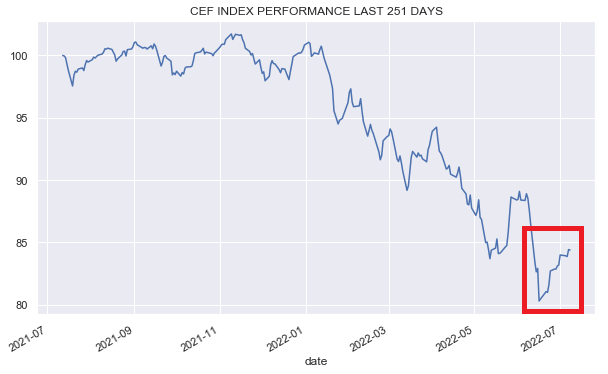
We can also see it in the BDC sector which has bounced close to 10% since its low. Many other income sectors look pretty similar.
Systematic Income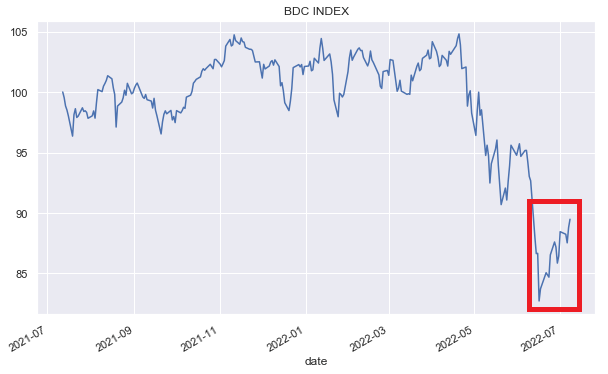
However, as always, there is a wide disparity in how individual securities have behaved over the last couple of weeks. A big driver of short-term moves are technicals such as retail flows and liquidity of the given stock and which don’t always align with its fundamentals. This can give investors an opportunity to leg into attractively valued securities that have lagged the market recovery.
Naturally, this doesn’t mean we won’t see lower prices. However, for investors who have been sitting on the sidelines, these securities offer attractive value. The fact that they have lagged the broader market also suggests they boast an additional margin of safety in case we see another downward lurch.
One metric we like to look at to gauge which securities have lagged the recent rally is their price level relative to their 1Y low. For instance, a security that is trading at $15.50 and which bottomed at $15 in the past year (most likely just a few weeks ago) is 3.3% off its 1Y low. Clearly, the price of any given security may fall because of the ex-dividend date; however, we are using a long-enough horizon where this impact is not particularly large.
This is how the BDC sector looks on this metric.
Systematic Income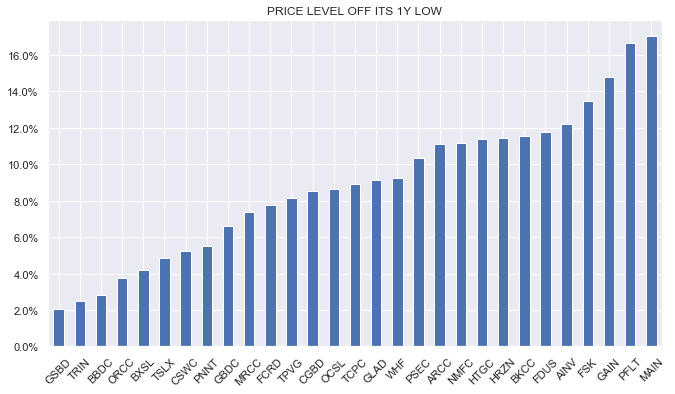
BDCs that remain attractive in our view are the following.
Trinity Capital (TRIN) is trading at a 15.7% annualized total dividend yield and a 96% valuation off its Q1 NAV.
Admittedly, the company does not have a long track record as a public company but so far it has delivered for investors – strongly outperforming the BDC sector.
Systematic Income BDC Tool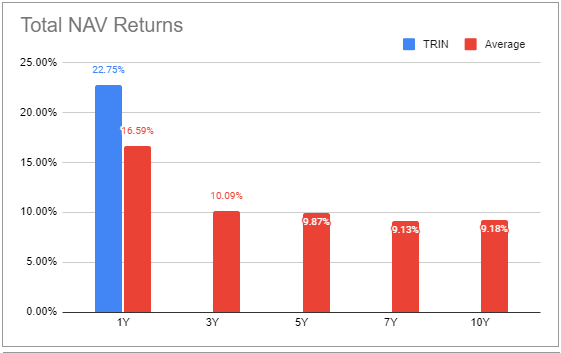
Because of this superior performance, TRIN has often traded at a much higher valuation relative to the sector average. The current 3% valuation premium relative to the sector is attractive in our view.
Systematic Income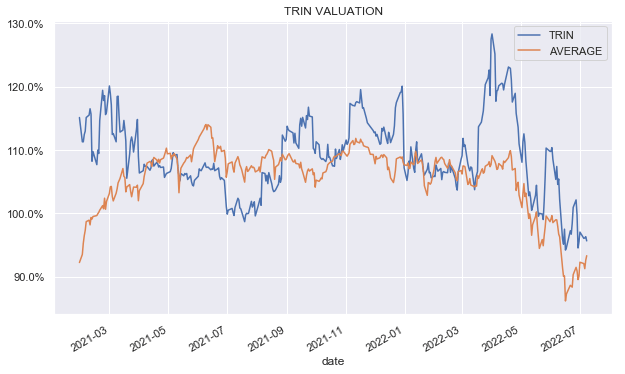
The Blackstone Secured Lending Fund (BXSL) has also lagged the current rally. However, as we highlighted recently, this was because of the final chunky lock-up expiration which has pushed the stock lower by 9% before its partial recovery.
The company features a double-digit historic total NAV return, a higher-quality first-lien focus and a sub-sector valuation level. It is trading at a 88% valuation (vs. 93% average) on its Q1 NAV and a 12.7% annualized total dividend yield.
Systematic Income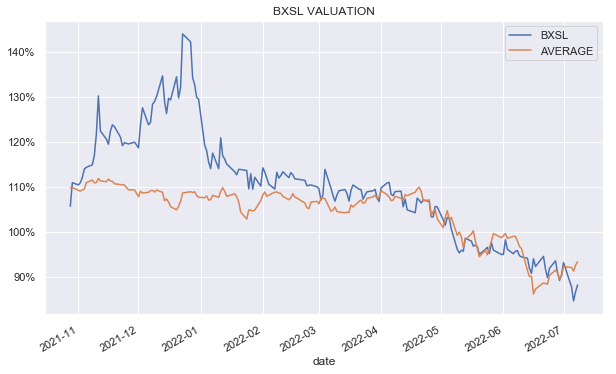
Taking a look at CEFs, the Preferreds CEF sector looks like the following.
Systematic Income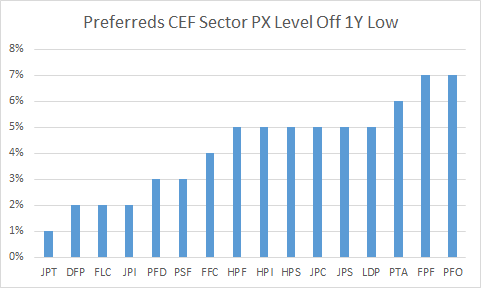
Here, we like the Nuveen Preferred and Income Term Fund (JPI), trading at a 5.3% discount (vs. a 2% sector average) and an 8.1% current yield (vs. an 8.2% sector average).
What we like about the fund is its term structure with a termination date in Aug-2024. We don’t actually expect the fund to terminate. For instance, its sister fund JPT with a 2022 termination date did not actually terminate. However, what it did was it offered investors an exit at the NAV by holding a tender offer which achieved a kind of best of both worlds – it gave investors an exit at the NAV but it kept the fund alive. Nuveen has been a good citizen in keeping true to the premise of term CEFs so we expect it to follow through on JPI as well. The amortization of the discount to zero to the termination date will add a tailwind of over 2% per annum – something we track on the service and call the pull-to-NAV yield. It’s at a historically high level for the fund.
Systematic Income CEF Tool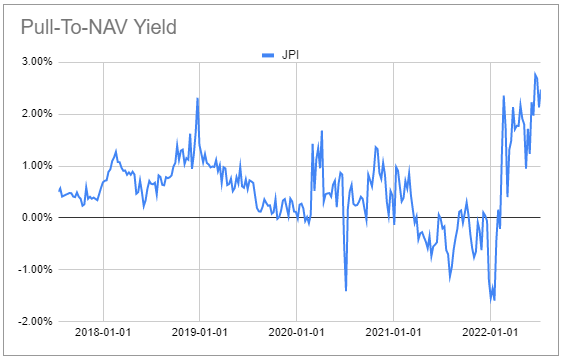
In the Multi-Sector space, we like the Western Asset Diversified Income Fund (WDI), trading at an 11.6% discount (vs. 1.9% sector average) and a 10.5% current yield (vs 10.4% sector average).
Systematic Income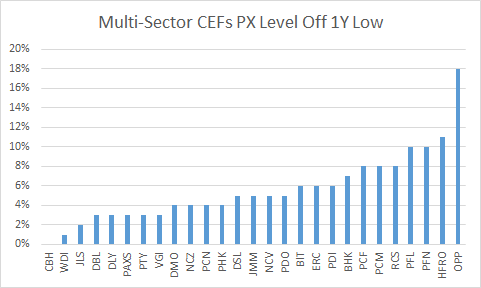
WDI holds primarily high-yield corporate bonds along with a few other credit sectors.
WDI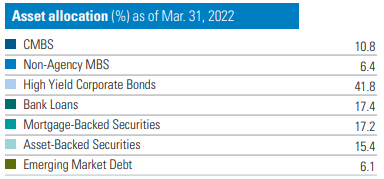
What we like about the fund is its decent floating-rate profile which makes up roughly a third of the fund (all of the loan allocation plus most of the MBS and ABS allocations). This is a big part of the reason why it has hiked its distribution recently – something we expect it to keep doing over the medium term as short-term rates keep rising.
The fund also remains very cheap relative to the sector, trading at a valuation that is close to 10% wider of the sector average. Its performance has not been great but also not terrible – its 1Y total NAV return is -17% versus a -15% for the PIMCO multi-sector fixed-income funds.
Systematic Income CEF Tool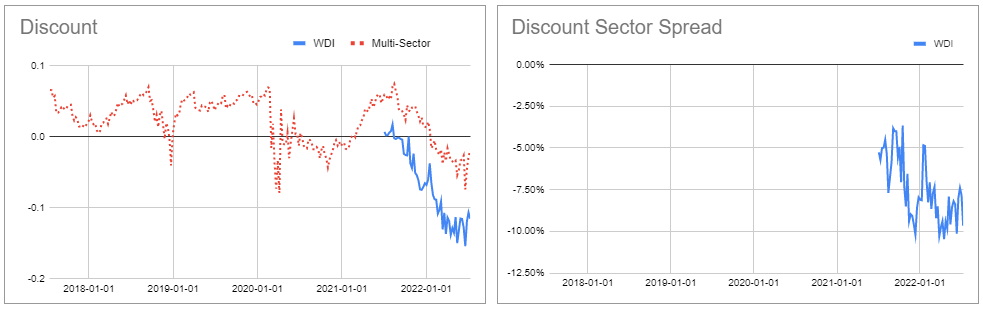
Takeaways
Investors who have been patiently waiting to deploy capital in the recent drawdown may want to have a look at securities that have lagged the recent rally. This is particularly the case for those securities that investors may want to own anyway for other reasons such as historic performance, allocation profile or valuation. As they have not bounced as hard as the rest of their sub-sectors, these securities may hold an additional margin of safety if the market sees another downward lurch.
Be the first to comment