

24K-Production/iStock via Getty Images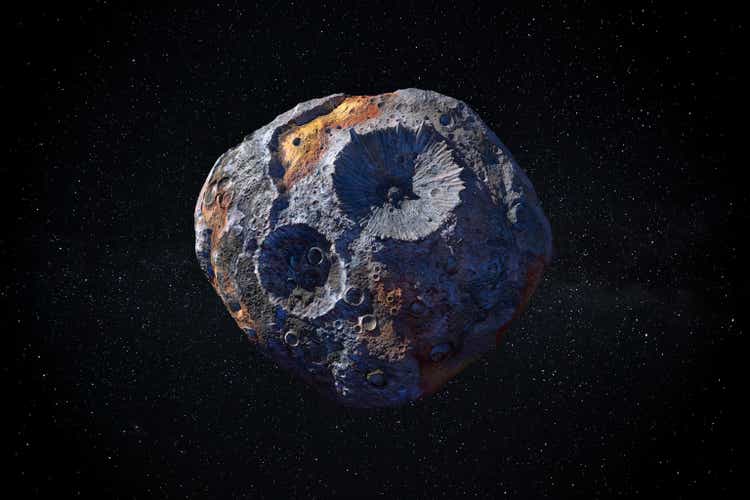
Gold’s inherent property is that it is scarce and difficult to mine. Most of the easily accessible gold has been mined, and the difficulty of producing gold has increased. This is similar to Bitcoin’s proof of work algorithm, which adjusts the mining difficulty depending on the number of participants in the network.
Introduction
Owning some gold as part of a diversified portfolio is an excellent way to hedge against market and political crises. Gold does not correlate well with stocks and bonds, so it helps smooth out the market’s bumps.
Owning gold miners or royalty companies is like buying gold with leverage. Miners and royalty companies are a good investment if an investor has a positive long-term outlook on gold’s price.
That’s not all. Gold is inherently scarce, and the amount of new gold mined each year is in the neighborhood of 1.5% per year. This property of gold acts as a hedge against inflation over the long term as people are drawn to scarce items.
In 2020, gold reached an all-time high of $2036/oz due to the pandemic-related panic, a sharp drop in the US dollar, crashing yields, and monetary easing across the whole bandwidth.
Gold Price four years (Tradingview)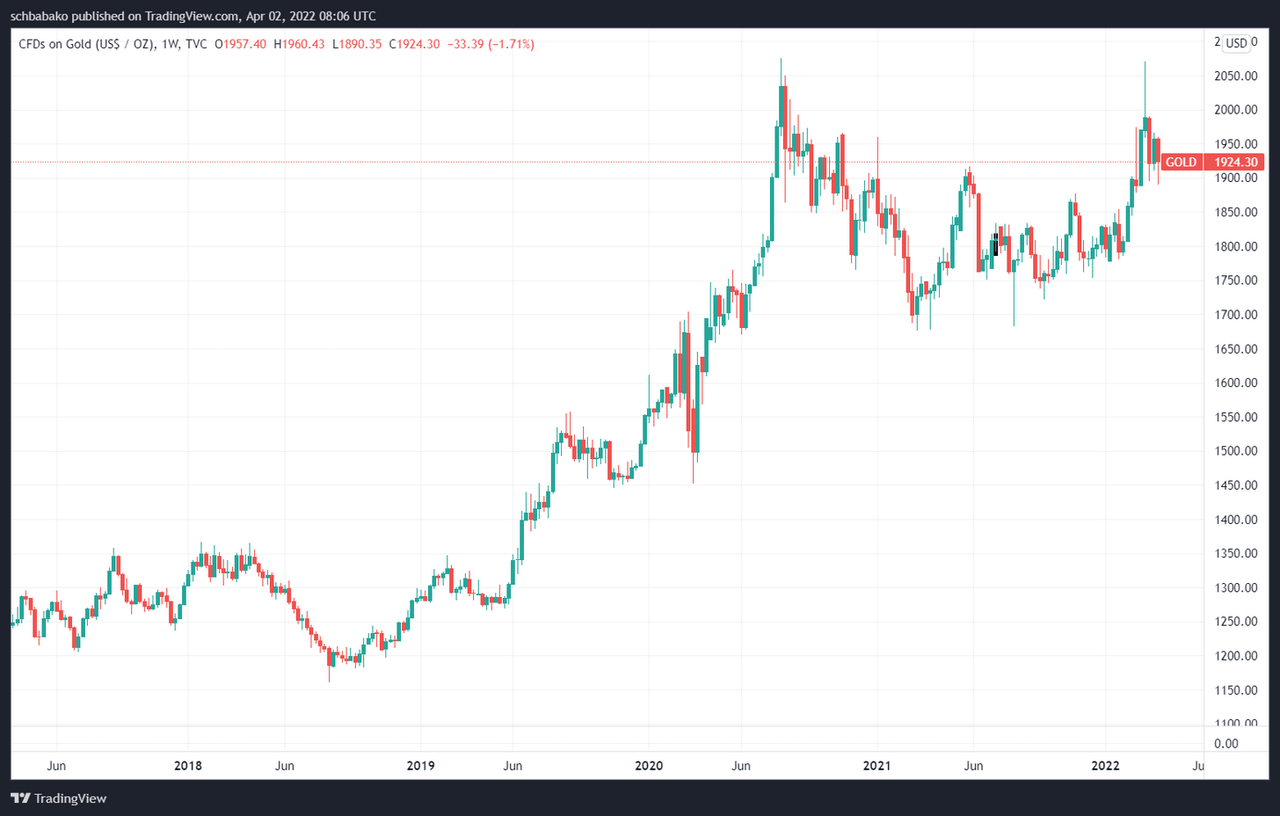
Three Categories of Gold
Gold undeniably has had a crucial role throughout human history. It enabled the first local and then global marketplaces and allowed humans to trade goods for a unit of exchange. There are generally three ways to look at gold.
First, gold has been used as a currency for trade. From the monetary viewpoint, gold has an inflation rate of ~1.5%, with 244,000 metric tons of gold discovered, of which 187,000 tons have been mined and 57,000 tons underground reserves. There is probably more gold underground that hasn’t been discovered yet or is uneconomical to mine at current gold prices.
Second, as a store of value or expression of wealth. Due to the inherent scarcity of gold, many people are drawn to it, and it represents their wealth with the amount of gold they possess.
Third, as an industrial commodity. Because gold does not react with other substances, it has excellent biocompatibility. Think about teeth filling, where dentists have been using gold to fill holes in teeth for thousands of years. To reduce reaction with skin or other body parts, gold is used to protect the body. Gold is also an excellent conductor, and engineers use it in many electric appliances.
So, humans need gold; that’s why we have a huge mining industry responsible for delivering us new gold to cover our needs. When it comes to mining, you need to know two categories of underground gold.
Gold reserves
This is gold that is economical to mine at current gold prices. These are the gold mines you generally know, like in the picture below.
Gold Mine (Wikipedia)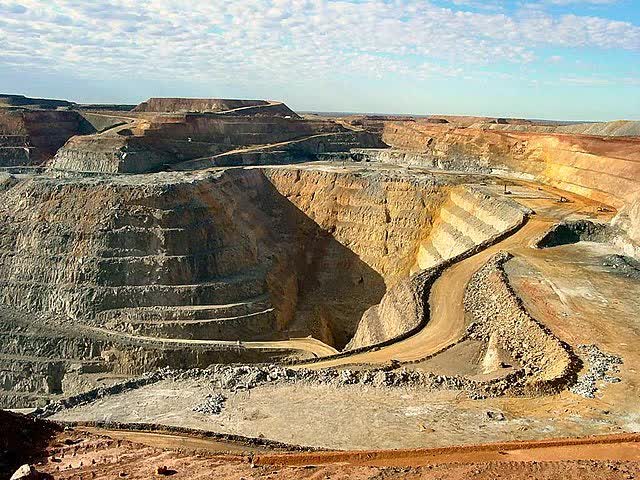
Gold resources
This is gold that’s currently uneconomical to mine or requires further investigation and preparation to mine economically. There is gold deep below the earth or on the ocean floor, but getting to that gold requires us to develop new technologies to make it economical. There are also asteroids containing a lot of gold, but getting that gold is very expensive and requires a much (much) higher gold price to justify such an endeavor.
Asteroid containing Gold (website)
Peak Gold
Understanding peak gold is essential. Many crypto enthusiasts’ main counterargument against gold’s scarcity is its abundance across the earth. While it’s true that the gold exists, getting to that gold gets incrementally harder over time.
Peak gold is the date when the world reaches the maximum rate of gold extraction. It’s an important indicator to measure the balance between supply and demand.
Gold Inflation Rate (World Gold Council)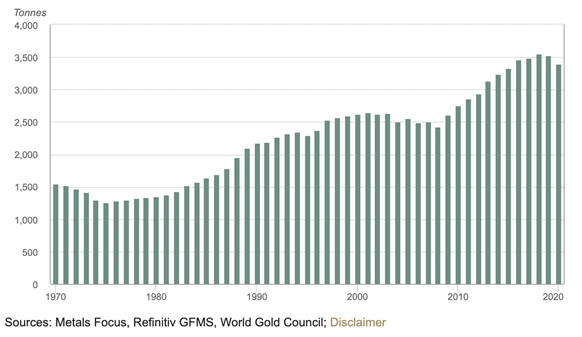
Total gold production has been decreasing for two years now, with the trend continuing to be negative. During Covid, lockdowns created additional pressure, with governments closing mines in Mexico, Peru, and South Africa. In Papua New Guinea, the government halted mine production by suspending the mining license of the country’s second-largest gold operation.
We also need to consider recycled gold in the supply and demand equation. In 2020, 1297.4 tonnes of gold were recycled from jewelry or electronics.
Gold supply, mine production, recycling (World Gold Council)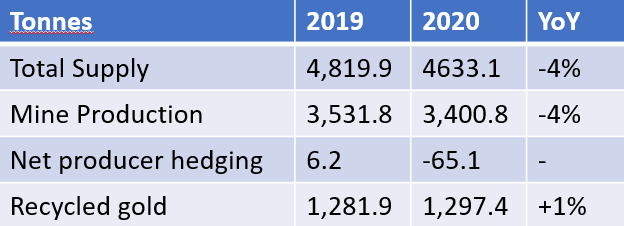
That year, the total annual gold supply (including recycled gold) was 4,633t, 4% lower than the previous year.
Without the gold from recycling activities, gold production would not be able to meet the demand from the various sectors.
Current State of the Mines
In the last decade, there were no new significant gold discoveries. Part of the reason is that investments in risky grassroots explorations shifted away to known deposits around operating mines.
Gold Discoveries in the last 30 years (SP Global Market Intelligence)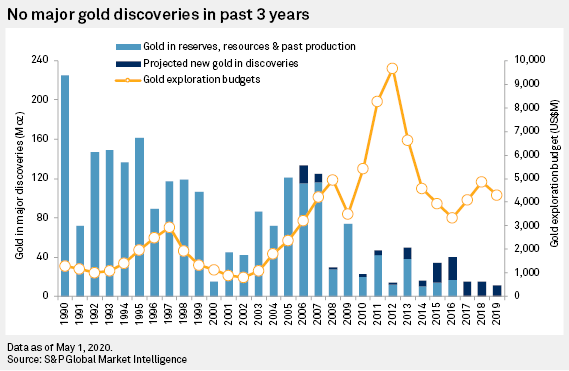
Many mining companies cut their budgets for new explorations (grassroots explorations) in half since 2010. Between 1990 and 2019, 2,194.5 million ounces of gold were discovered in 278 deposits. Of which only 25 discoveries were made in the last decade.
The lack of new high-quality mines means that the project pipelines are increasingly short of large, high-quality assets to replace aging major mines.
The lack of new discoveries is part of gold mining companies’ dilemma. Gold’s scarcity enables them to make profits with high-quality mines, but with fewer high-quality mines, the costs of production increase in tandem with the gold price. They need to invest considerably for discoveries in the future, which decreases their cash flow.
Production of many established mines is expected to start decreasing in 2022. This adds to the ongoing imbalance between supply and demand in the gold market.
Why invest in Gold miners
Gold miners’ profit and loss depend on the price of gold, their production cost, and debt management.
To understand why gold miners act as gold leverage, we’ll go through an example. Suppose that the gold price is $1900/oz; Barrick Gold’s (GOLD) cost to mine one ounce of gold is $1065/oz, which means that Barrick makes a profit of $935/oz. If the gold price increases by 10%, Barrick Gold’s profit increases to $1125/oz, an increase of 20%.
For smaller miners with a higher gold production cost, the change in profit increases even more. For example, Golden Star Resources’ (NYSE:GSS) cost to mine gold is $1300/oz. An increase of 10% in gold price increases their profit per ounce from $600/oz to $790/oz, a 31% increase in profit per ounce.
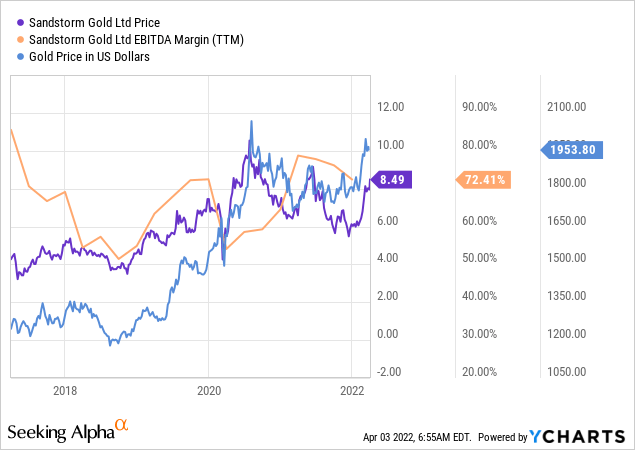
Chart of Gold and Sandstorm’s Share Price (Tradingview)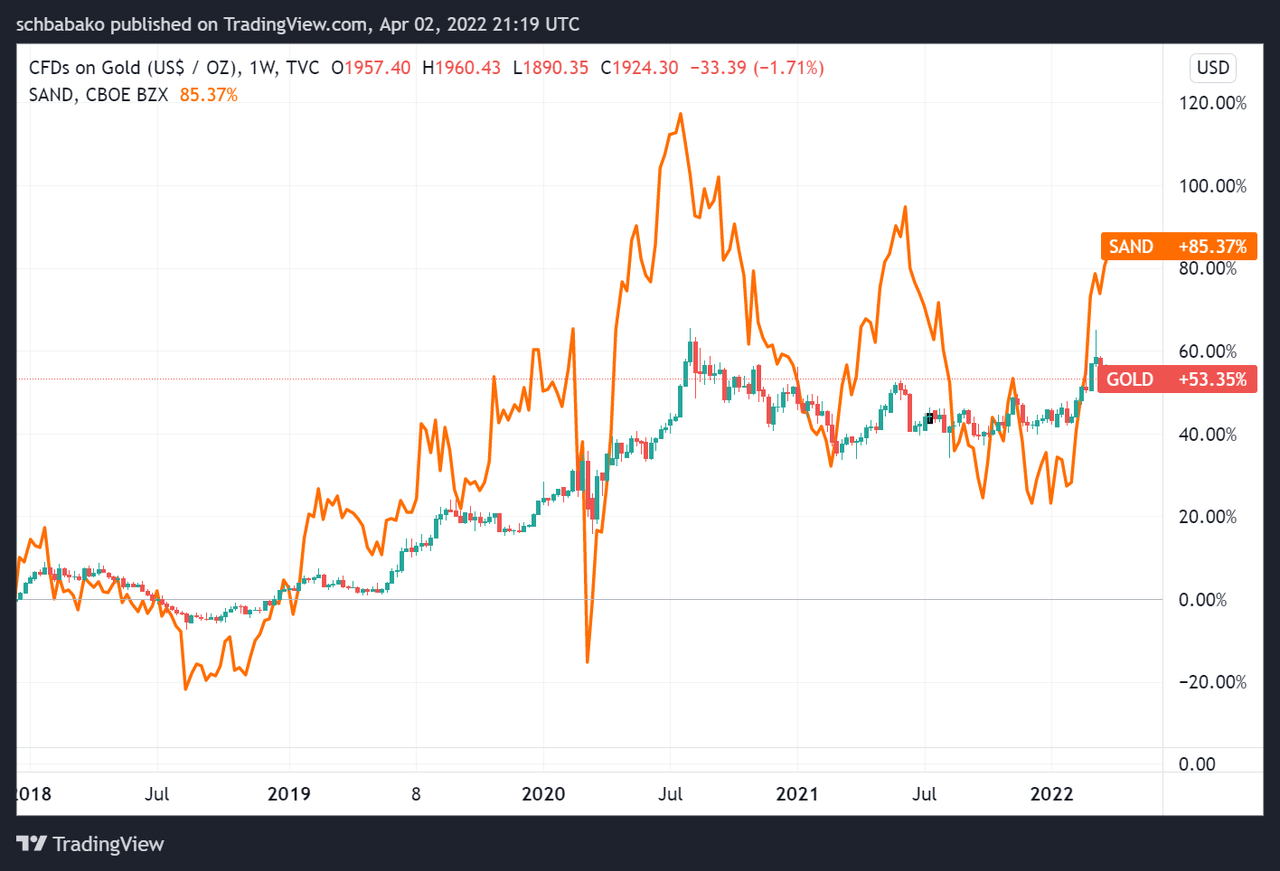
The risk is that the lever works in both directions. If the gold price decreases, the earnings of those miners will decrease according to the leverage they have between their costs to produce and the price of gold.
The chart above shows the leverage effect between the miner Sandstorm Gold (SAND) and gold.
As an investor in gold miners, you need to have a long-term positive outlook on the price of gold.
Two Miners You Could Consider For Your Portfolio
There are three categories of companies in the gold industry:
-
Mining Companies – These are companies directly involved in mining and selling gold.
-
Gold-focused ETFs: Funds that buy and own gold or shares of several promising gold mining companies.
-
Gold streaming and royalty companies: These are companies that pay the fees required to mine for mining companies in exchange for:
Sandstorm Gold Ltd.
Sandstorm is a gold royalty company that pays the upfront fees of mining companies and receives a share of the mine’s revenue. Sandstorm’s annual report lists all their royalty companies’ royalty agreement percentages.
Here is a small extract of how Sandstorm presents its asset portfolio.
Table of Sandstorm’s Mine Royalties (Sandstorm Quarterly Report)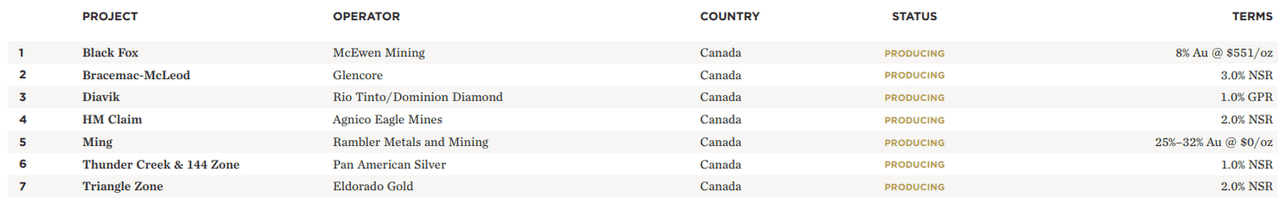
I’ve been holding Sandstorm for over a year, adding a lot during the recent December downturn. I made a decent return with the help of my dollar-cost-averaging strategy and considerably lower cost basis.
Sandstorm shares reached a low of $3.87 in 2020 during the height of the pandemic, then quickly corrected to nearly $10 within three months and gradually corrected to $6. The swings continue in tandem with the gold price, which is expected for miners or royalty companies.
Investing in Sandstorm is nothing for the faint of heart. Because of its smaller size (market cap at the time of writing is $1.6bn), its share price reacts heavily to changes in the gold price.
Sandstorm has a strong and globally diversified portfolio of mines. Many mines are in stable jurisdictions like Canada, the US, or in close proximity like South America.
Sandstorm’s Mining Portfolio Distribution (Sandstorm Investor Presentation)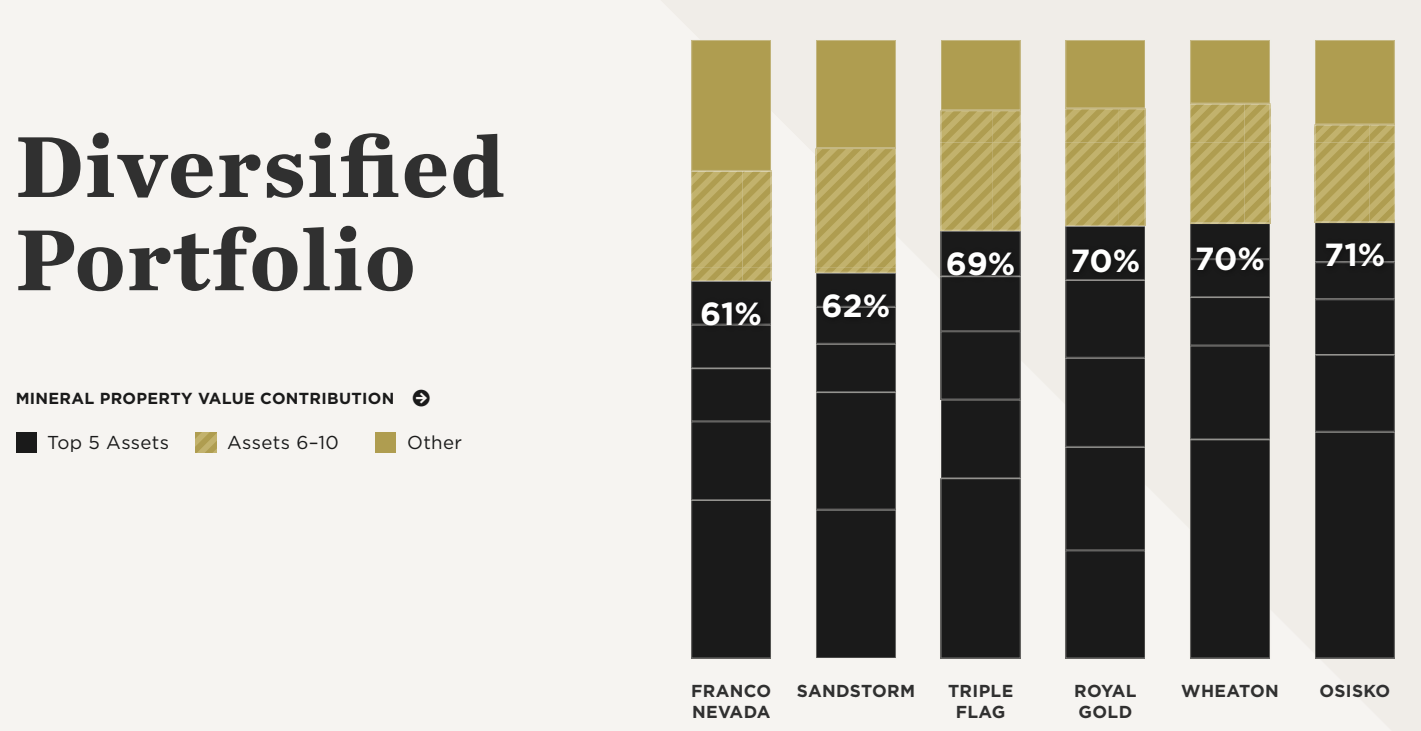
One of Sandstorm’s most prominent projects that investors eagerly anticipate is the Hod Maden mine in northeastern Turkey. The project has proven + probable mineral reserve of 8.7 million tonnes at an average grade of 8.8 g/t gold and 1.5% copper for 2.45 million ounces of gold and 287 million pounds of copper. Sandstorm expected Hod Maden to generate $1.3 billion at a discount rate of 5%, resulting in an internal return rate of 41%. That’s 90% of Sandstorm’s current market capitalization.
Mining potential of different mines (Sandstorm Quarterly Presentation)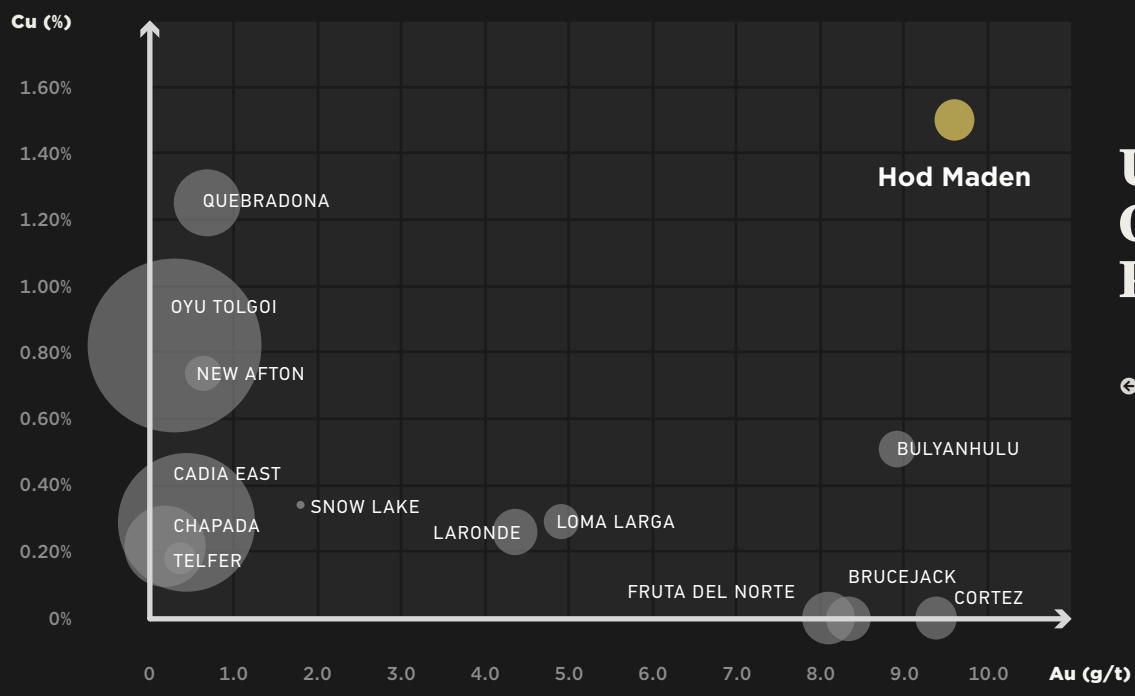
In November 2021, the Hod Maden project published its Feasibility Study and was granted the Environmental Impact Assessment (EIA). The EIA allows the project to move to the next stage of development. Production from this mine is expected to begin in 2024. Based on the quality of the mine, Hod Maden exceeds many other gold and copper mines at the same time.
Because of Sandstorm’s extensive portfolio of mines, their cash flow projections are increasing until 2025 and remain stable after that. The comeback in 2025 is because Sandstorm expects the Hod Maden to go online in 2024.
Cash Flow Projections of Sandstorm Gold (Sandstorm Gold Investor Presentation)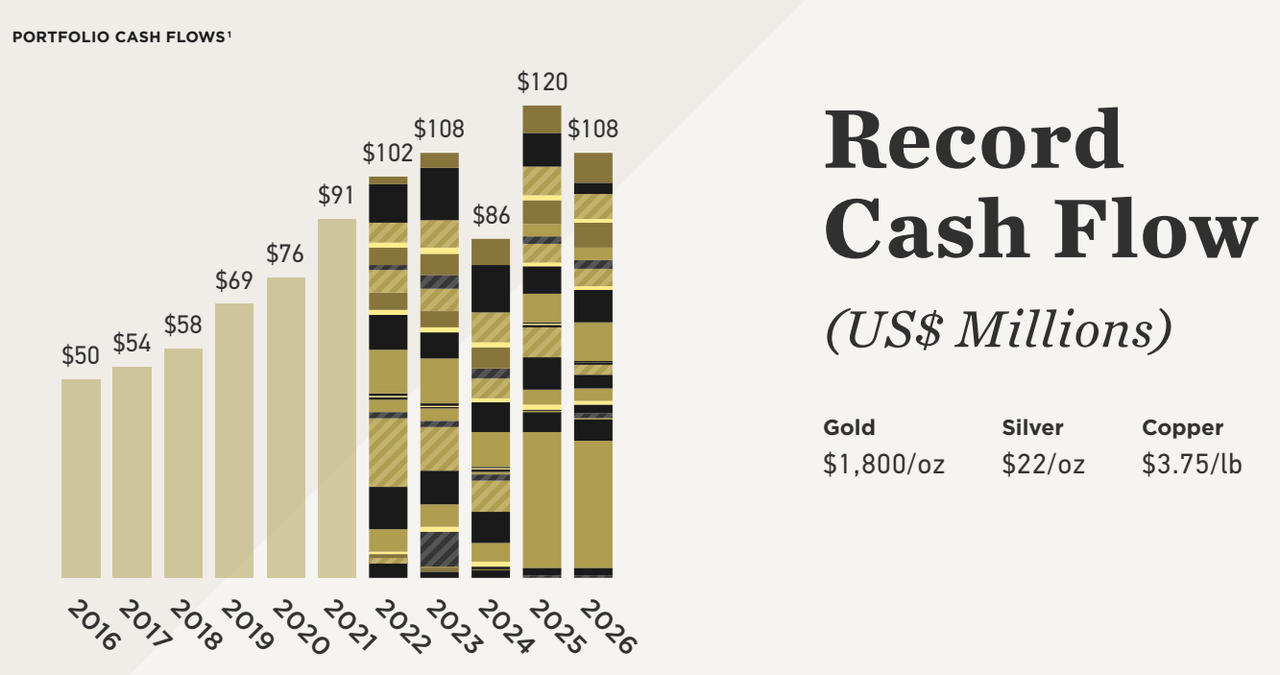
Sandstorm Conclusion
Sandstorm has an extensive and globally diversified portfolio of royalty agreements with gold, silver, and copper mines. I’m bullish on precious metals and commodities, especially those directly related to electric vehicles and the electric power grid.
Sandstorm is investor-focused and bought back 21 million shares between 2019 and 2022. Their dividend yield is small but emphasizes my point of investor-focused behavior. Sandstorm has no outstanding long-term debt. They funded themselves mainly by issuing new shares. Since 2018, the number of outstanding shares has remained stable.
Barrick Gold Corporation
Barrick gold is one of the most prominent and largest gold mining companies globally. With a market capitalization of $44bn, Barrick is a behemoth in the mining industry. The market capitalization and steady cost of mining are why its share price reacts less extensively to changes in the gold price than Sandstorm gold. Barrick is based in Canada and focuses its operation mainly on Tier One mining assets. Barrick defined Tier One mines as:
-
Gold asset with reserve potential to deliver >10-years
-
Annual production of >500,000oz of gold
-
Costs per ounce in the lower half of the mining industry
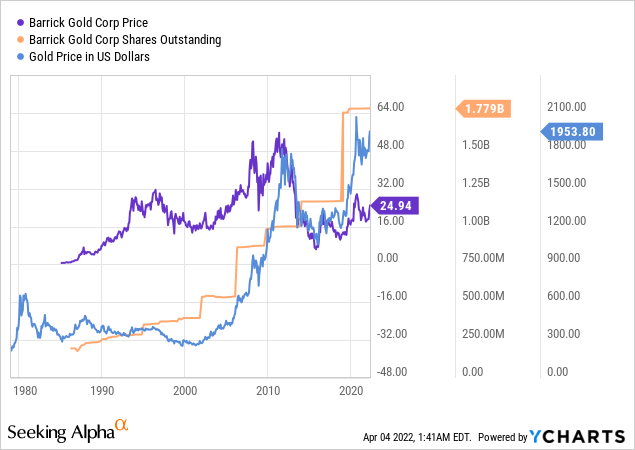
Price of Gold and Barrick Gold’s Share Price (Tradingview)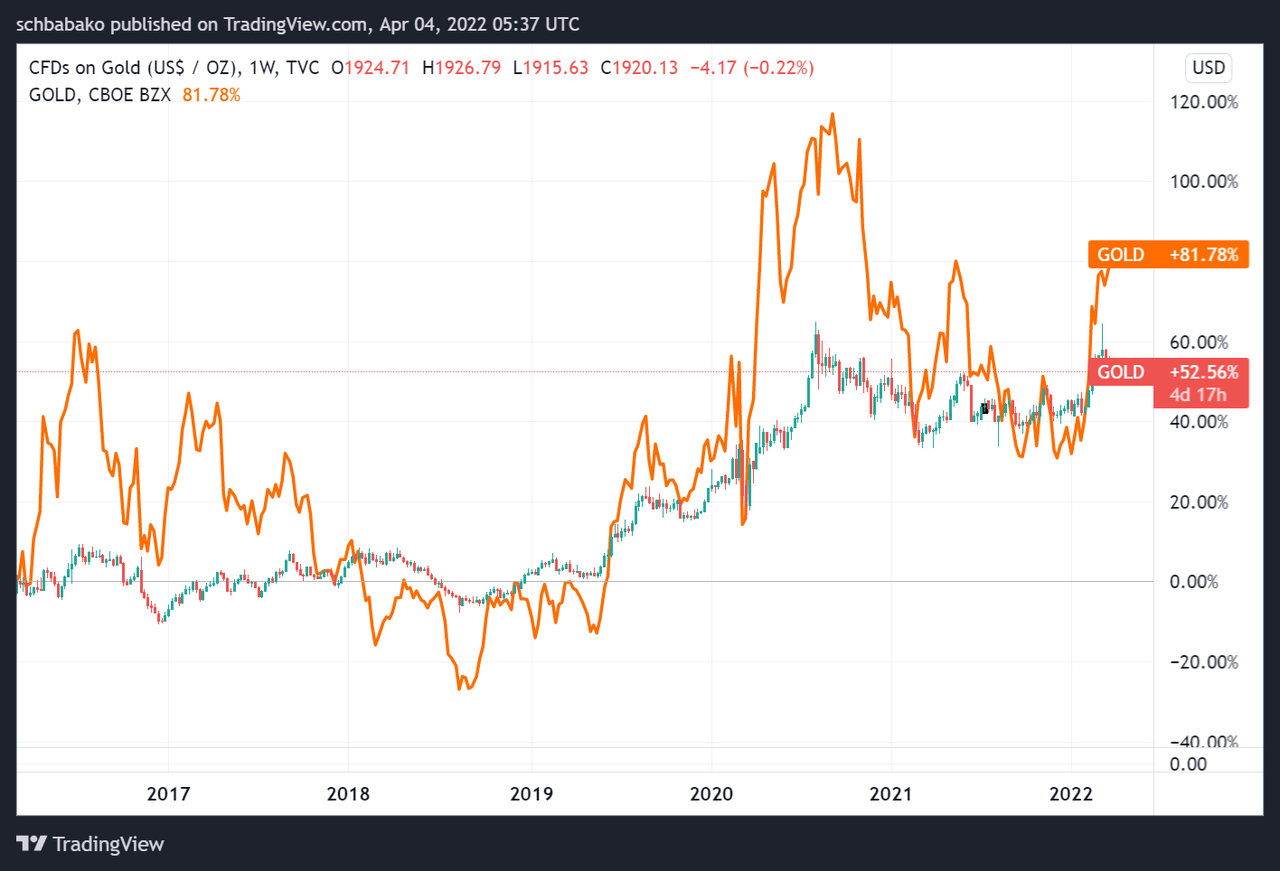
The rule for gold leverage – the closer the costs are to the current gold price, the higher the percentage difference if the gold price increases or decreases.
In the chart above, you can see that Barrick has a leverage of 1.6x against gold. Sandstorm has a leverage of approximately 2x. Barrick’s cost of sales for gold is ~$1065/oz.
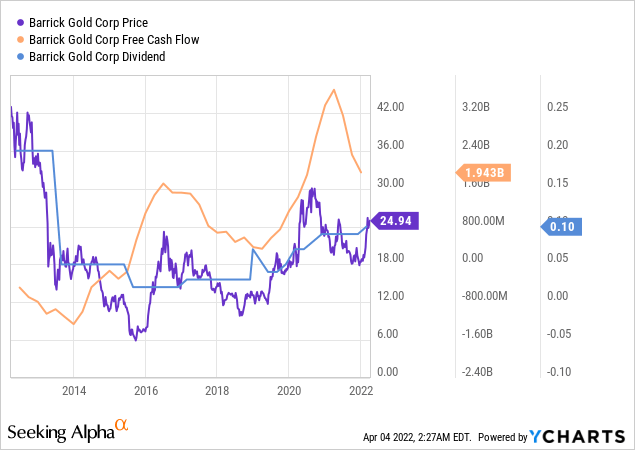
Barrick has a very conservative balance sheet with $5.4bn in outstanding long-term debt, which has been decreasing over the last five years. Barrick funds its operations through equity, which it increases according to new projects.
Management’s projection for the next 3-4 years looks promising without significant production dips.
Chart from Barrick’s Q3 Presentation (Barrick Gold )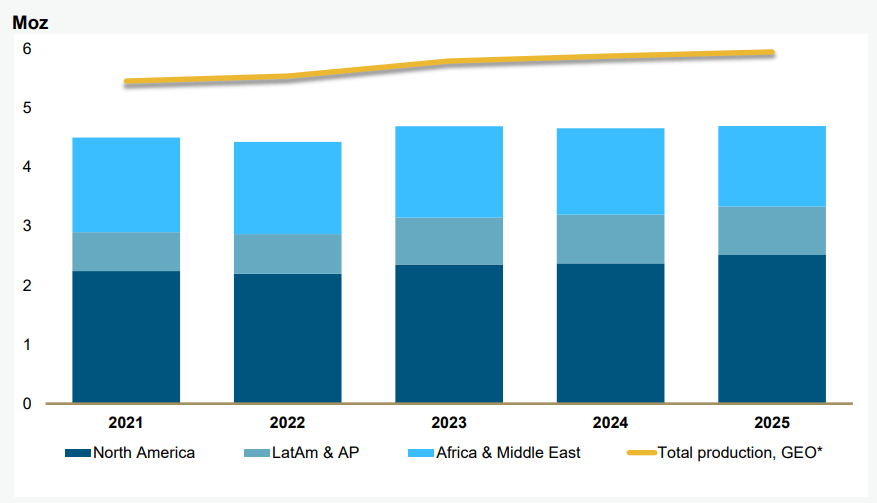
Barrick Gold Conclusion
Barrick Gold’s size and focus on high-quality mines make it a good choice for new and conservative investors. I would say it’s a gold stock for people who would like to tip their toe in the market.
Insider trading is another very positive indicator for Barrick. In 2021 and 2020, the high rankers from Barrick have been buying their stock. John Lawson Thornton, Chairman of Barrick, bought 100,000 shares at C$26.26. Mark Francis Hill, COO of Barrick, bought 60,018 shares at C$25.95 in 2021.
Insider Trading Barrick Gold (Marketbeat)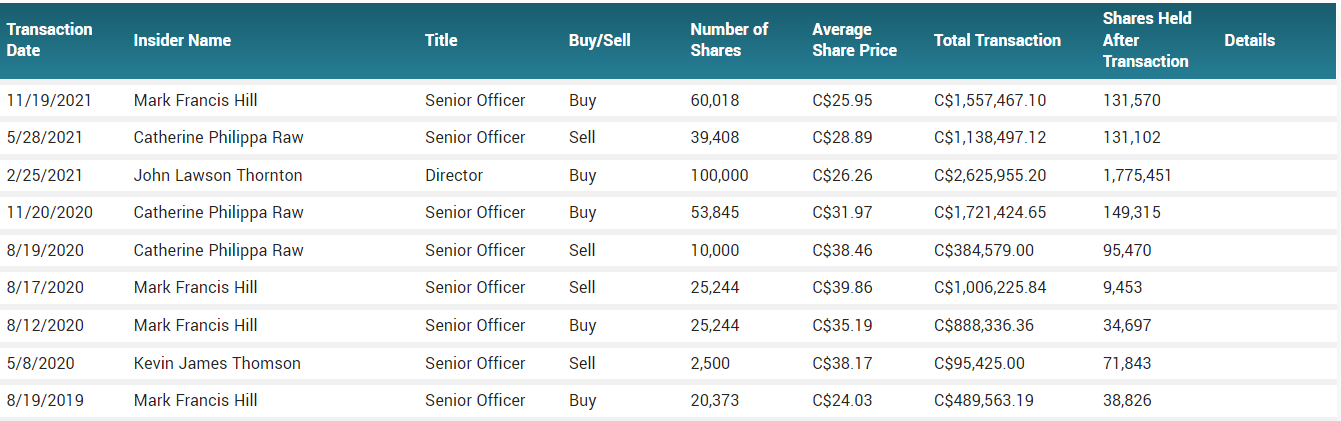
Conclusion
Precious metals and commodities experience a secular tailwind, sadly, not for the best reasons. Just a few days ago, Zoltan Pozsar published an opinion piece (I call it an opinion piece and not a research paper, yet it’s very close) about the four pillars of money – interest rate, parity, foreign exchange, and price level. These pillars can be influenced by (independent) central banks and adjusted to the state of the economy.
Then he discusses the discrepancy between the pillars of money and commodities. The same levers (QE and QT) used for money cannot be applied to commodities. Oil, gas, metals, and other commodities cannot be printed or tightened. They depend on freight routes, ships, pipes, mines, and more. He discusses the four pillars of commodities – price level, foreign cargo, shipping, and protection. These cannot be just tightened or eased.
Political tensions between the US, Europe, China, and Russia create inefficiencies in those trading routes, adding to the price of commodities.
For gold, I’m bullish for other reasons as well. Gold’s inflation rate is ~1.5%, and with no new significant discoveries, the supply will not increase in the future. Gold’s inherently scarce nature and increasing cost and difficulty to mine make me bullish and justify it as part of my portfolio. Once we reach higher gold prices, new forms of mining become economical, and gold could reach another plateau. For now, I don’t think we’re close to that new level.
To leverage my long-term bullish stance, I invested in Sandstorm Gold, and I’m currently considering Barrick Gold as an additional investment. I also own gold in its physical form.
I always welcome constructive criticism and open discussions. Please feel free to comment or message me about my calculations and/or sources that I use in my articles.
Be the first to comment