

ZargonDesign
“Happiness is just how you feel when you don’t feel miserable.”
– John Lennon
Before getting to this week’s update we get a view of market seasonality by showing the cumulative % change of only owning the S&P 500 by month over the last 50 years.
Monthly Seasonality (www.bespokepremium.com)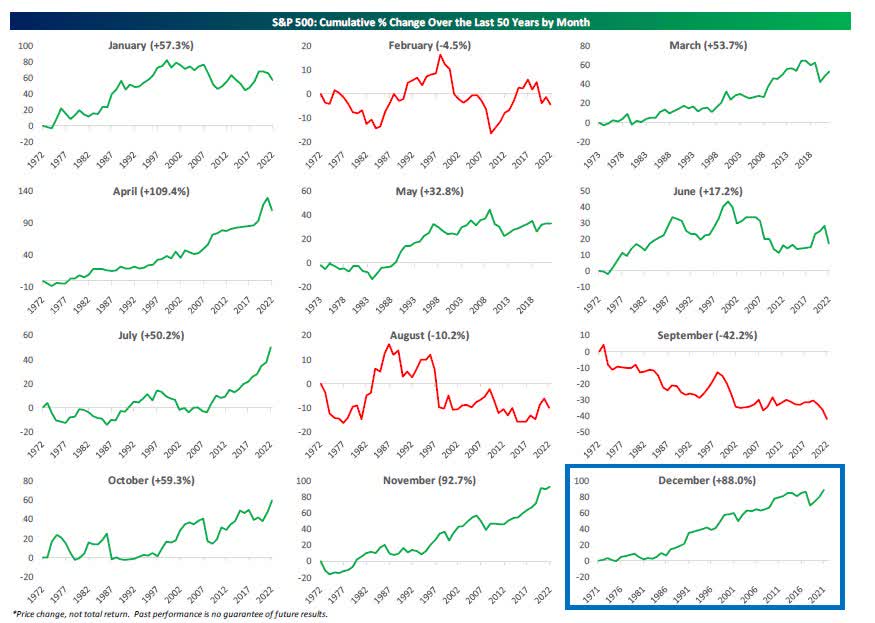
As shown, had you only owned the S&P in December over the last 50 years, you’d have a gain of 88%. Only November and April have posted stronger returns. This historical data is great, but we should be tempering expectations while in a primary BEAR market trend.
The Year-to-date
2022 has been a challenging and volatile year for investors. At the lows year-to-date (October 12), the S&P 500 had declined ~25% but has since recovered modestly to being down ~14%. If the year ended today, this would mark the weakest annual performance for the S&P 500 since 2008 (14 years). Despite this weak ‘headline’ number, there is significant dispersion beneath the surface, and we’ve talked about it for most of the year.
How bad has the equity market been for investors in 2022? Even with 15 trading days left in the year, 2022 has seen the third-most 1%+ down days for the S&P 500 ETF (SPY) since 1993 when it began trading. Only two other years have seen the stock market experience more than 60 one-day drops of 1% or more: 2002 and 2008. Those two years are not good company to be in. On the bright side, though, 2002 and 2008 were the final years of the last two extended bear markets experienced in the US. In both 2003 and 2009, SPY struggled in the first quarter but still managed to post total returns of more than 25% by year-end.
2022 Volatility (www.bespokepremium.com)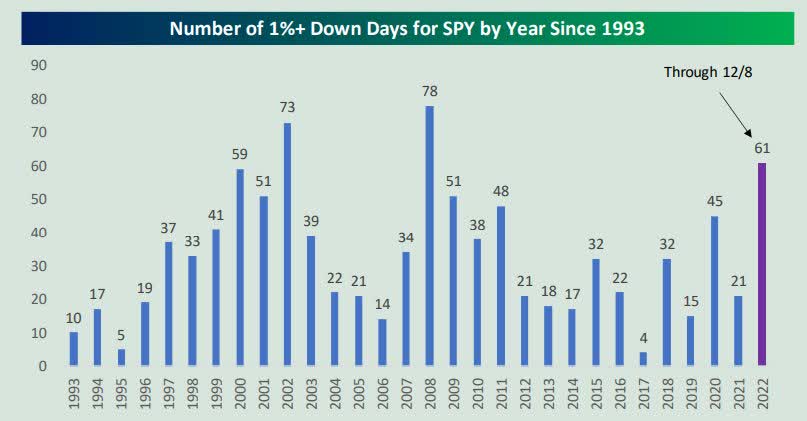
The best-performing sector (Energy: +55%) is outperforming the worst-performing sector (Communication Services: -33%) by an astounding ~88% year-to-date! This marks the largest annual sector dispersion between the best and worst-performing sectors since at least 1995 and is nearly three times the historical average. Additionally, it is worth pointing out that six of the eleven S&P 500 sectors are either in positive territory or down less than 10% year-to-date, while some of the more heavily weighted sectors (e.g., Communication Services, Consumer Discretionary and Tech) are down over 20%. This suggests that the ‘average’ sector is doing much better than the ‘headline’ S&P 500 performance number, and we’ve seen most of that “change” occur in the last 2 months.
Risk assessment
About a month ago I introduced the eight components that make up an Equity Market Risk Gauge. The most bullish environment would be one where a majority (or all) of the indicators are green, while the most bearish would be one where all eight indicators are red.
Positives
In the spirit of carrying on a search for Santa, I decided to try and spin a more “glass half full” slant to this week’s commentary. So, I do admit the “so-called” positives, are questionable. Of course in a BEAR market trend, positives are usually open to doubt.
Seasonals
By now just about every investor realizes how strong the post-midterm election period usually is and combined with December seasonal patterns keep this tailwind at the top of the list. The fact that it’s been promoted everywhere can keep investors in a holiday mood. However, there is sufficient evidence that the seasonals might not be as strong in a BEAR market.
Conditional Seasonality (www.topdowncharts.com)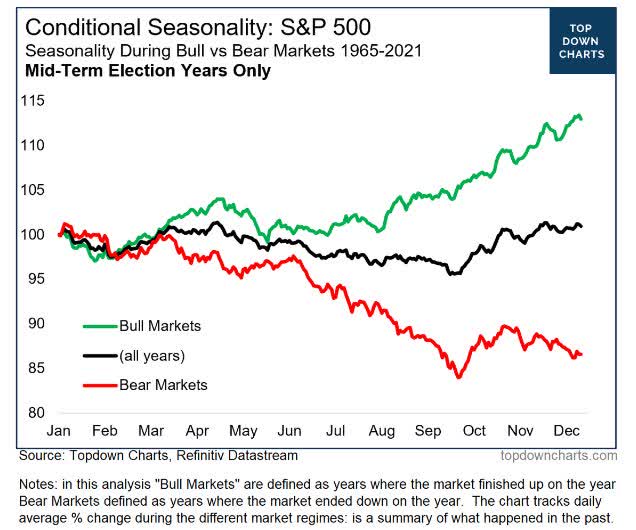
Therefore this “tailwind” could quickly dissipate if BEAR market “headlines” continue to pop up.
Investors Are Bearish
As a contrarian indicator, there is still no optimism to be found across both investor sentiment surveys and consumer sentiment surveys. The weekly AAII bull/bear survey of individual investors has had a negative bull/bear spread for a record 35 consecutive weeks, and 2022 will likely go down as the most bearish year on record in AAII’s history since 1987. While the contrarian setups have not worked at all in 2022, we do have to consider it when discussing the MACRO view as a potential tailwind for stocks.
Internals
Market internals continues to show strength as opposed to showing weakness during the late stages of last year’s rally and the early stages of this year’s bear market. High yield spreads (the difference between yields on junk bonds and Treasuries) typically move inversely with equities, meaning they tighten as equities move higher and expand when equities move lower. This year when the S&P made a new low in October, high yield spreads didn’t make new highs, and they’ve been tightening in line with the S&P’s rally off the October lows.
We’ve also seen a big expansion in the percentage of S&P 500 stocks trading above their long-term 200-day moving averages. More than 60% of stocks are now above their 200-Day moving averages, which is well above the high seen at the peak of the S&P in August. Additionally, just this week we’ve seen the percentage of stocks making new 52-week highs expand above the highs seen in August as well, even though the S&P’s price has yet to eclipse its August peak.
Negatives
Technicals
The S&P 500 did manage to break above its 200-day moving average in late November, only to drop below that resistance level. That would be considered the first step in building towards an eventual break of the downtrend that has been entrenched since prices peaked at the start of the year. We have still not seen the index break above the top of its downtrend channel, and that means we have still not seen the index put in a higher low or a higher high either.
Bottom line;
Until that happens, the technical view remains bearish.
Recessions indicators
Economic activity has started to slide as measured by a range of survey data. Manufacturing Purchasing Manager Indices (PMIs) are under 50 (indicating contraction).
The chart below from Bespoke shows the net number of economic indicators that are accelerating on a year-over-year basis. As shown, this reading has gotten down to extreme lows as we get close to year-end – another clear recessionary signal.
Recession indicators (www.bewspokepremium.com)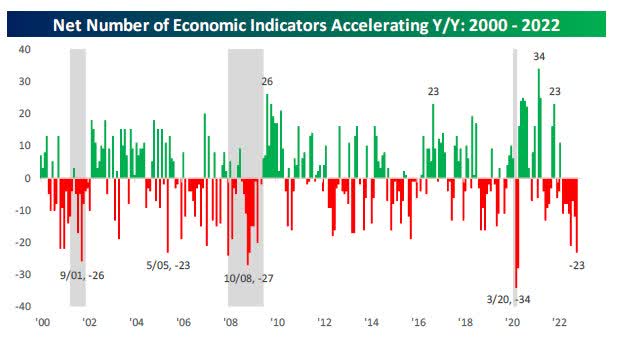
Neutral
I will also add a caveat to what is perceived as “neutral”. For this analysis I attempted to stay more balanced and gave the benefit of doubt to the BULLS. However, there remains a multitude of conditions that can change either one of these two issues back into a “negative” for the market.
The Fed
Terminal rates refer to the highest policy rate of a tightening cycle. Since the November meeting, the FOMC has sought to shift focus from the size of a given meeting’s rate hike to the terminal rate and how high it needs to go. Since mid-October the market’s pricing for the Fed Funds rate has been sideways, vacillating between a range of 4.75%-5.25% peak range. Pricing reflects a peak rate in May as-of December 2nd. 50 basis point hikes and a 5%+ terminal rate is still a hawkish policy, but the more dire forecast seems to have been removed (for now) from the Fed’s commentary.
Let’s be realistic, the Fed’s strategy is now well-known, and unless there is a surprise coming, this “policy” has been priced into the market. As we move into 2023, many analysts and market pundits are going to be focused on the Fed and what its next move will be. I believe that is going to be a wrong-footed approach. Instead, I will be introducing a new theme as part of my investment strategy for 2023 that is going to greatly differ from the consensus view.
Valuation
Valuation declines are rarely fun for investors. Since earnings per share move at a different pace compared to equity prices, periods of declining valuation almost always involve price declines for equities. As for this cycle, the intraday low in October came with a 16.5x multiple. If that low holds, it would be the third-highest bear market low trailing multiple since the 1950s. While we can’t rule it out, history suggests bottoms typically come at lower multiples between 11 and 14. That is a scary scene for most investors.
The reason this stays neutral today is that at least two valuation headwinds have abated over recent weeks. For the first three quarters of the year, real yields and the US dollar surged, putting a higher hurdle rate on stocks. But lately, both have pulled back. The Dollar Index closed at a six-month low on Wednesday.
USD Index (www.bespokepremium.com)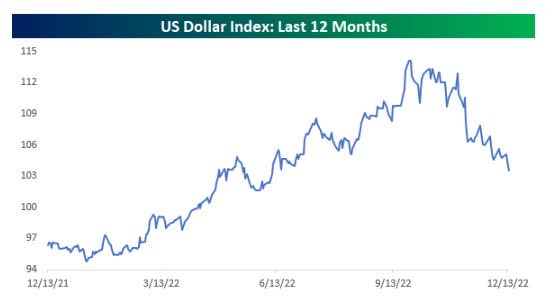
Even with that move, estimated earnings for next year offer a yield (inverse of multiple) that isn’t exactly compelling relative to what’s on offer from Treasury yields; the 2007 bear market started from similar relative yields.
Bottom line
The housing market will be a major reason for a recession that could last a while if mortgage rates stay elevated. High mortgage rates have already smashed demand for mortgage loans, driving applications for home purchases to a level consistent with barely 4 million annual transactions. Modest declines in mortgage rates have led to a few weeks of higher applications, but the slowdown in housing is so dramatic that layoffs are starting to mount in the mortgage and homebuilding industry.
The MACRO picture will continue to be dominated by the degree of inflation moderation ahead, Fed policy, and how much damage will be inflicted on the economy to bring inflation under control. The latest core producer price inflation came in hotter than expected in November, while as we will see later, the all-important CPI release was much cooler than anticipated. While inflation may have peaked, it will hang around for a lot longer than most want to admit.
Another very important piece of the inflation equation is employment costs, given they make up the vast majority of corporate costs in the services sector (where inflation has been particularly high). The Employment Cost index is at a very elevated 5.0%, putting pressure on the services sector to offset these costs with price increases. Wage growth remains too high and may take time to move considerably lower. So there is high uncertainty in predicting the inflationary outlook and these factors will remain the primary influences on earnings and multiples.
At 282 calendar days (through the 10/12 low), the current S&P 500 bear market reached the average length of all bear markets going back to 1928. In terms of the decline, the average bear has seen a drop of 35% from peak to trough, so this bear’s 25.4% drop at the low did not reach the average level. Until the S&P sees a rally of 20% or more off the lows and can close above the longer-term 20-month moving average, the bear market remains in place.
The Action On Wall Street
After losing ground in the prior week, the major indices stepped into a trading week that was filled with economic headlines. Each and everyone was a potential landmine.
After watching the S&P trade in the 3900-4100 for 21 trading days, it appeared the BULLS wanted to do something about that as they sent the index 1.4% higher on Monday. The day before the much anticipated CPI announcement. With a “cool” inflation report stocks started the day out “hot”. A rip-roaring opening ran into technical resistance levels, and the “BUY” programs reversed to SELL programs. At the end of the day, the S&P gained what turned out to be a modest 0.75%.
The S&P 500 had to absorb another headline On Wednesday. This time it was the FOMC announcement and the post-meeting commentary from Chair Powell. The BUY and SELL programs were like a cement mixer, add a little water, add cement, more water, then cement again and churn away. Investors didn’t like what they heard from Powell on Wednesday and after sleeping on it they entered the last two days of the week in SELL mode.
While the “action” this week was attributed to the headlines, Savvy investors realize there is a lot more to the stock market than a headline. There are numerous factors that form the short, intermediate, and long-term market trends. Those factors sent the S&P to its second week with losses that now totals 5.3%. All of the other indices followed suit with back to back weekly losses.
So just when it looked like the S&P was ready to break up and out of the trading range, instead it broke down. That’s been the story for the entire year.
The economy
Inflation
Headline CPI edged up 0.1% in November and the core was up 0.2%, both much cooler than expected. Price pressures continue to dissipate from cycle highs. The overall rate has come down from the 1.3% hit in June while the ex-food and energy component is off from 0.9% in April 2021. This is the smallest increase in the core since the same-sized gain from August 2021. The annual rates slowed to 7.1% year over year from 7.7% y/y for the headline and compares to June’s 9.1% y/y 40-year high.
The core rate decelerated to 6.0% year over year from 6.3% y/y and a 40-year peak of 6.6% y/y from September. The internals of the report was mixed.
This should solidify the expectations that the Fed will raise interest rates by 50 basis points tomorrow. It should keep analysts’ expectations of rate hikes of 50 basis points in February, and 25 basis points in March. Remember this will continue to be a “fluid” situation that can change rapidly. Therefore, instead of providing the usual analysis where today’s report is dissected to highlight the positives and negatives, it’s better to leave that exercise for later. Suffice it to say this is a step in the right direction.
Manufacturing woes continue
The Philly Fed index bounced 5.6 ticks to 13.8 in December, weaker than forecast, after dropping 10.7 points to 19.4 in November. This is the fourth consecutive contractionary reading and the sixth in seven months. Most of the components were sub-zero.
The Empire State Manufacturing index slumped 15.7 points to -11.2 in December, much weaker than forecast, and largely erased the 13.6-point surge to 4.5 in November. The components were mixed.
Headline Industrial production fell 0.2% in November, the fifth decline in the past seven months, on a broad-based pullback that saw every major industry and market group other than utilities fall back. Expectations were for a flat read. Y/y industrial production is now up just +2.5% (down from +5.3% in October).
PMI data stays in contraction.
US PMI Composite Output Index at 44.6 (November: 46.4). 4-month low.
US Services Business Activity Index at 44.4 (November: 46.2). 4-month low. US Manufacturing Output Index at 46.0 (November: 47.4). 31-month low. US Manufacturing PMI at 46.2 (November: 47.7). 31-month low.
Economic weakness may now be spreading to the Consumer.
November Retail sales came in at the weakest level of the year with drops of -0.6% overall and -0.2% ex-autos after small net downward revisions. Retail sales weakness in November was led by the furniture, vehicle, and building material and supply components.
Economists can call it what they want, but this and just about every other data point reported recently is in contraction.
The “soft landing” crowd needs to start reassessing the situation.
Small business
The NFIB Small Business Index rose 0.6 points in November to 91.9. November’s reading is the 11th consecutive month below the 49-year average of 98. NFIB Chief Economist Bill Dunkelberg:
“Going into the holiday season, small business owners are seeing a slight ease in inflation pressures, but prices remain high. The small business economy is recovering as owners manage an ongoing labor shortage, supply chain disruptions, and historic inflation.”
Small Business Index (www.nfib.com)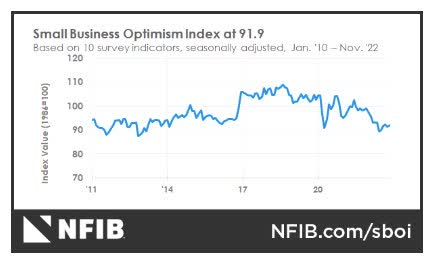
Global scene
China
China released a huge amount of monthly economic data, and every indicator came in weaker than expected including larger-than-forecast declines in retail sales, higher-than-forecast unemployment rates, and slower-than-expected industrial production growth.
Chinese consumer spending has been impaired since the advent of Omicron made the COVID-Zero strategy especially impactful. The current massive increase in COVID cases under a more relaxed policy that has been adopted over the last couple of weeks will likely hit retail sales spending even harder near-term before allowing a bounceback. Also notable is the decline in industrial production as consumer goods buyers dry up and domestic demand falters.
Global PMI data
A slightly more constructive read on PMI activity than we’ve seen in recent months.
The UK
PMI Composite Output Index at 49.0 (Nov: 48.2). 3-month high.
Services PMI Business Activity Index at 50.0 (Nov: 48.8). 3-month high.
Manufacturing Output Index at 43.9 (Nov: 44.7). 4-month low.
Manufacturing PMI at 44.7 (Nov: 46.5). 31-month low.
The Eurozone
PMI Composite Output Index at 48.8 (Nov: 47.8). 4-month high.
Services PMI Activity Index at 49.1 (Nov: 48.5). 4-month high.
Manufacturing Output Index at 47.9 (Nov: 46.0). 6-month high. Manufacturing PMI at 47.8 (Nov: 47.1). 3-month high
Japan
Composite Output Index, December: 50.0 (November Final: 48.9)
Services Business Activity Index, December: 51.7 (November Final: 50.3) Manufacturing Output Index, December: 46.4 (November Final: 45.8)
The Fed
The FOMC announced an increase to the Fed funds rate of 50 basis points, to 4.25% – 4.50%, with a 4.37% midpoint, as well anticipated. The decision was unanimous. However, the thrust of the stance as seen in the policy statement and dots was hawkish relative to the positioning in Treasuries and on Wall Street. The policy statement reiterated;
“The Committee anticipates that ongoing increases in the target range will be appropriate. Additionally, the dots were revised higher to a 5.1% median rate for 2023, well above expectations, but in line with Powell’s warnings.”
Additionally, it is now the case that 17 of the 19 FOMC members project a funds rate with a 5% handle next year. In September, there were no forecasts at 5%. One official expects a rate of 5.63% in 2025.
Earnings
Energy earnings estimates continue to get revised higher (while S&P 500 earnings estimates are declining), supporting outperformance for the sector. On the flip side, Technology earnings estimates are getting revised downward at a quicker pace than the S&P 500, which is a headwind for sector performance.
There has also been an improvement in equal-weight Consumer Discretionary relative performance in the second half of this year. This has been a positive divergence with inflation staying high and the market being volatile, in what should have outsized effects on the Consumer Discretionary sector.
The main takeaways here are to stay with Energy and start to realize that The entire Technology complex is going to be a laggard for some time. If you believe a recession is on the table in ’23 then it is difficult to get too deep into the “discretionary” space. There will be opportunities there but they will be few and far between.
Food for thought
The “Welfare State” will drag down the economy in 2023
Of course, there were needy Americans during the Covid health emergency. Still, the pandemic was turned into a program to expand the base of citizens and in some cases non-citizens (we now have a class called “qualified” non-citizens) who are permanent government dependents. Some states are looking for the exit ramp on this road to socialism, and it is interesting that Georgia recently won its lawsuit against the Administration to impose Medicaid work requirements for low-income, able-bodied adults.
Excerpts from the Wall Street Journal;
Since January 2021, the Administration has continued to extend the public-health emergency for no apparent reason other than to expand “welfare”. Last September, the President declared the pandemic over, but the Health and Human Services Department apparently didn’t recognize that proclamation, because it is extending the emergency until at least mid-April of next year.
In addition to providing checks to people, one of the 2020 “Covid” bills increased federal Medicaid funding to states on the condition that they don’t kick ineligible beneficiaries off their rolls as long as a public health emergency is in effect. The law also increased food-stamp benefits and waived work requirements for able-bodied, working-age adults during the emergency. Calling a time where there are 10 million unfilled job openings and approximately 1.7 job openings available for every person an “emergency” is reckless spending that will continue to plague this economy.
Since February 2020, Medicaid enrollment has ballooned by 23 million to an all-time high of 97 million. By comparison, Medicaid grew by 14 million between 2013, just before the ObamaCare expansion took effect and the start of the pandemic. About 21 million Medicaid recipients don’t currently meet eligibility requirements, according to the Foundation for Government Accountability.
In the Georgia case, as long as the “emergency” is in effect, they can’t remove able-bodied adults on Medicaid who don’t comply with its work requirements-or if it does, it may have to give up hundreds of millions in federal funds. The “emergency” is tantamount to fraud being perpetrated on the working taxpayer.
The same is true for food stamps whose rolls have swelled by nearly five million nationwide, or about 13%, during the pandemic owing chiefly to the emergency suspension of work requirements, there would appear to be no need to keep work requirements suspended as unemployment has reached pre-pandemic levels. Work requirements were in place then and this time is no different. Anyone who wants a job can get one, but expanded transfer payments have reduced the incentive to look. No matter how exaggerated one wants to get, there is no “emergency” here.
Monthly federal food-stamp spending has more than doubled during the emergency to $9.3 billion owing to the sweetened pandemic benefits and a Department of Agriculture regulatory change last year. Benefits are set to increase another 12.5% this fall with an inflation adjustment. Transfer payments fueled inflation.
The bipartisan welfare reform of the 1990s was one of Bill Clinton’s economic accomplishments that spawned one of the best stock market environments of all time. That move saw labor participation rise. Too many politicians of both parties today want to expand government dependency. Bottom line: there is no “emergency” here, in fact, many in DC are telling Americans all is well and the chance of recession is minimal if we see one at all. So which is it? A dire “emergency” that requires more welfare or an economy that is doing just fine.
If this so-called “emergency” spending isn’t reversed quickly, the ramifications will be felt for years to come. It has added to the inflation woes, as this is another roadblock for the FED to deal what in their fight to slow inflation. Ladies and Gentlemen, there can be no appreciable growth if too many are sitting around depending on the government to exist. At some point, it becomes mathematically impossible for the working class to support the masses living on transfer payments. In addition, companies have to continue to increase wages to entice people off the welfare rolls. That adds to the inflationary spiral and makes the Fed’s job that much more difficult.
This spawns a slow/no growth economy that produces below-average returns on investment, leading to a vicious death spiral that destroys wealth for EVERYONE. History (the Clinton 90s, and others) have taught us what is necessary to bring back growth. I continue to sound the warning. Raising rates to fight inflation in a no-growth economy is a recipe for economic calamity in 2023.
The Daily chart of the S&P 500 (SPY)
If it looks like another failed rally in a BEAR market it probably is. As I eluded to earlier, many ingredients go into the short-term recipe for stocks and the technical view continues to dominate.
S&P 500 (www.FreeStockCharts.com)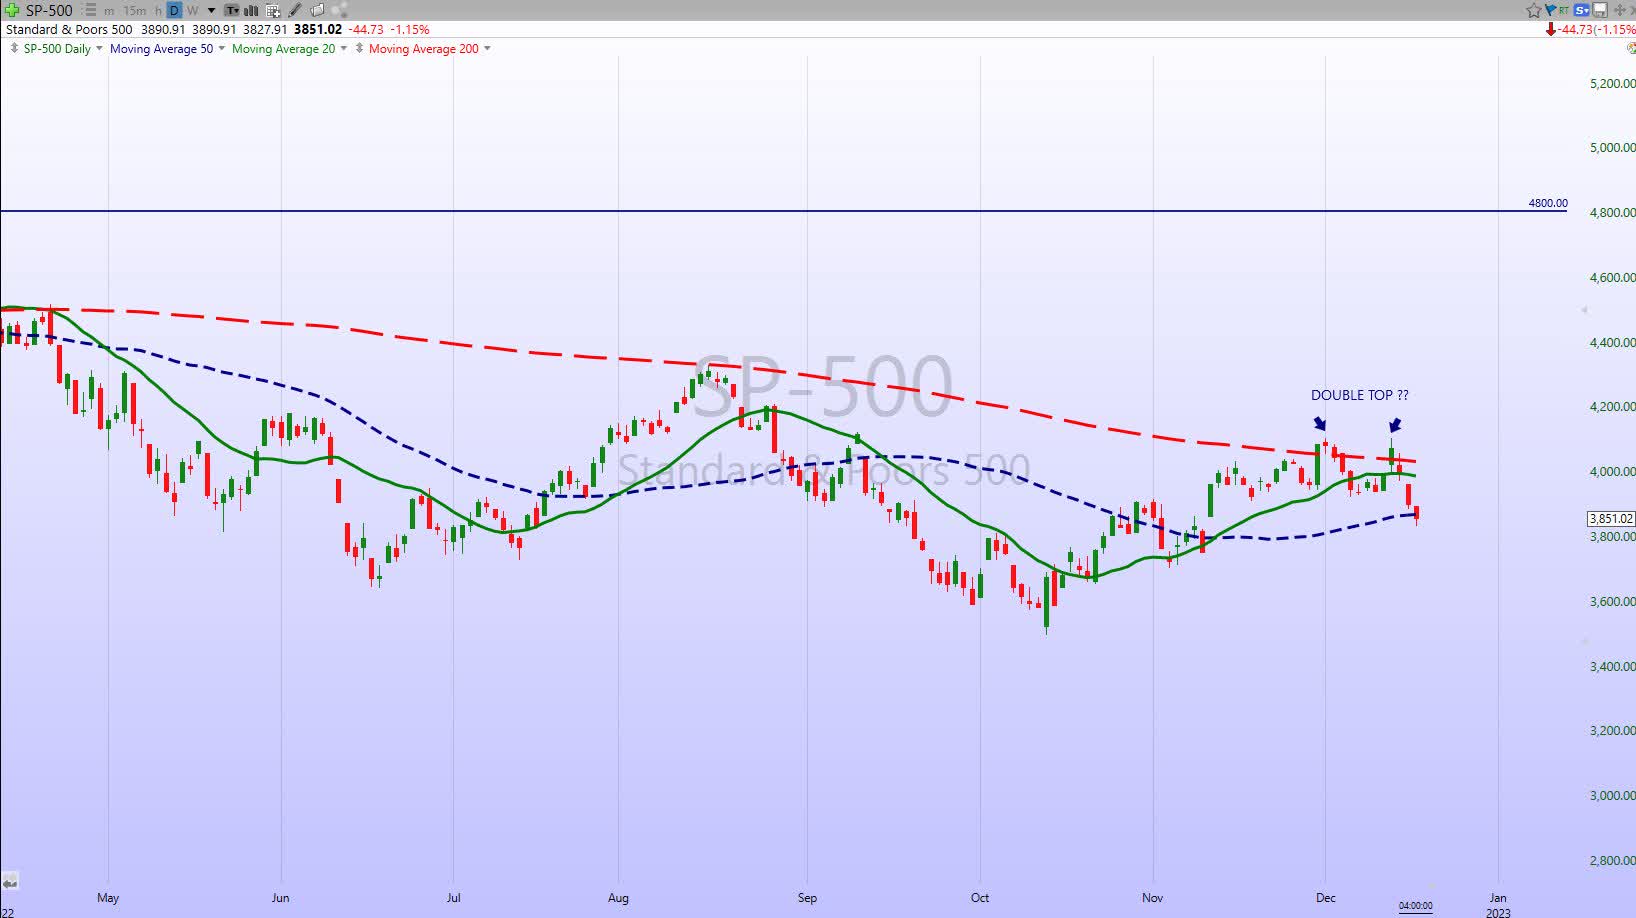
Resistance has held and once again investors are wondering when Santa shows up and support might come in. Since late October, the action is sideways, but the index is fast approaching a level that could open the door to fresh new BEAR market lows.
Investment backdrop
As frustrating as the start to December has been for bulls, it shouldn’t come as too much of a surprise. As we’ve seen in many seasonality reports, the S&P 500’s performance during December has typically been weak in the first half of the month.
Bespoke Investment Group;
Going back to 1983, performance at mid-month was barely positive and looking just at the last ten years, the S&P 500’s average performance has been a decline of 0.82%.
While the first half of December has traditionally been a weak one for the market, the second half of the month has typically been much stronger. Both going back to 1983 and over just the last ten years, the S&P 500 has trended higher in the second half of December. Similar to the broader market, December has also been a backend-loaded month for sectors.
December Performance (www.bespokepremium.com)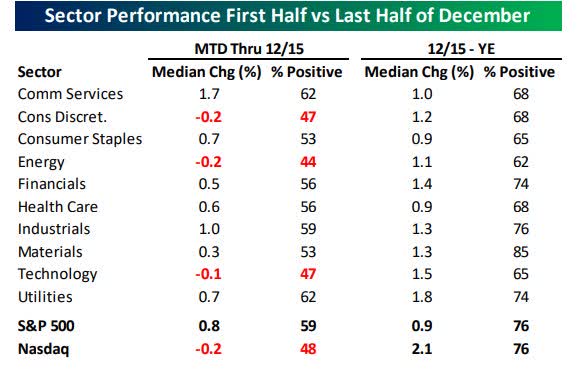
Of the eleven sectors, the only one with better median returns in the first half of December than the second half is Communication Services. December was an even weaker start for the Nasdaq which fell 4.4% in the first week. The only two Decembers that got off to a worse start were 1974 (-7.5%) and 1975 (-5.2%), but if it’s any consolation, the rest of December was positive both times with gains of 2.8% and 3.9%, respectively. As shown above, the Nasdaq’s median first-half return in December has been a decline of 0.2% with positive returns less than half of the time, but during the second half, its median gain has been 2.1% with positive returns over three-quarters of the time.
However, with less than 15 trading days left in 2022, any hopes for anything but a bad year in the stock market can be put to bed. The bulls have pretty much run out of time.
In the short term, the stock market is always guided by emotion, and lately, it’s all been negative.
Thank you for reading this analysis. If you enjoyed this article so far, this next section provides a quick taste of what members of my marketplace service receive in DAILY updates. If you find these weekly articles useful, you may want to join a community of SAVVY Investors that have discovered “how the market works”.
Small caps
When I look at a period of about 15 months for the Small Caps (IWM) I see a series of peaks that are all LOWER highs. The index just broke another support level this week. It will take some work by the BULLS to now try and re-establish the rally mode.
If you find what is presented here every week to be useful, the analysis and presentation to members of my service are complete with charts that zoom in on the critical pivot points for each group. A picture is worth a thousand words.
Sectors
Energy
Resistance at the old high was just too much to overcome and the Energy ETF (XLE) pulled back ~12%. A give-and-take week left the ETF sitting between support and resistance. It looks like a sideways pattern can emerge as long as WTI can trade in the ’70s.
Many individual stocks (the oil explorers) have given back much more than the ETF which is propped up by the large caps (CVX), (XOM), etc. However, ALL remain in long-term bullish trends.
Natural gas
The Nat Gas ETF (UNG) broke support and then promptly rallied ~16%. With that last breakdown, the problem becomes a series of lower HIGHS and Lower LOWS since the last high in August. It is now critical that the recent low, which matches the March low, hold.
Financials
Another false breakout? Given the latest price action, it sure does have that look. The Financial ETF (XLF) traded above the August highs and it all looked so promising. At the close on Friday, the ETF is now barely hanging on to support. So the attempt to break the longer-term BEAR trend has failed on this try. A break below the November lows suggests the Financials could be ready to test their BEAR market lows.
The regional Bank index (KRE) doesn’t look much better. The outlook for a poor economy makes this sector something I see no need to have an overweight positioning.
Commodities
Silver typically tends to outperform during cyclical upturns in the economy because it has more industrial demand underpinning its prices than gold does. Conversely, silver also tends to be a higher beta to all moves in precious metals because it’s less liquid and has less speculator interest than gold.
The second week into the breakout showed a promising “Bullish” pattern that gave way to profit-taking. I don’t expect a parabolic move higher, but if this rally continues, a stair-step move to the $24 level (the April highs) could be in order.
Healthcare
The Healthcare group (XLV), has been a favorite all year, and it continues to outperform the major indices. The ETF is up ~12% for Q4 and that has the group about even for the year. That is a decent performance in a BEAR market.
With the uncertain backdrop, there is no need to chase. At some point, the favorites will come into a BUY zone. I like the sector to fare well as the economy stays weak in ’23.
Biotech
The back-and-forth action in a narrow trading range continues. Savvy investors are playing with house money (+25%) after picking up shares of (XBI) in June. As mentioned in prior updates this ETF is a solid choice to BUY and employ a call writing strategy. That will continue to enhance profits in this position.
Technology
My overall views on the technology sector remain unchanged. the group will continue to be laggards in ’23 for a variety of reasons. There will be select opportunities, but they will also be tough to uncover.
Semiconductors Sub-Sector
The semiconductor ETF (SOXX) finds itself at a crossroads of sorts. It’s caught below resistance and just above support. Like so many other situations, the latest attempt at a breakout looks to have failed. The ETF has traded sideways for 25 days and the BULLS will tell you it’s building a base to break out, while the BEARS say it’s another failed attempt at breaking resistance.
That implies a guess as to what comes next and the technical chart of the (SOXX) sums up the total uncertainty surrounding the entire market scene.
Ark Innovation ETF (ARKK)
I continue to follow the chart of the Ark Innovation ETF (ARKK) because it represents the most speculative areas of the market, and gives us a good idea of the ‘risk’-on/off” scene. After achieving its April 2021 high, the ETF has dropped 80%. Investors seem to forget that before the BEAR market pullback, the ETF rallied ~324% in the prior 12-month period. When we speak about reversion to the mean, ARKK is the poster child.
The basing pattern is now in its 7th month. Similar to other examples across the investment landscape it highlights the raging debate between the BEARS and the BULLS as to what comes next. As of the close on Friday, it is barely clinging to support.
Cryptocurrency
Crypto prices and crypto stocks have fallen alongside other risk assets. Bitcoin remains in its tight range below its moving averages. There has been a spread of less than 10% between the past month’s high and low for the total crypto market cap.
.
Bitcoin (www.bespokepremium.com)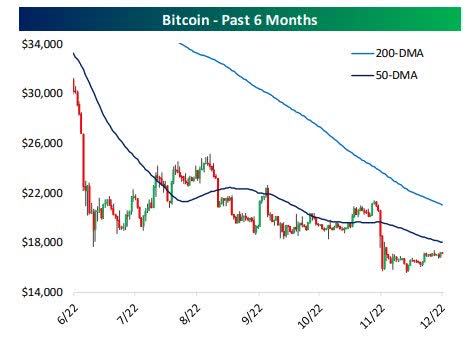
Since crypto came to prominence beginning roughly in 2017, there have only been a handful of other periods with the same sort of lack of volatility: late 2019, the summer and fall of 2020, and in October of this year
I am short Bitcoin using the Inverse ETF (BITI).
Final thoughts
We are now in the home stretch of the race to the end of the year. The turn of the calendar really shouldn’t mean much in terms of investment decisions. Every year we see the same ‘exercise’ where portfolio decisions are made simply for optics or to “play” the tax game. Portfolio managers jettison the losers, so that are not seen as holding them while buying other momentum names for no other reason than that they have outperformed recently and owning them will make them look “smart”. Then there is the retail crowd that will also play the tax scene in an attempt to minimize taxes by realizing losses, then buying back the position next year.
My focus at the moment is finishing the year strong and holding onto my gains. So this end-of-year window dressing and housekeeping can offer both landmines and opportunities. I still believe with so many stocks down big this year we are likely to get more end-of-year selling than usual. At the same time, though, a lot of managers are badly underperforming this year and so will not be afraid to chase any signs of strength in an attempt to make up some of that ground. That implies further volatility until year-end.
The market absorbed all of the headlines this week and for that matter has absorbed plenty of headlines in the last 6 months. While we have seen plenty of UPS and DOWNS, at 3852 the S&P is at the same level it was in mid May. The BULLS will tell us that is a pretty impressive performance given all of the negativity.
The BEARS will counter with, “that is great”, but in the interim, the index put in a lower low keeping the BEAR trend in place. In general, that sums up what has taken place and probably what is going to take place in the near term. Strong momentum stocks in BULL trends will continue to get us through this period. Everything else is a BIG question mark.
Finally, avoid the “toe the line” rhetoric that is detrimental to the health of your portfolio.
Postscript
Please allow me to take a moment and remind all of the readers of an important issue. I provide investment advice to clients and members of my marketplace service. Each week I strive to provide an investment backdrop that helps investors make their own decisions. In these types of forums, readers bring a host of situations and variables to the table when visiting these articles. Therefore it is impossible to pinpoint what may be right for each situation.
In different circumstances, I can determine each client’s situation/requirements and discuss issues with them when needed. That is impossible for readers of these articles. Therefore I will attempt to help form an opinion without crossing the line into specific advice. Please keep that in mind when forming your investment strategy.
THANKS to all of the readers that contribute to this forum to make these articles a better experience for everyone.
Best of Luck to Everyone!
Be the first to comment