

gguy44/iStock via Getty Images
Concern over higher interest rates was compounded last week by news that the Fed intends to reduce the size of its $9 trillion balance sheet (quantitative tightening) more rapidly than expected. The 2-year Treasury yield, which reflects the market’s expectation for short-term rates, has already soared from 0.5% to 2.5% this year. That move momentarily inverted the yield curve whereby the 2-year yield rose above the 10-year yield, stoking recession fears. Apprehension about the Fed selling bonds held on its balance sheet drove the 10-year yield to a new pandemic-era high of 2.71% on Friday. The good news is that the yield curve is steepening again, which should mitigate recession fears. The bad news is that rising long-term interest rates puts further downward pressure on the valuation of stocks. In particular, it weighs most heavily on the valuation of the most expensive growth stocks, which is why the Nasdaq Composite was the worst performing of the major market averages last week.
edwardjones.com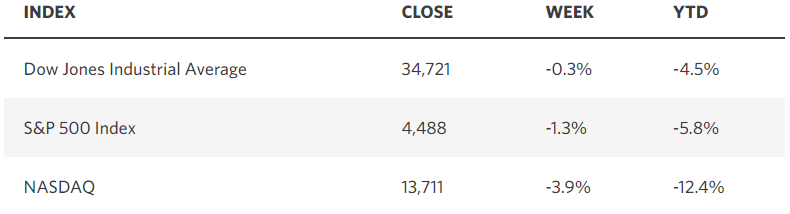
If we look at the percentage increase in interest rates this year from the short to the long end of the curve, the Fed has accomplished a tremendous amount of tightening already by merely communicating its intentions to do so, while having only increased the federal funds rate by 25 basis points. That has depressed the value of technology stocks more than any other sector, which in turn weighs on the broad market, as the six largest tech behemoths account for approximately 25% of the value of the S&P 500 index. This gradual rotation out of growth stocks will continue until long-term rates stabilize. Meanwhile, it provides plenty of fodder for those who are forecasting an end to the current economic and market cycle, as though it were the year 2000.
bloomberg.com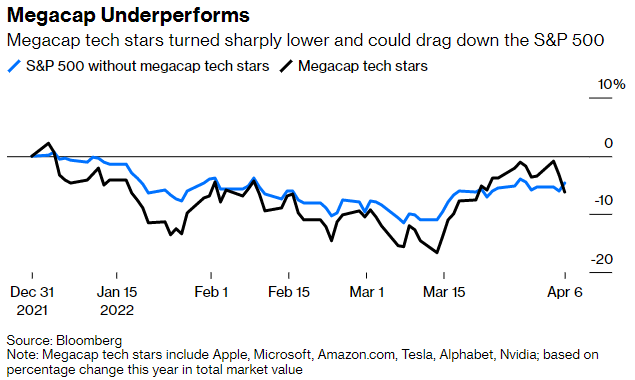
In addition to the dismal year-to-date performance (-12.4%) for the technology sector, bears point to decade-low levels of consumer confidence as a canary in the economic coal mine. They say a recession is coming because inflation is at a 40-year high, the Fed is aggressively tightening monetary policy to choke off the price increases, and higher interest rates combined with the draining of liquidity from the financial system will result in significantly lower valuations for stocks and bonds. If a bear market does not cause a recession, then the recession will cause a bear market.
Making matters worse is the fact that May through October has historically been the worst performing six-month period of the year. Additionally, when that six-month period falls in advance of the midterms during the first term of a Democratic president it is the worst of the worst of those periods, according to the Stock Trader’s Almanac. That said, the worst six month stretch is followed by one of the best. Randall Forsyth pointed out in Barron’s this week that going back to 1926 the November through April period that falls into the third year of a presidential term returned an average of 13.9% for the S&P 500 and an even better 19.2% for small caps. Therefore, how do we navigate the next six months?
If we were trading at all-time highs in January, I would have to join the bears and suggest “sell in May and go away” as a prudent strategy, but we have already had a 13% correction in the S&P 500 and bear market declines in the Nasdaq Composite and Russell 2000. Those valuations adjustments are the result of an 8% inflation rate, expectations for another 200 basis points of short-term rate increases, the war in Ukraine, and up to $95 billion per month in quantitative tightening. As a result, we are more likely to see continued churn in the stock market as investors rotate from growth to value with limited upside over the next six months, unless we start to see a lessening of these headwinds, which I think is likely.
The University of Michigan’s latest survey of consumer sentiment was abysmal. As a contrarian indicator, that is exactly where investors want to see it. Again, it is reflecting what has happened rather than what will happen, which is why its worst levels coincide with recessions and market bottoms. What is different today is that the pessimism is entirely due to inflation, which tells me we are very close to the peak rate. As the annualized rate of inflation declines throughout the year, we should see consumer sentiment improve, and this headwind will become a tailwind.
umich.edu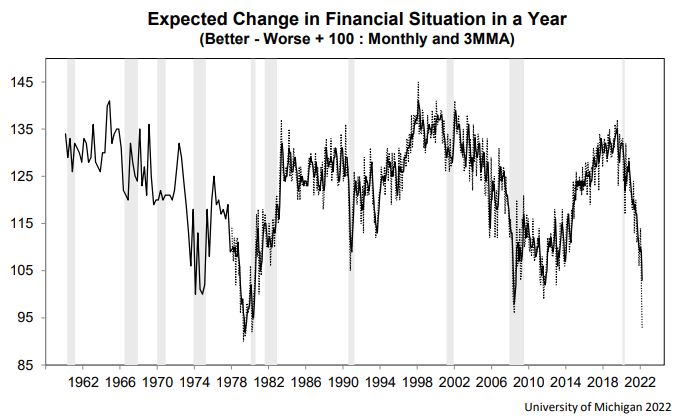
Yet consumer actions are running counter to attitudes because spending is still at record levels. Bank of America indicated last week that its credit and debit card spending rose year-over-year by 11% in March. While higher prices are clearly part of the increase, they do not account for all of it, which means volume is still rising despite inflation. That’s good news for the economy, especially if we are near the peak rate of inflation. Consumers paid down credit card balances during the pandemic with stimulus checks, and total outstanding debt remains below pre-pandemic highs. Consumers are again using credit, which speaks to their confidence in the labor market and better than 5% growth in wages. The chances of recession in this environment are remote.
datatrekresearch.com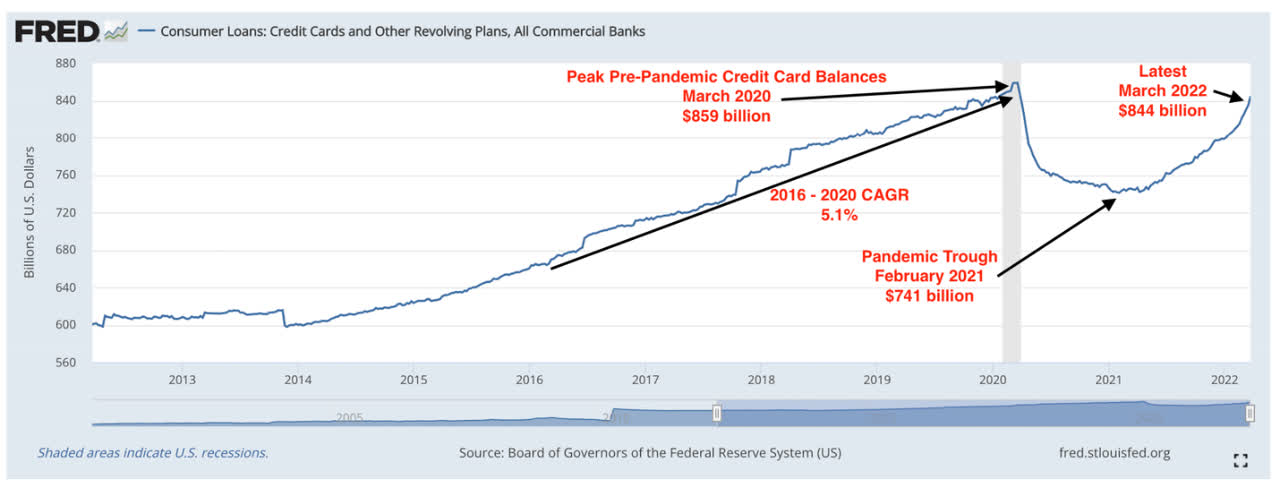
Of all the headwinds outstanding, my greatest concern is over the Fed’s intention to reduce the size of its balance sheet by $95 billion per month, which is nearly double the peak monthly amount that occurred during the 2017-2019 quantitative tightening (QT) program. The Fed’s asset purchases added liquidity to financial markets when the pandemic struck and the economy shutdown. That liquidity served as high octane fuel for financial asset prices. It is like a tub of water that is gradually being filled to the top with water, and all of the boats floating on the surface rise with the water level. Every action has an equal and opposite reaction, which means that when the water is slowly drained from the tub, the boats should sink to varying degrees with the water level. As we have seen so far this year, the most expensive boats should sink the most, but the bottom line is that all financial assets will be competing for a gradually shrinking pool of liquidity. That makes quality and value paramount when selecting securities. The good news is that the Fed has the experience from 2017 to 2019 in executing this program, so it knows what to expect.
edwardjones.com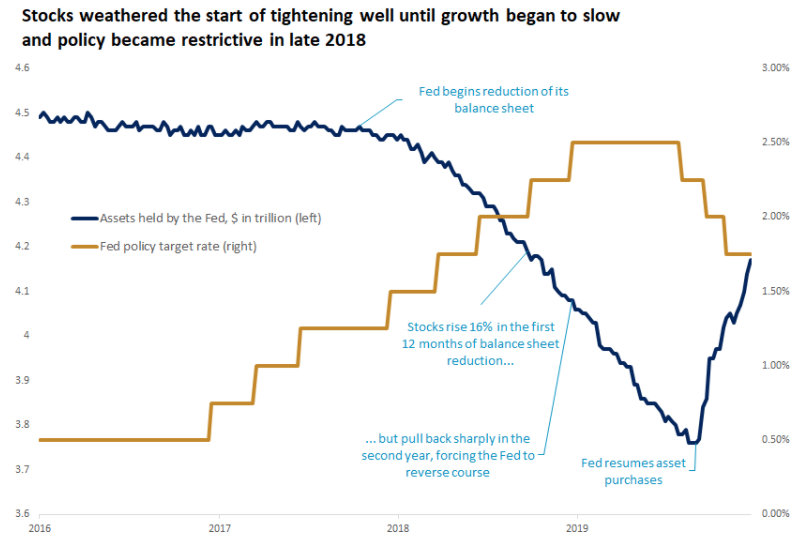
The Fed had been increasing short-term rates for a year before it started to shrink its balance sheet in 2017, and the S&P 500 rose 16% during the following 12-months of quantitative tightening, while the 10-year yield rose from 2.3% to 3%. It was not until the 10-year rose to 3.25% and the rate of economic growth slowed to less than 2% that the S&P 500 dropped 19%, forcing the Fed to reverse course.
The economy was not as strong then as it is today, but we were not confronted with the highest rate of inflation in 40 years. Still, I believe the economy and markets can absorb a higher 10-year yield than they could in 2018 before it slows the economy to the point that the S&P 500 suffers another bear market. That number is closer to 3.5%. I also see the rate of inflation peaking and waning sooner than the consensus expects. As a result, market expectations for rate hikes in 2022 are probably too aggressive. I will be recalculating my numbers on Tuesday with the Consumer Price Index report for March.
In conclusion, there is no need to sell in May, but it is prudent to be selective as financial assets reprice to adjust to a monetary policy tightening cycle that comes with higher interest rates and a rate of inflation that settles in a range of 3-4% over the coming 12-18 months. The economy should grow 2-3% this year. Since stocks and bonds will be competing for liquidity, it is also sensible to focus on quality and value, while avoiding speculative and expensive assets. I still expect the S&P 500 to finish the year with modest gains, but volatility with remain elevated as rotation between sectors and asset classes continues.
Economic Data
Tuesday’s inflation report for March will be the most market moving of this week’s economic indicators, but I will also be focused on the retail sales for confirmation that consumers are spending beyond price increases.
marketwatch.com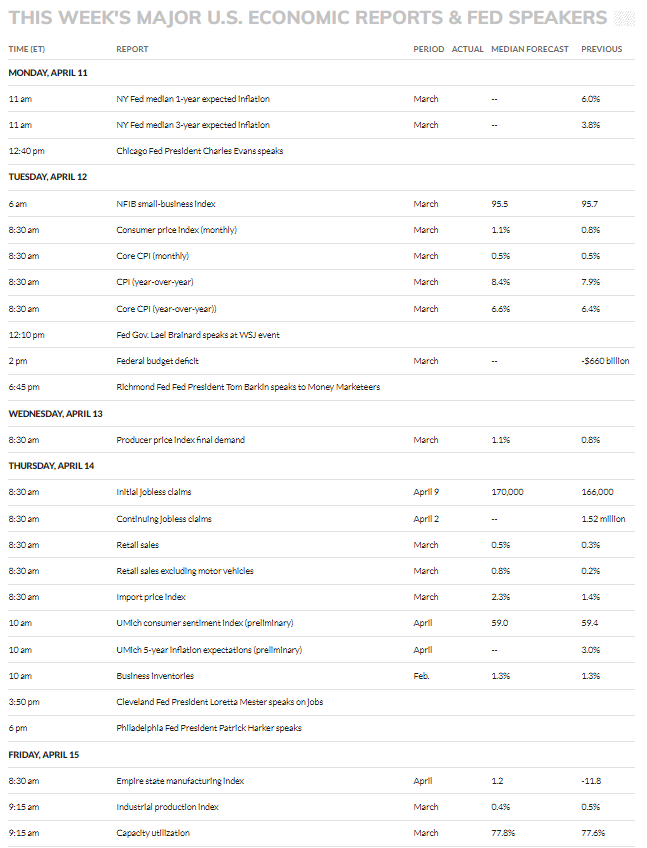
Technical Picture
The most important event on the technical front is crude oil falling below $100 per barrel last week, as well as below its 50-day moving average. Concerns about economic growth in China and the release of barrels from the strategic petroleum reserve may be the reason for the decline, but nonetheless, it is a positive development on the inflation front moving forward.
stockcharts.com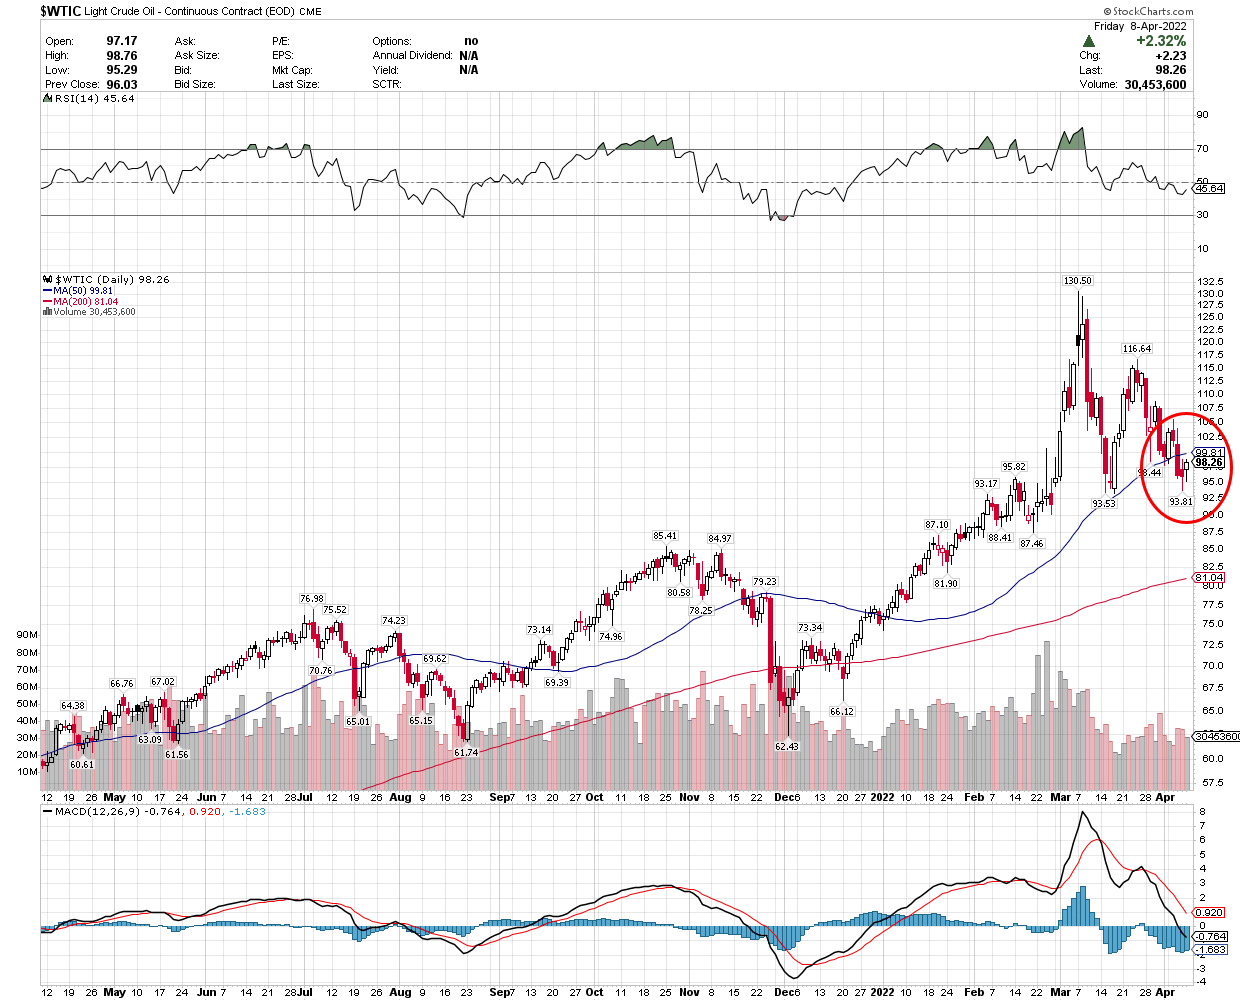
Be the first to comment