

sqback
Introduction
Is it just me, or does time fly? We’re already in the second half of the last month of 2022. This means it’s time to look into 2023. One of the topics we discussed most in 2022 is agriculture. What started with a demand-driven bullish thesis in 2020 quickly turned into a red-hot agriculture bull market with severe supply issues. In this article, I will give you my outlook for the next year. We’ll cover tight commodity supply, fertilizer prices, farm financials, and several stocks that I either own or have on my watchlist.
So far, it looks like the surge in crop prices is not transitory. Demand is expected to remain high, while supply is unlikely to rebound. High fertilizer prices, increasing export demand, and droughts are just three reasons that will provide us with more food inflation going forward. Moreover, as farmers are getting squeezed by higher prices, it’s important to assess how this might impact the situation.
Now, without further ado, let me guide you through my outlook, my thoughts, and my investment picks.
What To Expect In 2023
Razor-thin supply/demand margins
I believe that I have mentioned it a few times, but it’s hard to find a place to start when discussing agriculture. Agriculture might be one of the most complex macro themes on the planet. It is impacted by endless factors like weather, energy prices, population growth, economic growth, energy demand, wars, supply chains, and so much more.
Essentially, investors need to keep an eye on all of these factors when trading agriculture commodities or companies operating in agriculture industries.
Why? Because the difference between agriculture demand and supply is razor-thin. Any disruptions to supply (demand is often way more predictable as it grows with the global population) are likely to cause steep spikes in key commodities.
For example, the chart below shows the price of CBOT corn (black). Corn – like many other agriculture commodities – tends to remain range bound. Agriculture commodities, more often than not, trade with a very narrow margin above production costs.
Hence, when input costs suddenly start to rise, we often witness surges in crop prices as well. That’s why I added the price of Brent oil to the chart below (orange).
TradingView (CBOT Corn, ICE Brent)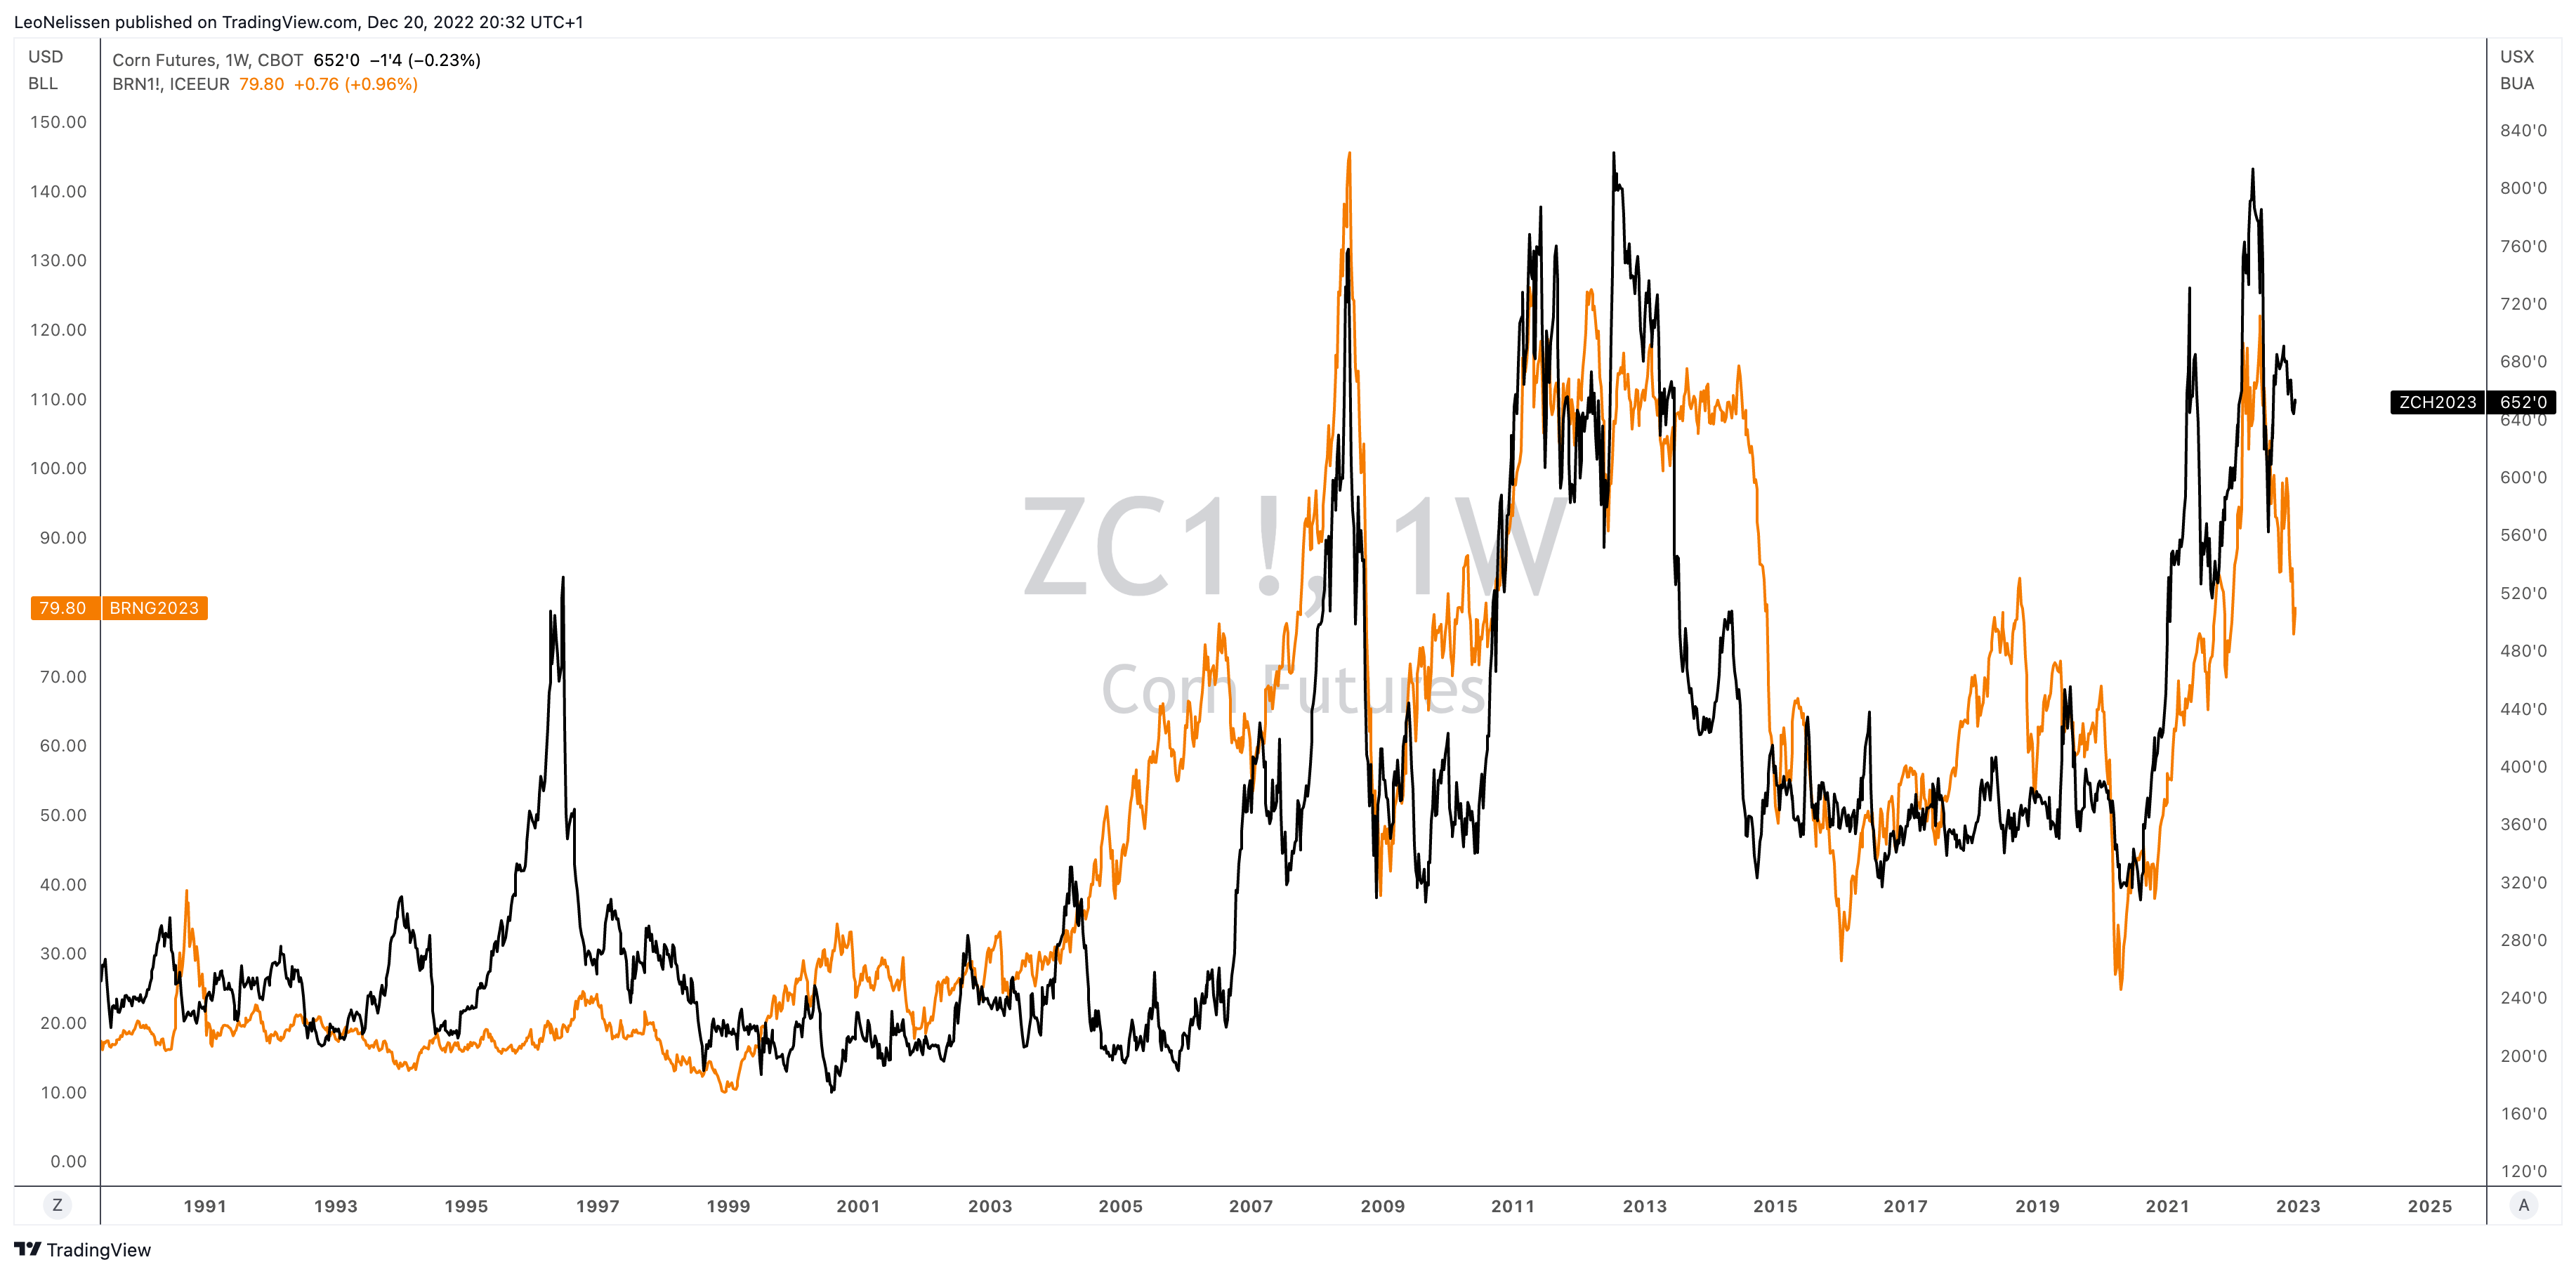
It also needs to be said that crops like soybeans and corn are needed for ethanol and renewable diesel. Roughly 40% of the corn crop and 25% of the soybean crop are used for biofuels.
Add to this that corn and soybeans account for a total of 70% of planted acres in the United States. Hence, it is no surprise that energy markets have become so important.
The worst part is that all of this happens in a situation where the difference between supply and demand is already extremely tight. Looking at the chart below, we see that global wheat demand has been higher than supply for three straight years. Needless to say, that’s terrible!
CME Group
As I wrote in a recent article (and others before that), the OECD estimates that agriculture supply growth will be 1.1% per year for the foreseeable future (2030 outlook).
The worst part is that demand is expected to grow by 1.4% per year due to global population growth, which offsets any declines caused by lifestyle changes (like people becoming vegetarians or vegans).
Before we dive into opportunities that arise from these developments, there’s more that needs to be discussed.
Earlier this month, I wrote an article on fertilizer companies. It was (and still is) one of the hottest and most important agriculture topics of 2022. Everyone talked about it after Russian forces set foot in Ukraine.
Fertilizers are important because they are a major driver of crop growth. Using corn as an example, the US plants roughly 90 million acres of corn. That number has been more or less unchanged since 1926. However, during this period, the global population grew by 4x.
This must mean that farmers are more efficient. Right?
That’s true. In 1929, farmers produced roughly 20 bushels of corn per acre. Then, after the war, that number rose to 40 (which is already impressive). Fast forward 80 years, and we’re dealing with a yield of almost 180 bushels per acre.
Purdue University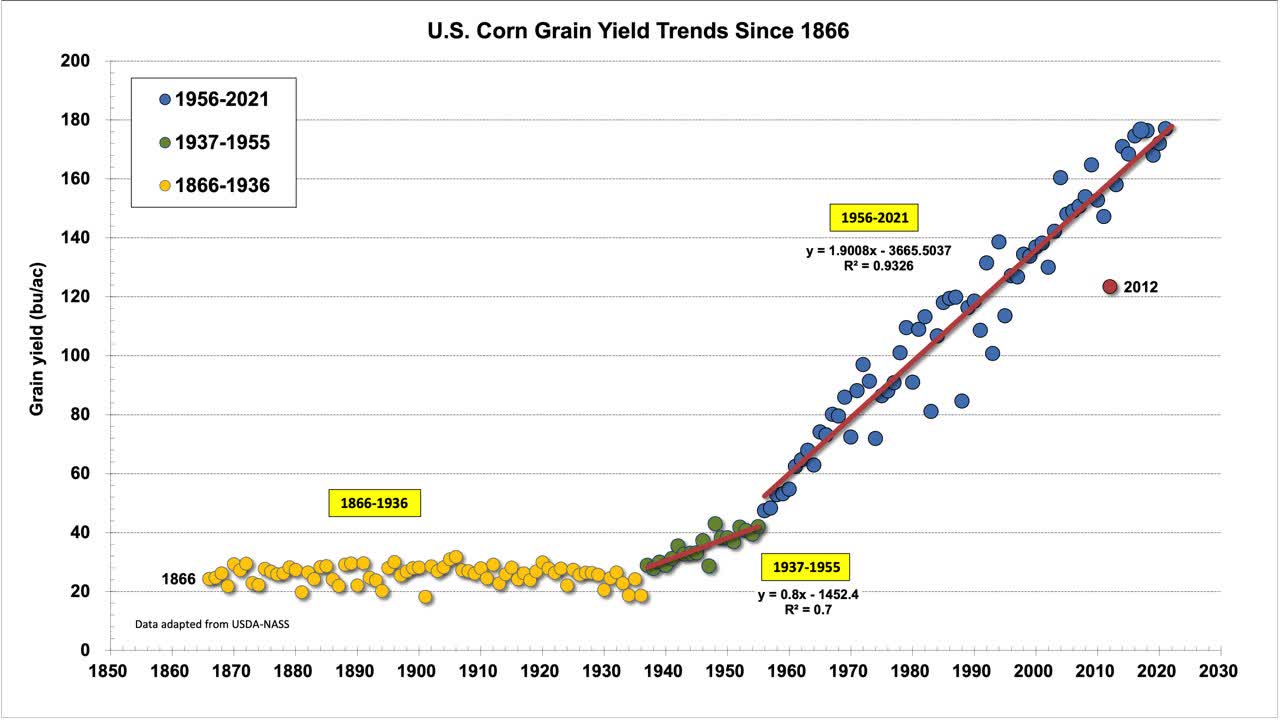
Earlier this year, Goehring & Rozencwajg wrote a terrific paper on risks in agriculture. They highlighted difficulties in modeling expected crop yields due to the influence of so many factors. After all, drivers of higher yields include fertilizers, GMO crops (better seeds and bigger plants), and precision farming techniques.
However, they were able to use machine learning to research the impact of fertilizers (in this case, nitrogen).
Their findings are nothing short of impressive:
[…] we estimate that as much as 40% of coarse grain yield increase since 1961 can be attributed to increased nitrogen application.
Moreover:
We believe that a 5% reduction in nitrogen application could result in an immediate 1 to 2% reduction in global grain supply. Given the existing tightness, such a drop will have an outsized impact on supply-demand balances going into the 2022-2023 planting season.
Now, you know why the stakes are so high in agriculture when it comes to protecting supply growth at all costs.
Expect Crop Prices To Remain Strong – The Bull Case Isn’t over
CoBank, is one of America’s largest cooperative banks, serving vital industries across rural America. This includes loans, leases, export financing, and everything related to agriculture.
As part of their service, they present a full-year 2023 outlook covering everything impacting agriculture. And, as we already discussed, that’s a lot.
One of the issues the company raised is the pressure on farm margins. I get that a lot from talking to farmers, reading reports, and watching farmer vlogs on YouTube like this one, which explained the impact rising fertilizer prices have on farmers.
Youtube (aTrippyFarmer) – Explaining The Impact Of High Natural Gas Prices On Fertilizer Prices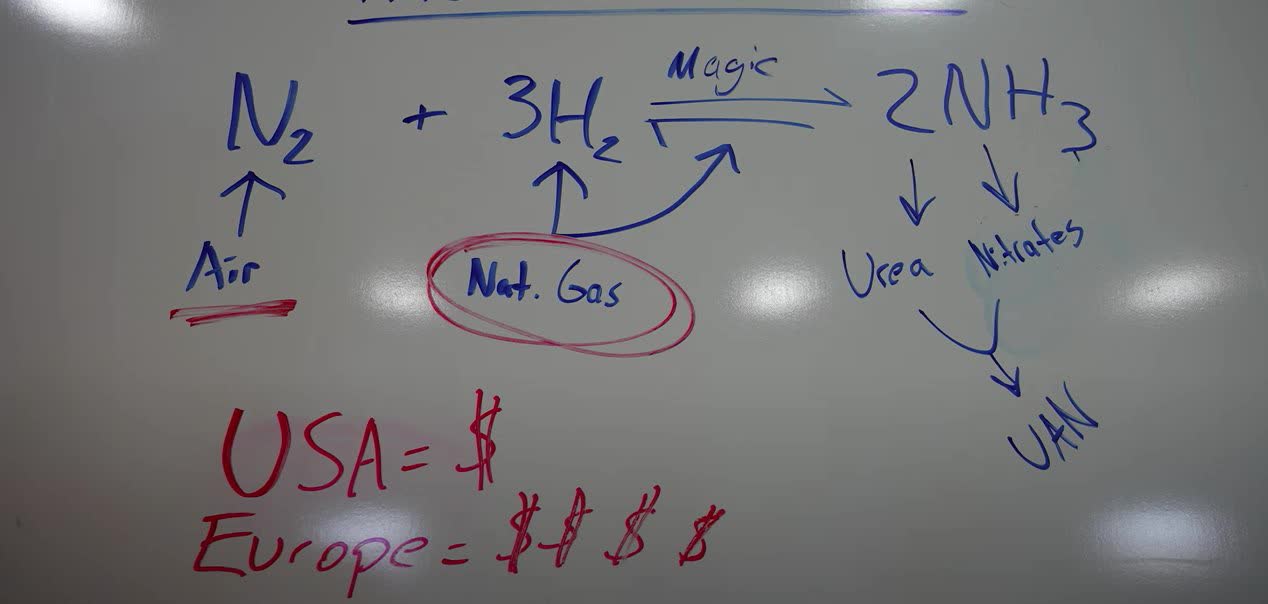
So far, farmers have done rather well as farm earnings have accelerated. Yet, that could now come to a halt.
CoBank believes that a mix of skyrocketing production costs, steeply higher interest rates, an elevated dollar, and weakening domestic and export demand caused by declining real incomes amid spiraling inflation will be factors to watch.
Farm income has been on a tear. In 2019, farm income was $80 billion. That number has almost doubled as a result of higher crop prices, high export demand, high energy prices, and a lot of other interrelated factors. Note that not even the initial surge (explosion) in fertilizer prices was able to keep income from rising in 2022.
CoBank
There is a high risk that farm income is going to remain close to $140 billion as we are at a point where it is harder for revenues to offset operating expenses.
Add to this that crop yields might come under pressure. Not only from lower fertilizer application (to cut costs) but also from droughts. The National Weather Service’s Climate Prediction Center estimates there’s a 50% chance of another dry growing season due to La Nina weather conditions.
For example, in the last harvest, weather conditions caused Brazil’s soybean crop to come in 10% smaller. Now, add to this that the country is reducing fertilizer application, and we get a recipe for very tight supplies in 2023.
Bloomberg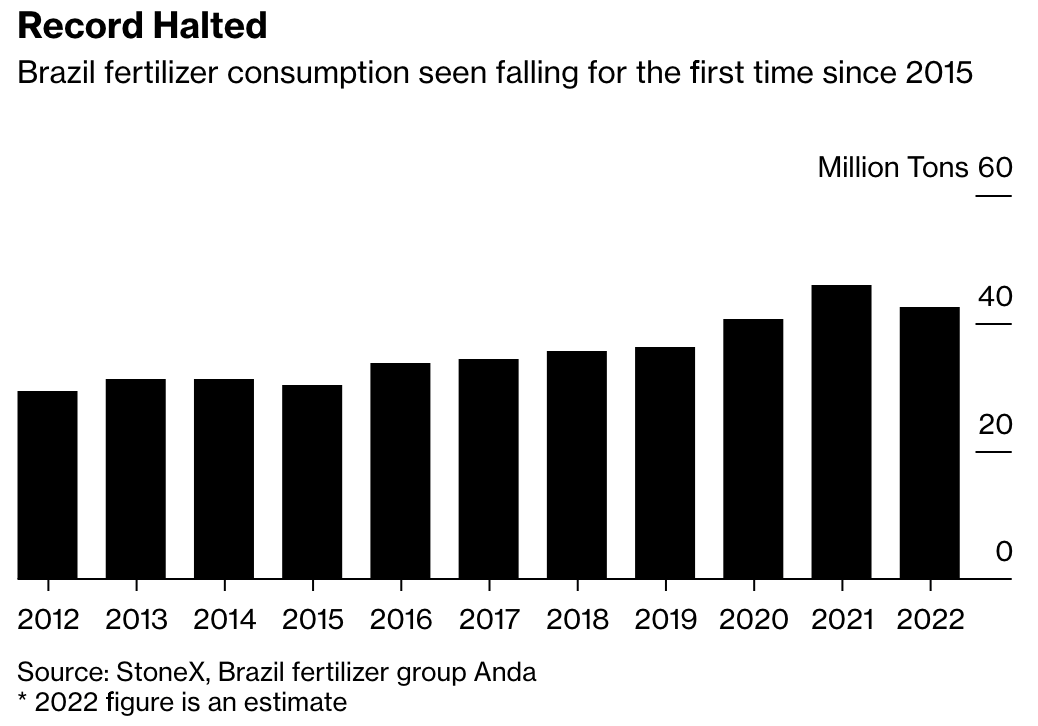
CoBank – like many other market participants – is also focused on China. Geopolitical tensions like an invasion of Taiwan would have a major impact on crop prices as it would disrupt demand and supply chains.
However, I would rule out any of these tensions in the years ahead. If anything, the reopening of the Chinese economy will spur demand for crops and meats (both are related), as well as energy commodities (including corn).
In light of these developments, there’s a silver lining (for farmers). Global grain and oilseed supplies are extremely tight. Going into 2023, the world coarse grains stock/use ratio has been in a downtrend for six years. While the ratio is still elevated, it needs to be said that China’s massive agriculture inventories are a reason why this ratio looks better than it is. After all, China’s supplies are strategic. There’s zero chance they will flood the global market to relieve tight supply.
CME Group
The latest WASDE report confirms my worries. Below, we see an overview of the three key crops that I cannot stop talking about: corn, soybeans, and wheat. We see that total use is declining in all three of them. That’s not good for farmers. Lower export demand is a big driver of this decline.
While I expect that to become a tailwind in the years ahead, there’s something else going on. Production is down. Despite lower demand, ending stocks still fell in all three cases. The stock-to-use ratio of all crops declined as yields and planted areas declined. That’s very bullish as I do not expect production to rebound in a meaningful way. Meanwhile, demand is expected to remain strong (and improve further, if you ask me).
University of Illinois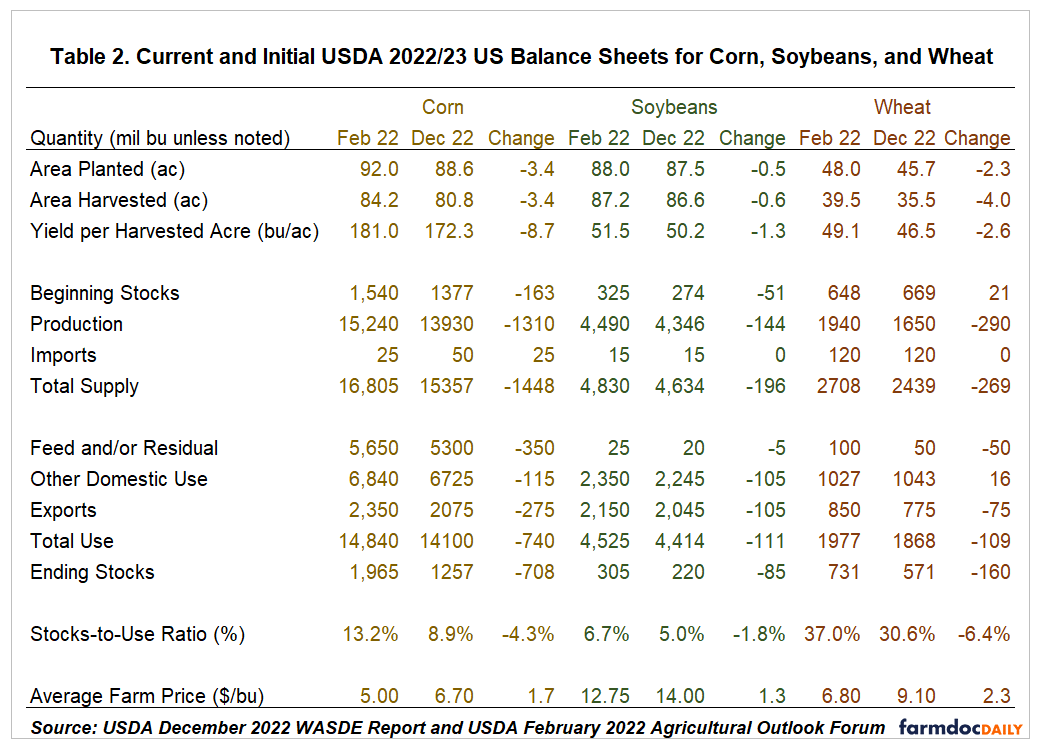
This is what the visualization of supply looks like. It’s truly worrying given the demand outlook.
CoBank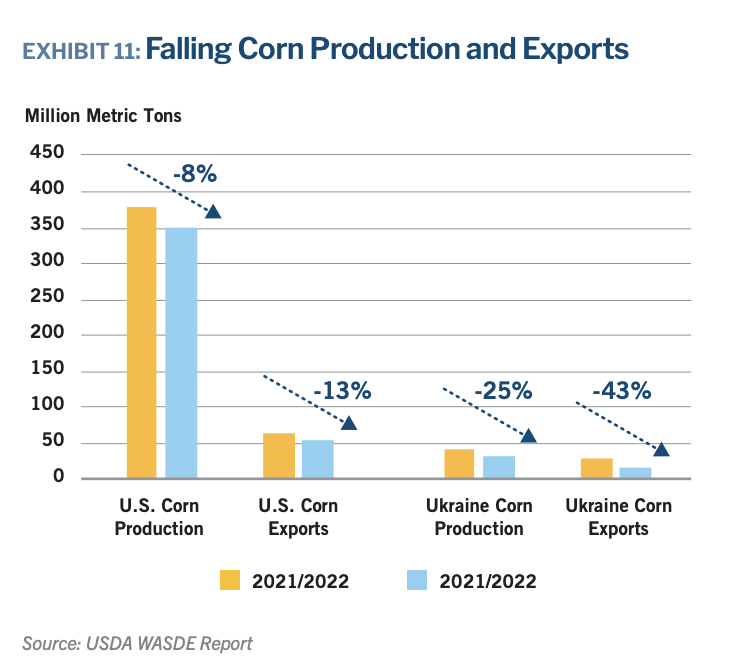
With all of this in mind, this is what CoBank wrote:
The combined global ending stocks of corn, wheat, and soybeans are forecast to decline for the fifth straight year in 2022/2023. For the 2023 harvest, the futures market is currently offering what would historically be considered very strong prices. But when accounting for all the line item production cost increases, profitability pencils out near breakeven, at best.
What Does The Chicago Fed Think?
In light of these comments and discussions, I found a great report published by the Chicago Fed. The Chicago Fed operates in the seventh district, which covers more than 40% of United States corn, soybean, and hog production. Needless to say, that’s a big deal.
Federal Reserve Bank of Chicago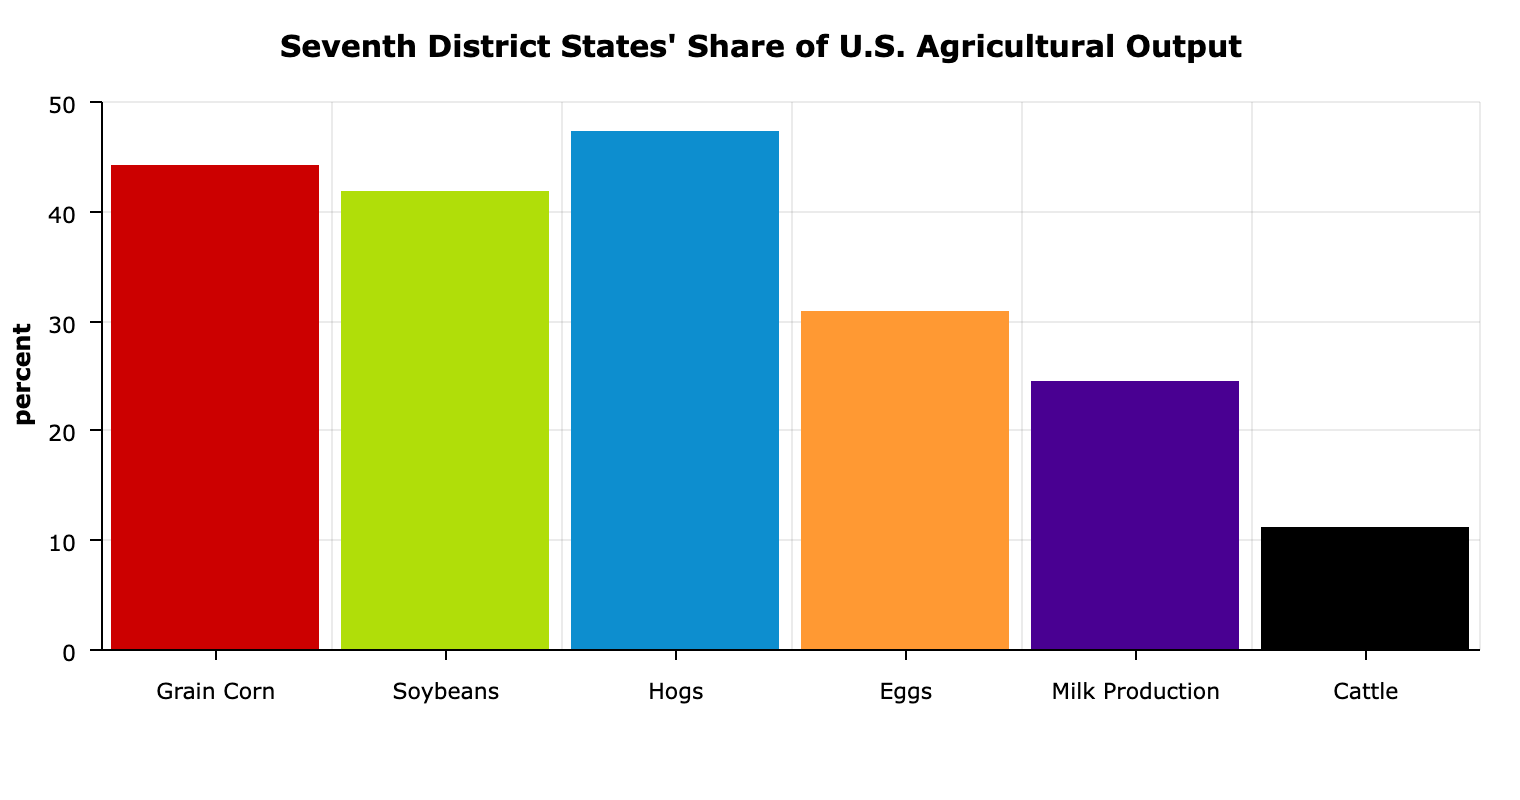
Not only that but a lot of Chicago Fed comments can be combined with other things I wanted to share with you anyway.
For example, this is what the bank said about farmers’ margins and farmland values:
It’s a period where farm production is strong. The input costs have been up pretty dramatically as well. So that’s creating a bit of pressure on the margins for agricultural producers. And it’s a period where the momentum of increases in farmland values has been maintained, even if there’s a slight trailing off from the very fast rates of increase that we’ve seen in the past year.
The chart below shows Iowa farmland prices. Nominal values are up 17%. Adjusted for inflation, prices are up 8.6%. This happens despite rapidly rising interest rates. It shows two things. First, farmers will have to pay a pretty penny to get access to new farmland. Second, investors desperately want farmland. We can debate why that is, but I am sure the market knows how desperate the world is for agriculture supply – even if that means borrowing at higher costs to buy land.
University of Illinois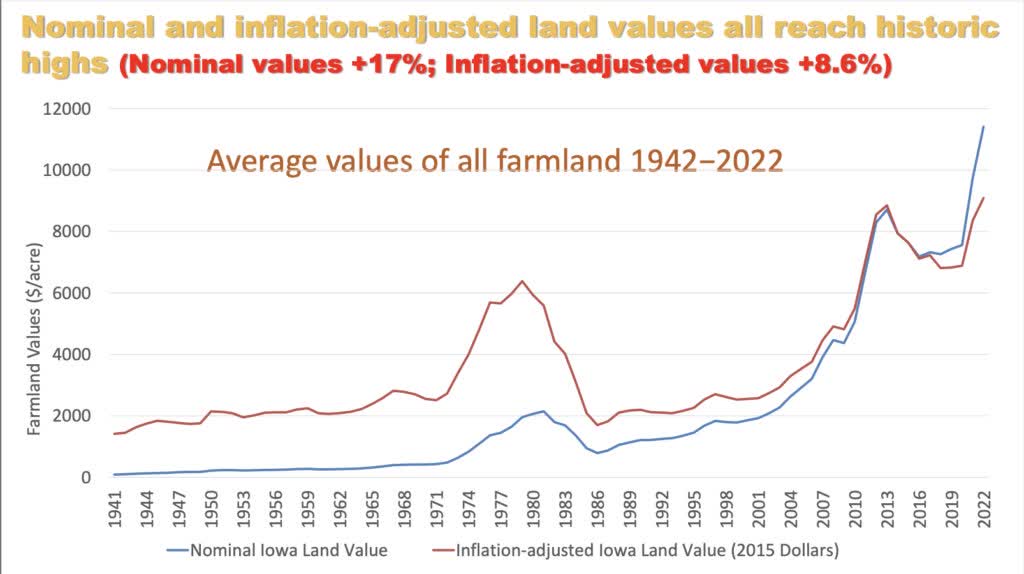
Moreover, farmers are doing well so far. As of 3Q22, we see that the quality of credit in the industry has gone up!
Federal Reserve Bank of Kansas City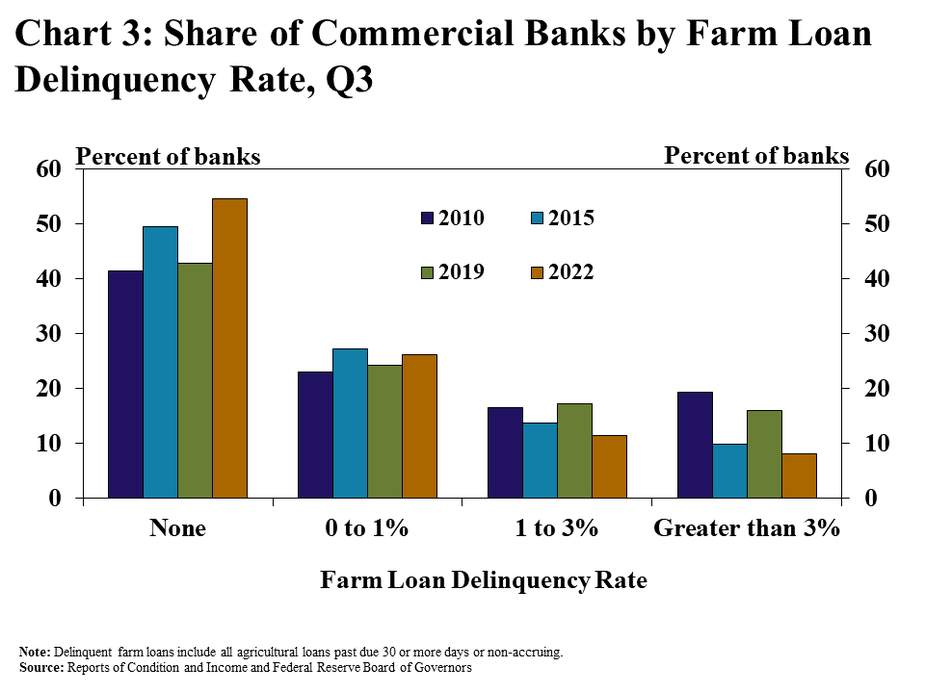
Furthermore, the Chicago Fed sees robust export demand despite the strong dollar.
Both factors, of course, are playing a role, but it seems like other, bigger factors are overwhelming them. In the past year, anyway, we had a record for the fiscal year in ag exports from the United States. So the dollar has not pushed down exports. They maybe could have been even higher if the dollar were not so strong, but certainly there’s demand for our products. And part of that probably comes back to the fact that Ukraine had been constrained in how much they were able to export.
I believe these comments are important as I don’t see a major demand decline. There is no way export demand weakens unless a strong recession ends up crushing energy demand and people’s ability to afford basic food items (for example, reducing meat consumption because of personal finances).
The Bottom Line
I am a big believer in a continuation of the agriculture bull case. However, it won’t be a straight-line uptrend for crops, fertilizers, and the companies operating in the industry.
I believe that we’re in a new era for commodities. This includes energy, metals, and agricultural commodities. I do not think that the sudden upswing after 2020 will end in a sudden decline. I expect above-average prices on a long-term basis as supply growth is simply unable to meet demand.
Weather, lower fertilizer application rates, geopolitical tensions, and high operating costs will keep supply growth extremely subdued. Demand, on the other hand, will (more than likely) remain strong.
TradingView (CBOT Wheat)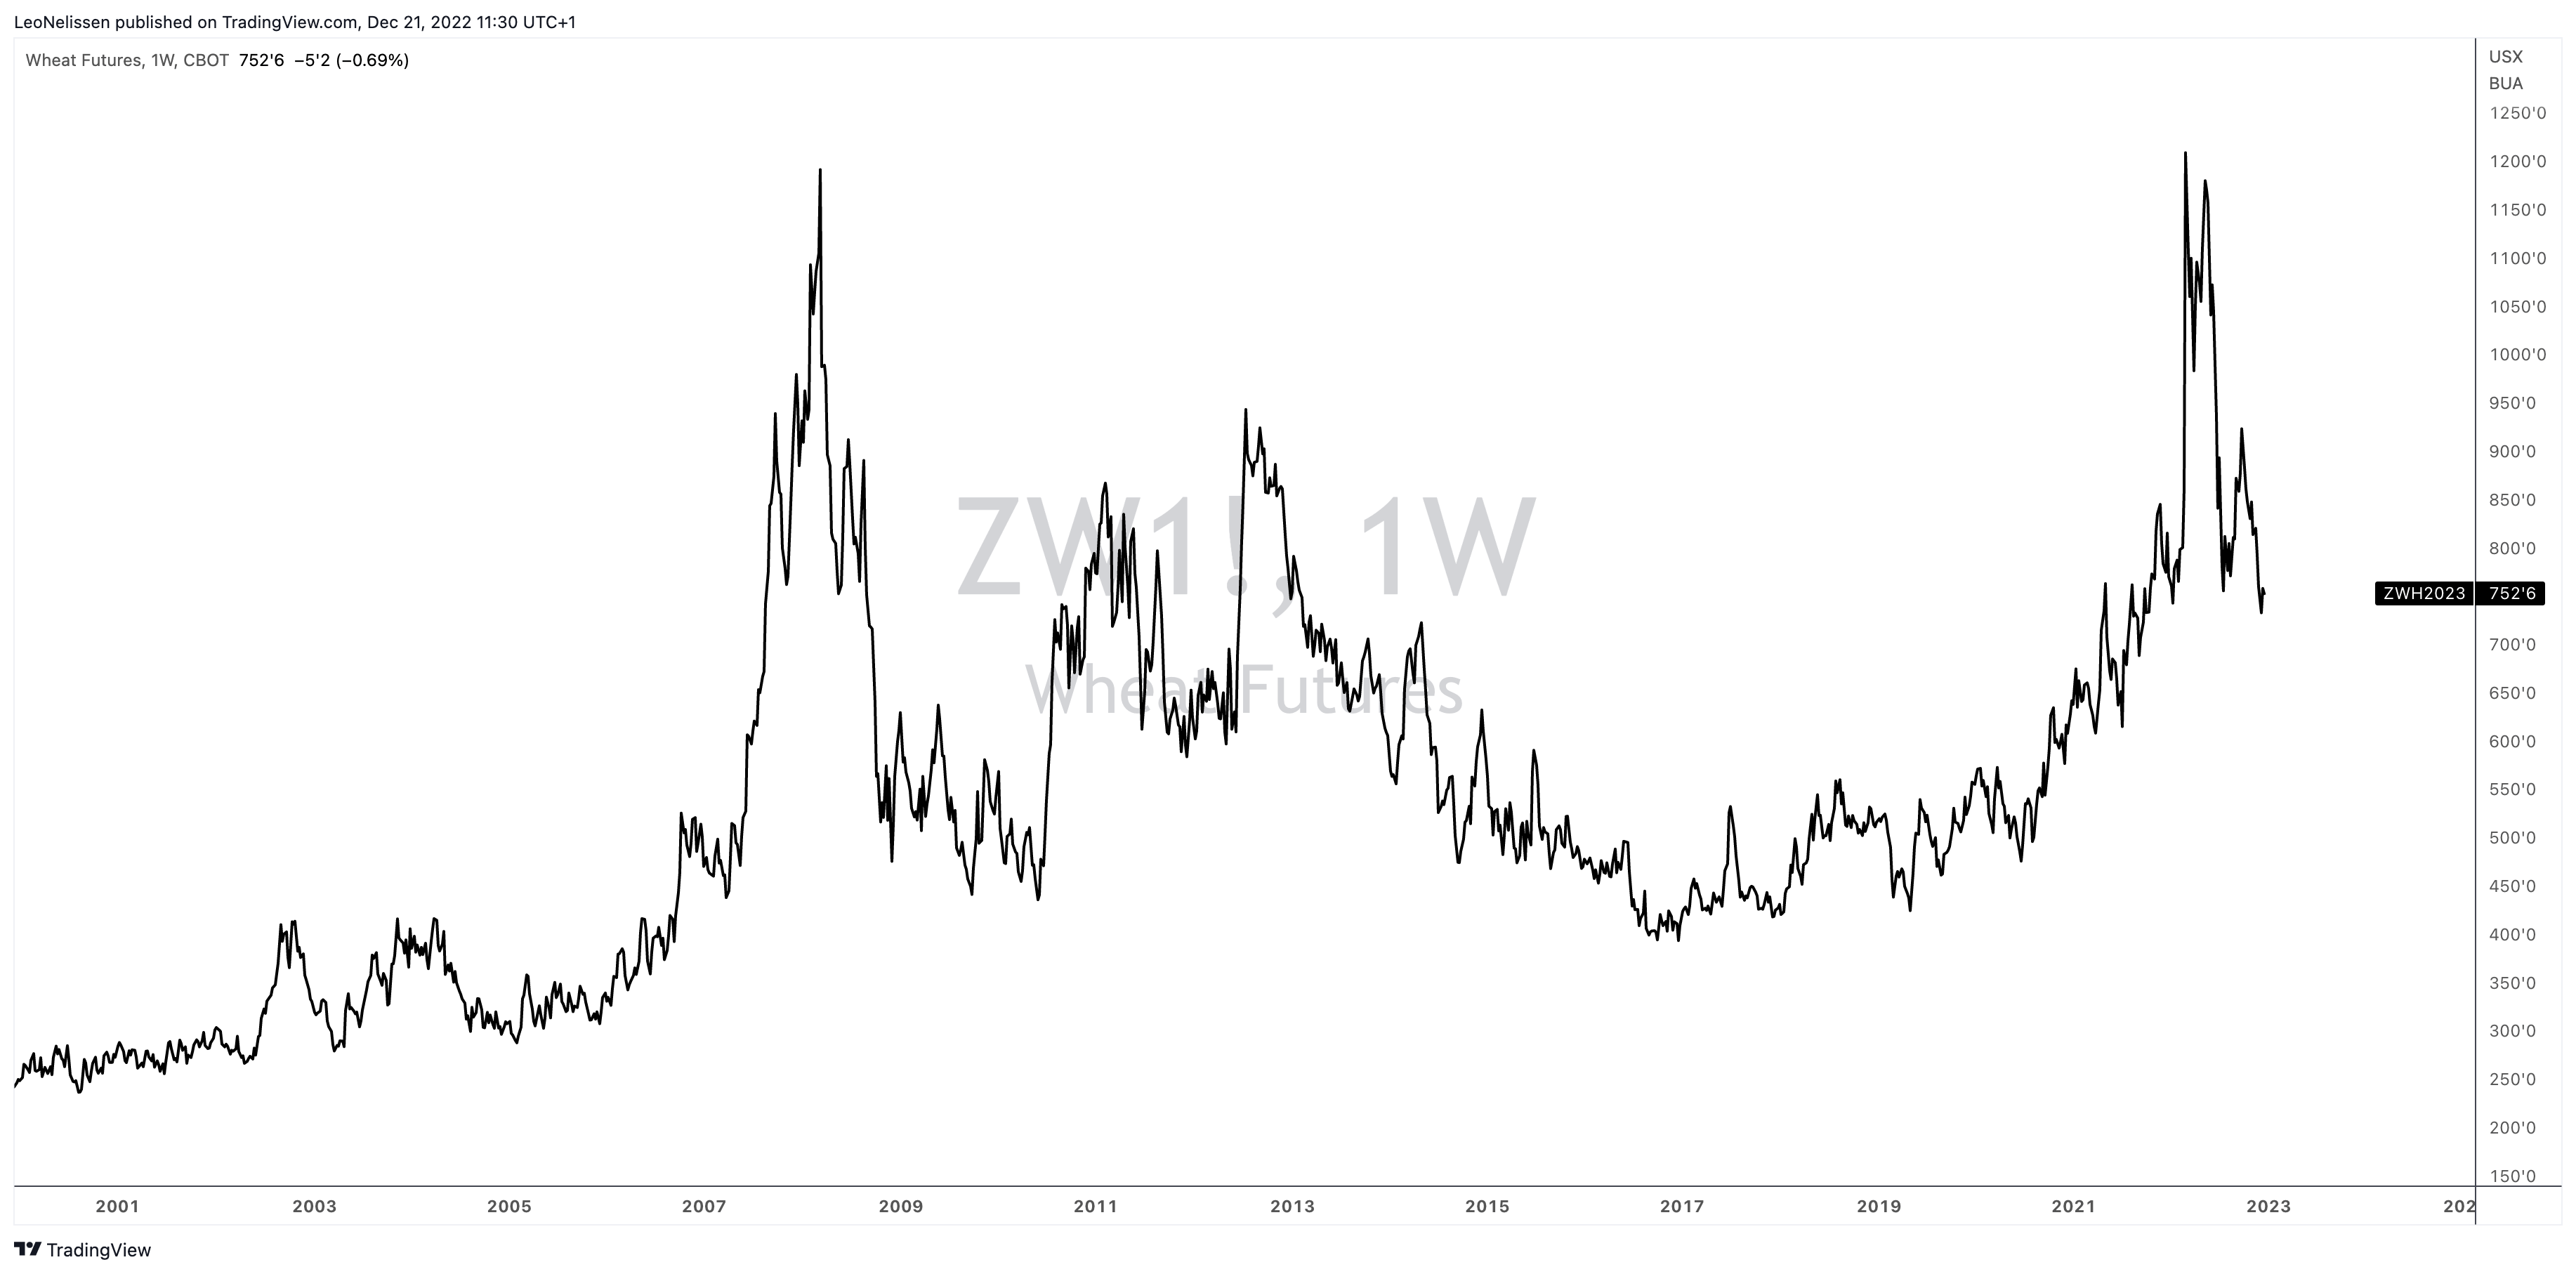
The major wild card here is a strong recession. A recession could temporarily reduce demand due to lower energy demand and lower consumption of more expensive food items like meats (highly crop-intensive).
That said, I remain bullish on agriculture stocks and will use weakness to expand my positions.
The Best Stocks To Watch/Trade/Invest In
Agriculture is volatile and very diverse. Agriculture includes (among others):
- Machinery companies producing and selling equipment
- Fertilizer producers
- Pesticides and related crop protection producers
- Trade & processing corporations
- Supply chain support (transportation)
- Financing (banks)
Hence, I’ll walk you through my watchlist, which will help you in your personal investment decisions. I will use links to my own and other Seeking Alpha articles to provide some more information for your research. After all, diving into every single stock would make this article way too long.
First of all, I own two long-term dividend stocks that are based on my goal to generate long-term wealth in agriculture.
My largest investment is in Deere & Company (DE). In November, I covered the company in great detail, explaining why I believe the stock has room to run to $600.
FINVIZ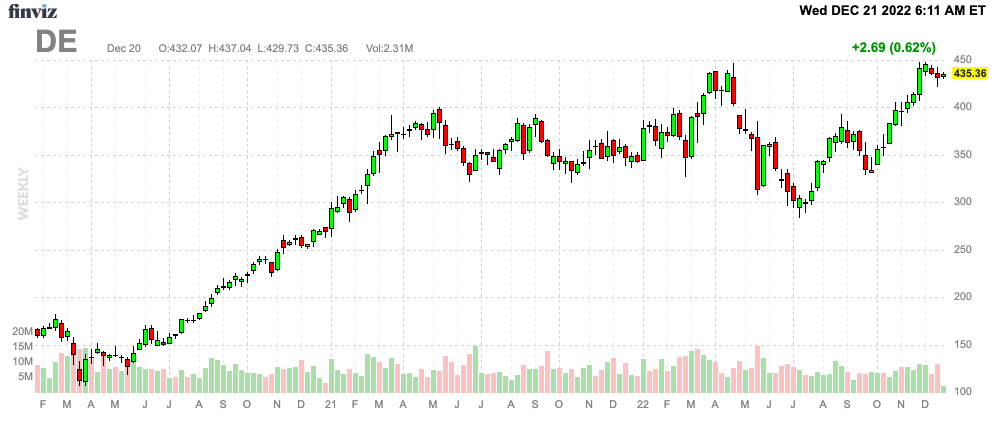
The company is blowing it out of the park as it benefits from rapidly rising farm income (see the farm income chart I used in this article). It allowed farmers to finally replace old equipment after many years of subdued crop prices.
Moreover, the company benefits from its next-gen equipment, which uses automation and related precision tools to increase yields when it matters most.
It also helps that Deere has tremendous pricing power. Especially in an environment of peaking operating expenses, the company is in a great position to maintain high earnings growth. Even if farm income slows, the company will benefit from a replacement cycle for many years to come.
Deere & Company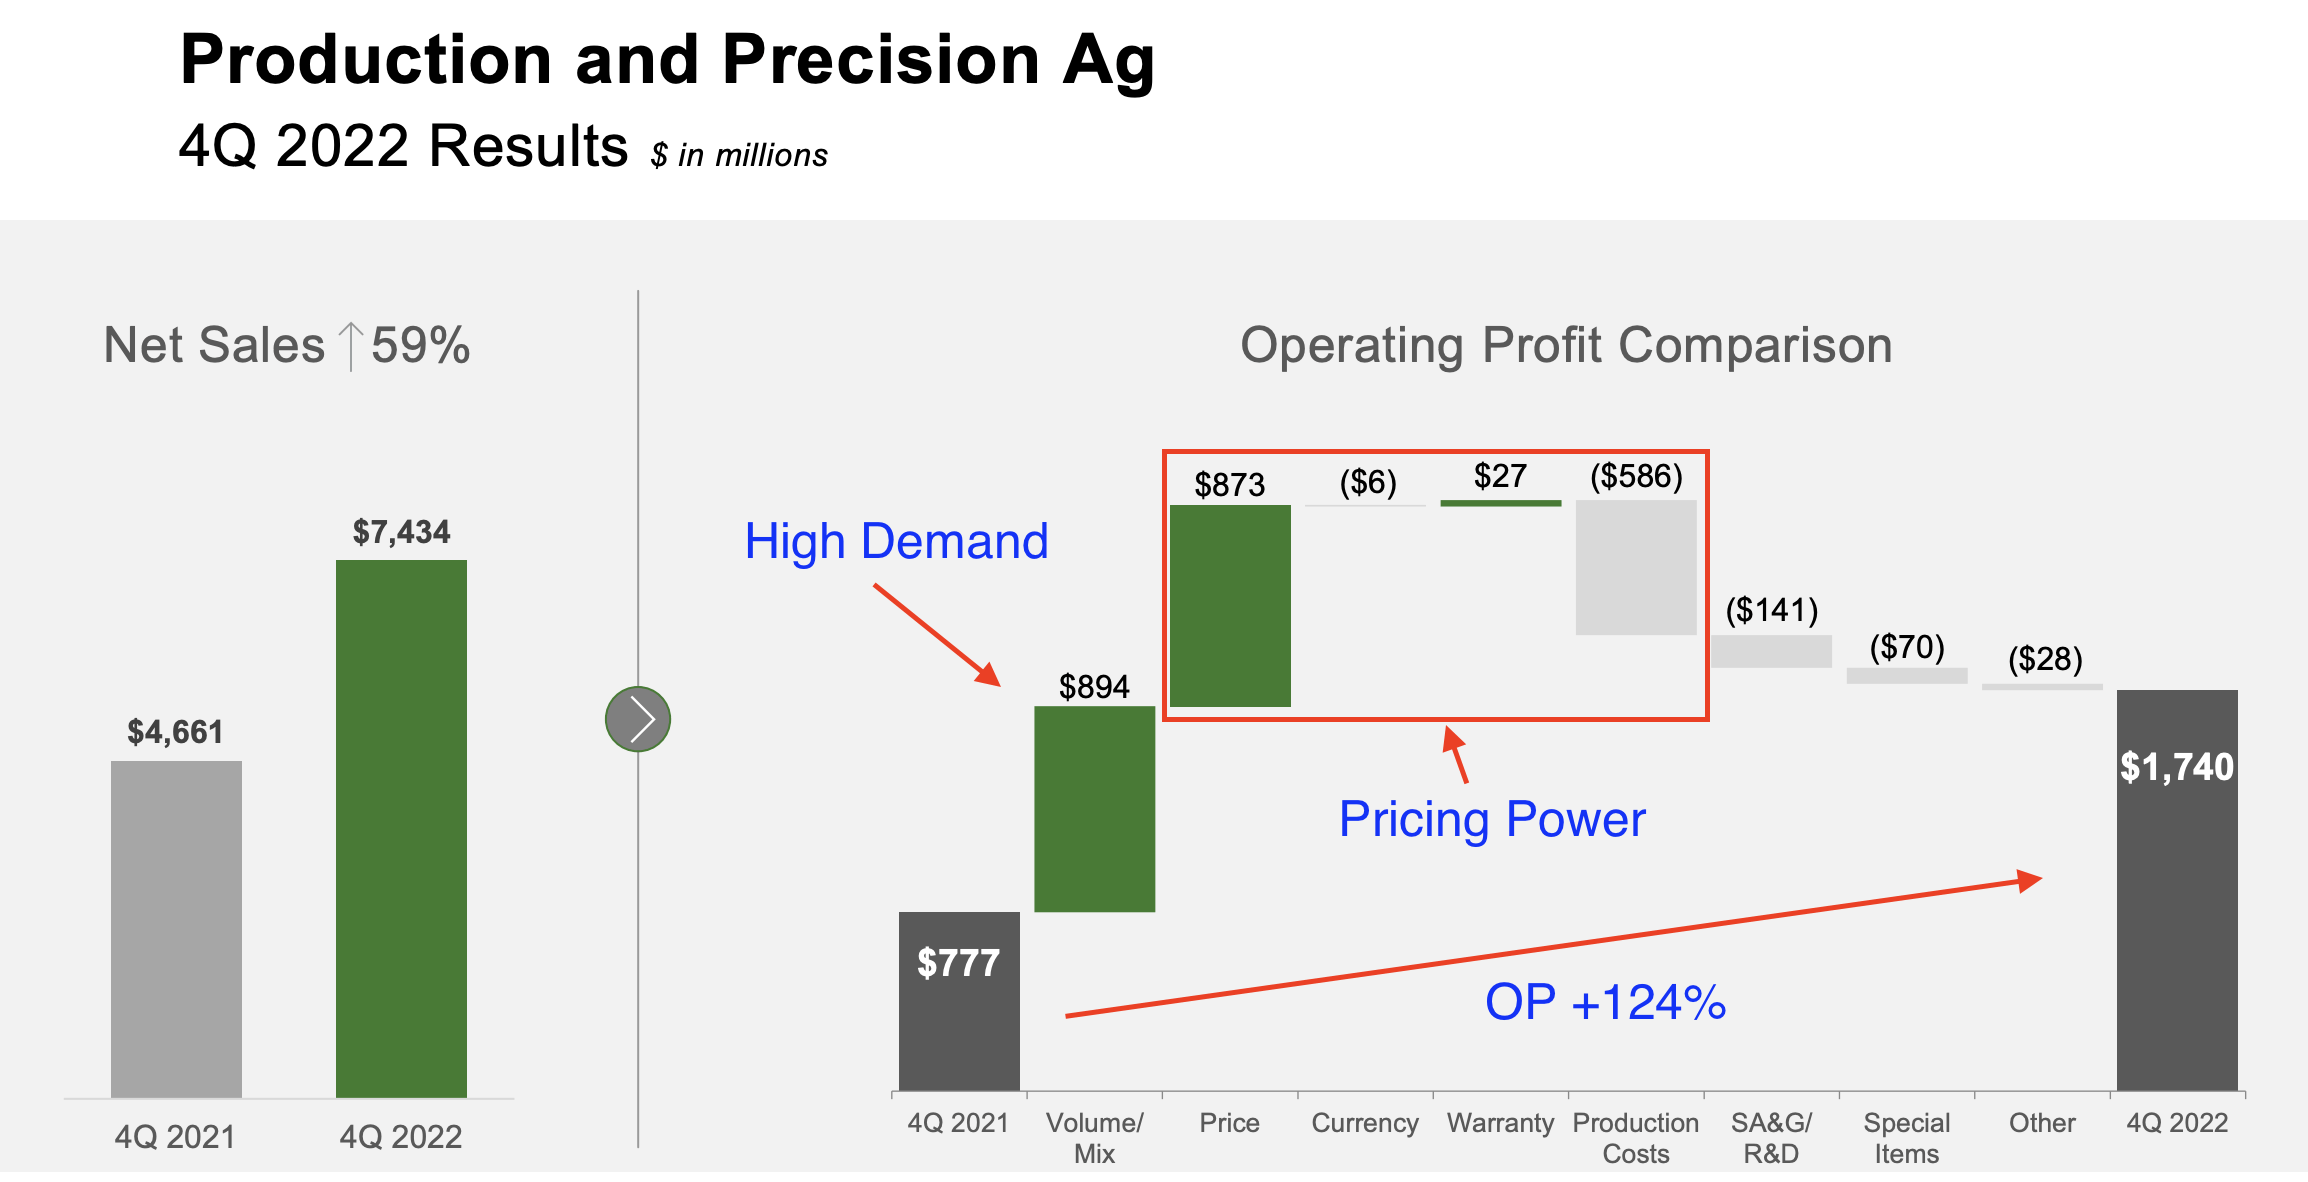
I believe that Deere is a great investment whenever corrections occur. I can imagine that recession fears will push the stock down 10-20% at some point in 2023 (that’s not unusual for Deere as it happened in 2022 as well).
Another stock in that area is the AGCO Corporation (AGCO). It’s the much smaller peer of Deere. However, it owns impressive and fast-growing brands like Fendt, which are gaining market share in key markets.
FINVIZ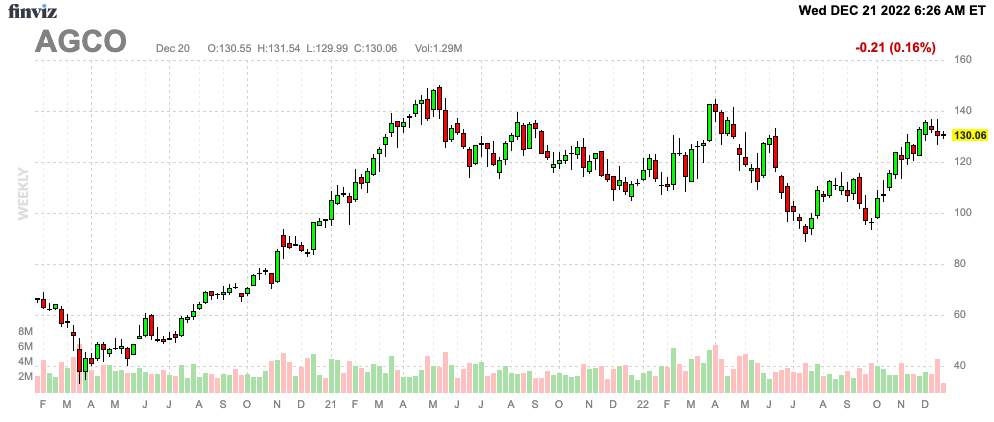
I would apply the same here. Buy on weakness. If we get lucky, we might be able to buy some at $100 before the long-term uptrend takes this stock to $200.
The second stock I own in my dividend growth portfolio is Canadian Pacific (CP), a Canadian railway with huge agriculture exposure.
FINVIZ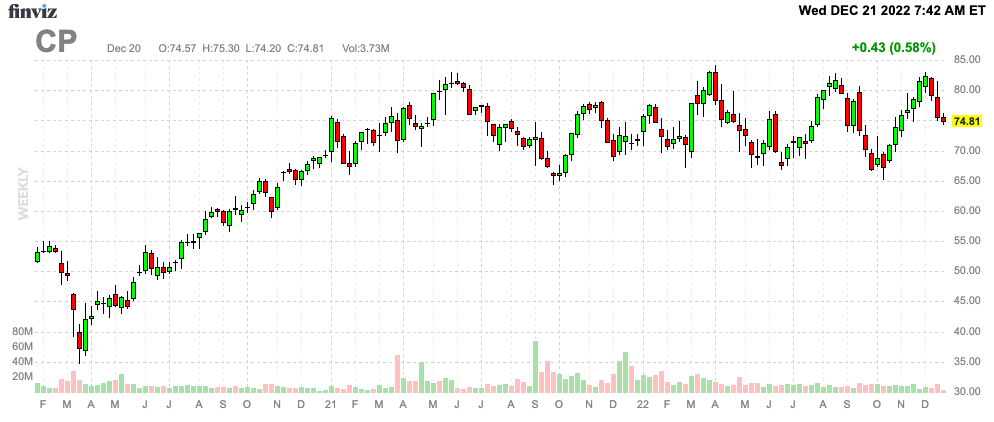
In 2022, almost a third of revenues came from agriculture shipments. Improving yields in Canada and high export demand are major drivers of profitability.
According to the company:
We saw this year’s grain harvest really start to begin the last couple of weeks of the quarter, and volumes have quickly now ramped up as we move into Q4. The most recent expectation for the Canadian grain crop size is around 75 million metric tons. This would make it a top-five all-time crop and about 7% better than the five-year average.
The timing could not be better as CP will receive the last of the 5,900 new high-capacity grain cars it ordered in 2018. These hoppers allow the average grain train to ship 15,000 tons of wheat, up from 10,400 when the company used smaller hoppers and shorter trains. Moreover, in 2017, the company serviced 12 8,500-foot capable grain elevators. This year, it could be 47. In 2024, that number is likely to be 55.
Going forward, the company will almost certainly be able to buy Kansas City Southern. This will lower agriculture exposure, yet grant the railroad access to export facilities in the South and Mexico.
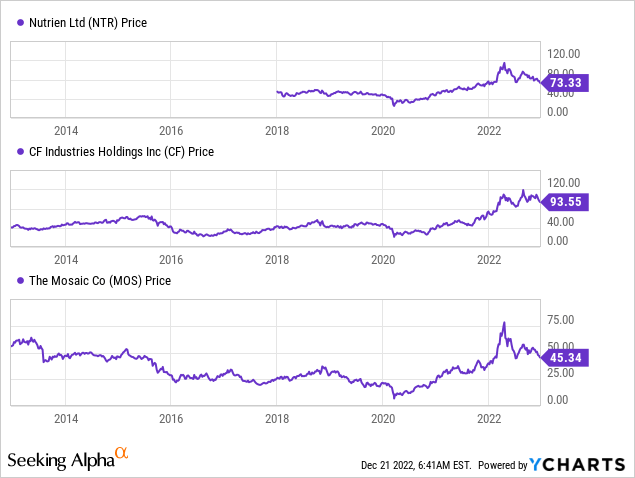
That said, I also continue to bet on fertilizer stocks. I remain bullish on CF Industries (CF), Mosaic (MOS), and their Canadian peer Nutrien (NTR).
Fertilizer companies in North America will continue to benefit from favorable energy price differentials (mainly natural gas) as shown in the slide below.
CF Industries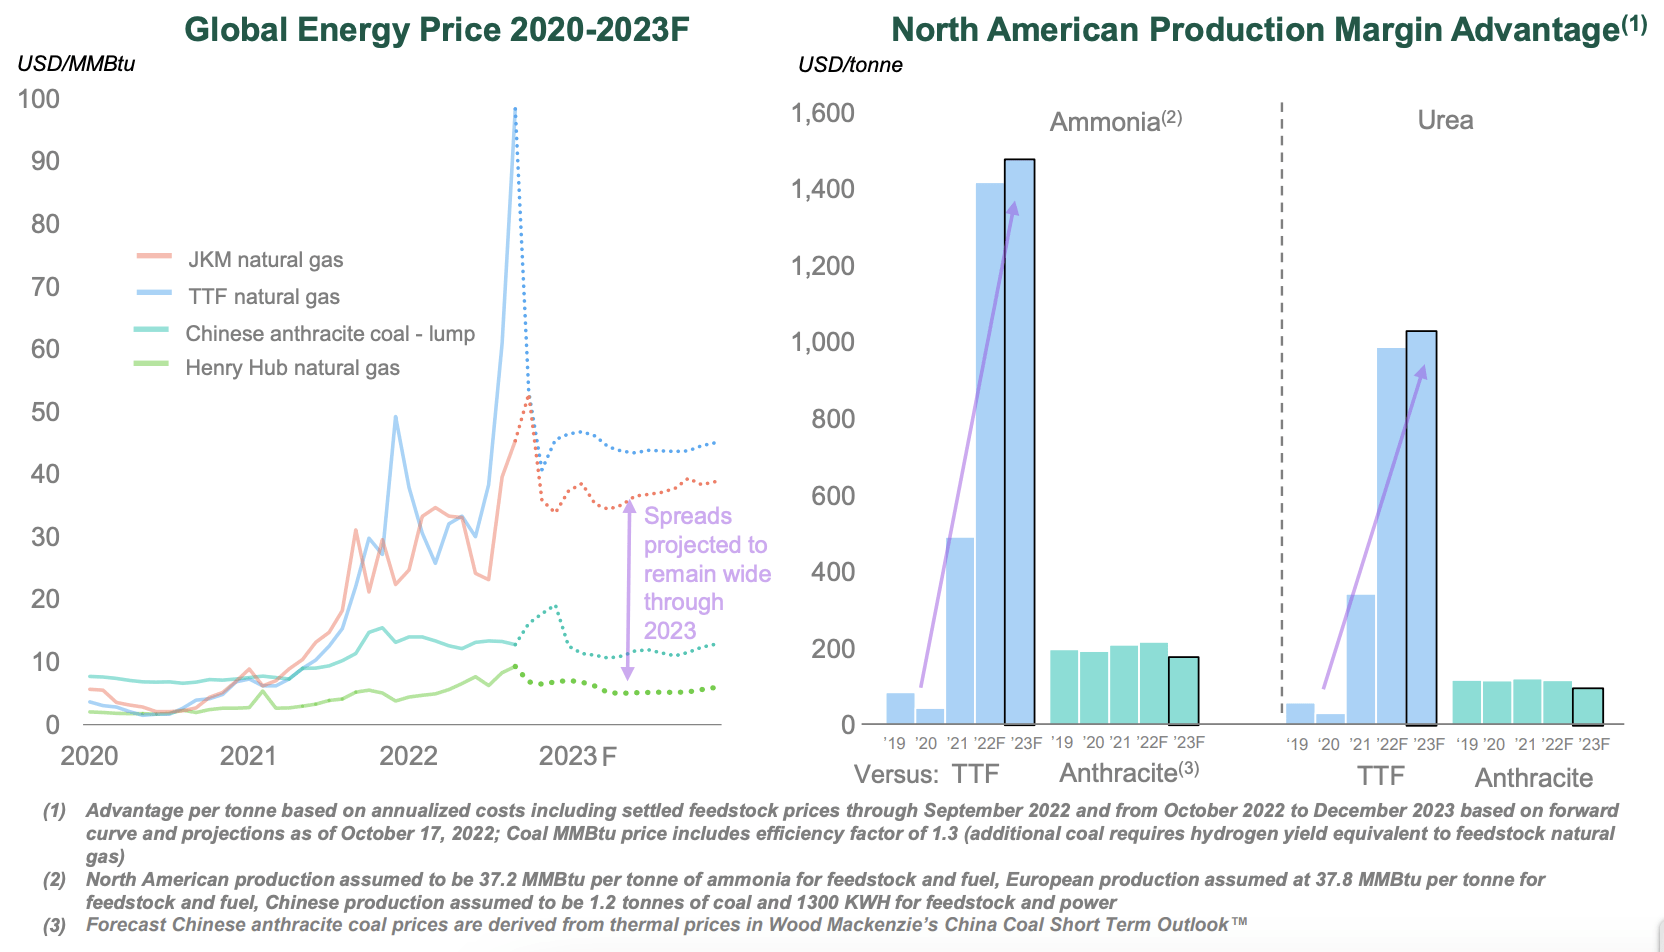
Here are some notes from CF Industries:
- Global nitrogen supply/demand balance to remain tight into 2025 due to agriculture-led demand and forward energy curves that point to persistently high energy prices in Europe and Asia.
- The need to replenish global grain stocks, which has supported high prices for corn, wheat, and canola, continues to drive global nitrogen demand.
- Global nitrogen supply availability remains constrained as high energy prices in Europe and Asia caused curtailments of ammonia production; an estimated 60% of European ammonia capacity did not operate in Q3 2022.
Similar comments were made by Mosaic – which is far less dependent on natural gas price differentials.
Still, Mosaic and fellow fertilizer producer Nutrien Ltd. see a strong market ahead. Last week, Nutrien Chief Executive Officer Ken Seitz warned of looming shortages in coming years, with supplies from Russia and Belarus constrained. Nutrien plans to ramp up its capacity 40% by 2025.
Mosaic’s peer Nutrien (NTR) expects that farmers will soon buy more aggressively.
Nutrien is seeing prepaid sales of fertilizer — where farmers will buy ahead to secure product — about 15% to 20% higher than in 2020. Seitz is expecting farmers who didn’t buy this year and have used all their stored product to jump into the market and send prices high again.
A more conservative play is Archer-Daniels-Midland (ADM). This company is better suited for dividend (growth) investors – just like Deere.
FINVIZ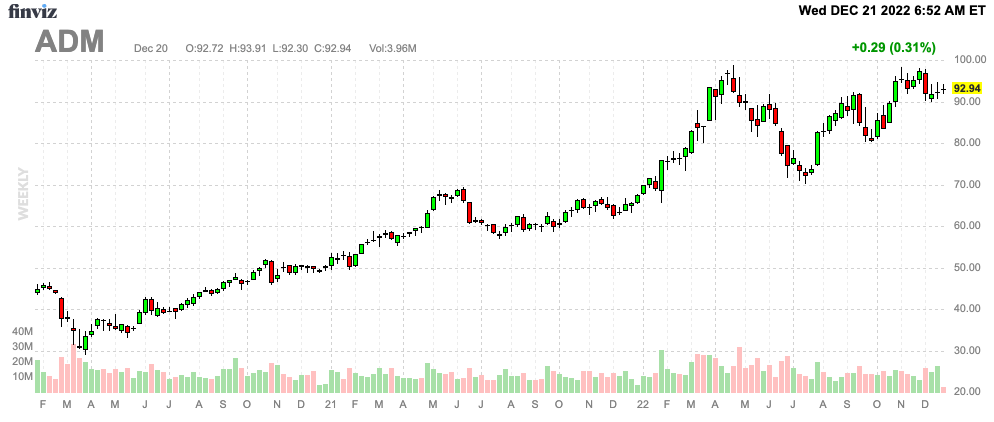
The company offers a wide variety of services, which include procurement and storage of grains, production of oilseeds and byproducts, and support services like transportation, exports, marketing, and others.
Archer-Daniels-Midland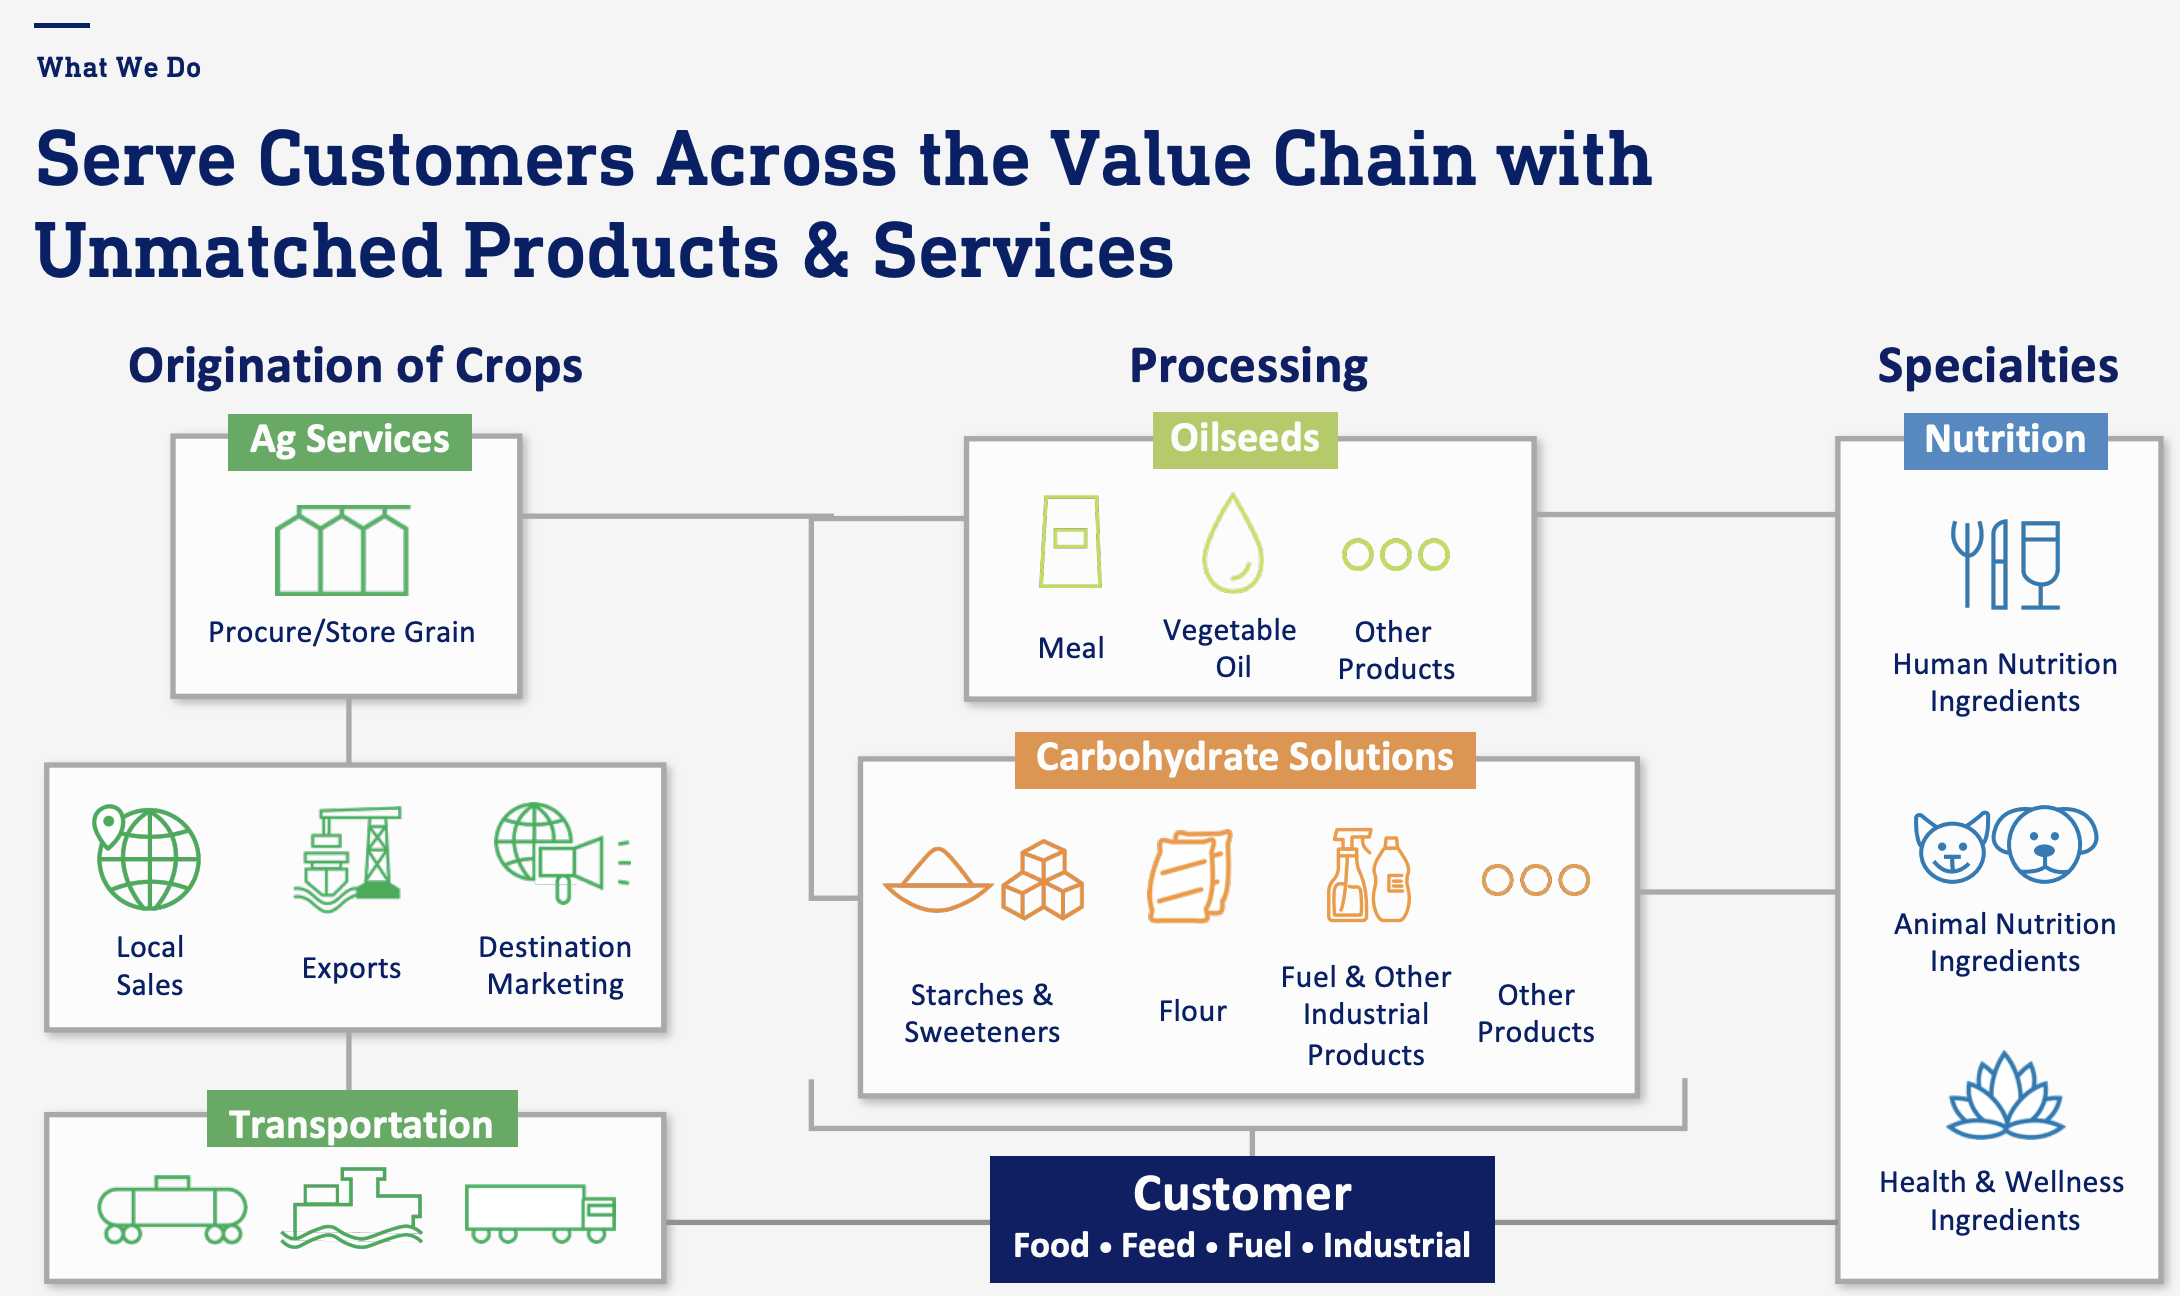
The company does not necessarily benefit from rising crop prices. What matters are crush margins and export demand for products and services.
With regard to the company’s outlook:
Looking ahead, there are several externalities that we are monitoring going into 2023. We anticipate ongoing resilient demand for our products, a strong crush margin environment, a positive outlook for starches and sweeteners, and a continuation of our growth trajectory in Nutrition. There is also significant uncertainty in the global economy and geopolitical environment. We expect to carry our strong momentum into the first quarter of 2023. And beyond that, we are confident that our scenario planning and execution will give us the ability to effectively manage through a dynamic environment.
A similar stock is Bunge Ltd. (BG), which has similar operations and a higher yield.
Then there’s another company I’ve liked for a long time. The Andersons (ANDE) is a major player in ethanol, grain trade, and plant nutrients. It is the backbone of the corn belt.
FINVIZ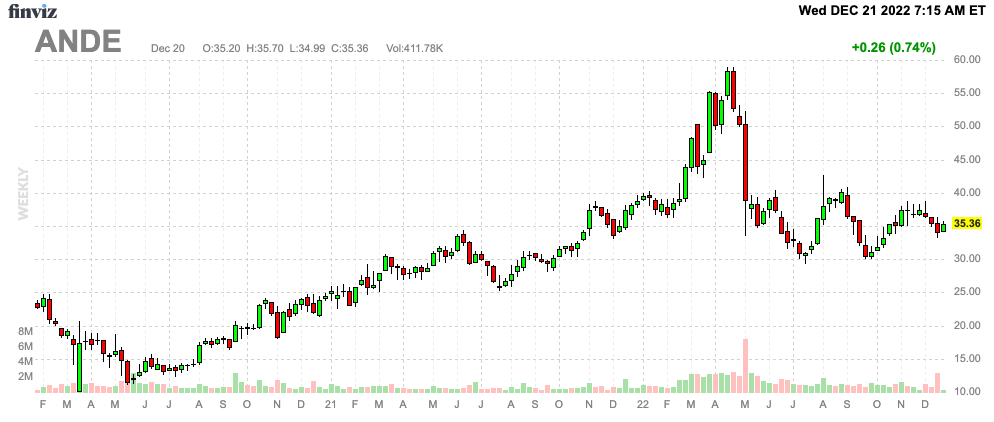
The company has the capacity to produce 475 million gallons of ethanol in five plants. The company benefits from easy access to feedstock (corn), increasing ethanol demand due to higher energy demand and high oil prices, as well as its exposure to fertilizers and trade.
Energy Information Administration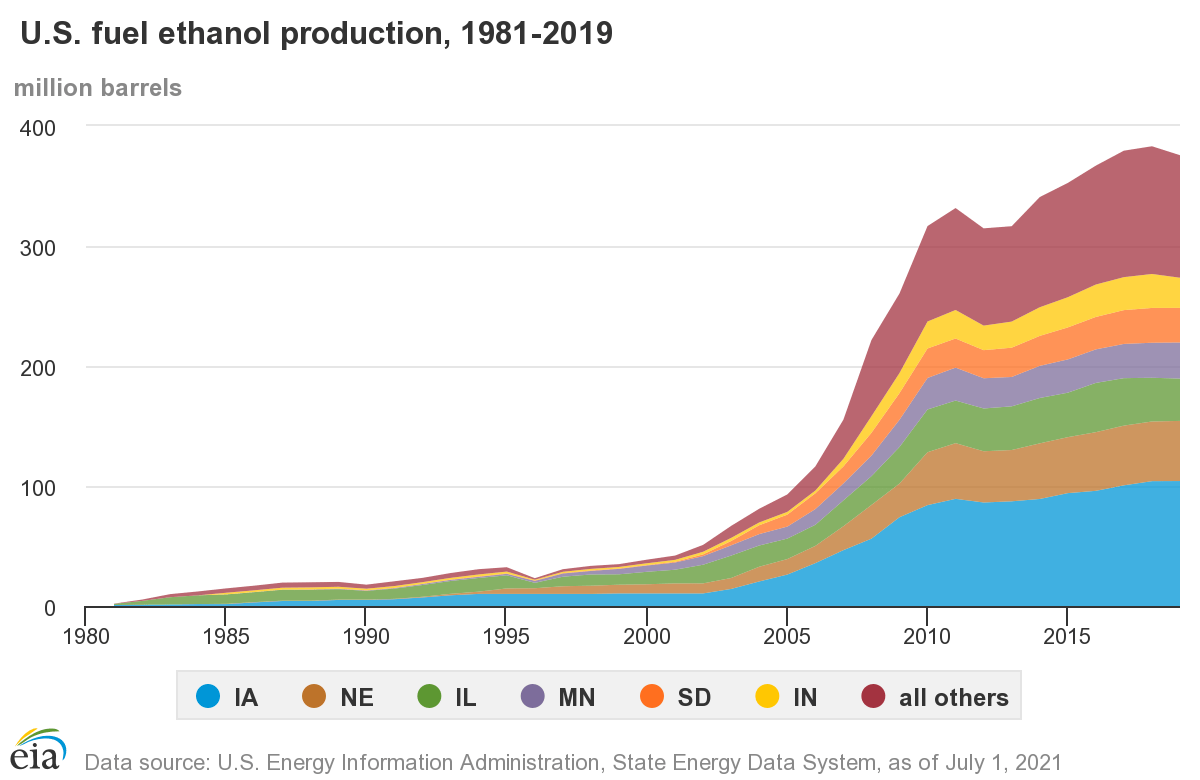
According to the company:
[…] we anticipate a very strong and potentially record setting year. Trade group results were a record third quarter on an adjusted basis and reflect improvement in many areas. Our Louisiana assets performed well during the corn harvest capturing strong elevation margins. Lead ownership in our grain terminal assets is earning space income. In merchandizing, our new profit centers have contributed more than $5 million this quarter to our pretax earnings. We continue to have very strong results in our western greenbelt in animal feed ingredient merchandizing as well as in our food and specialty ingredients businesses.
Needless to say, please do your own due diligence before buying any of these investments. We’ll also continue to discuss most (if not all) of these companies in 2023 and beyond as new developments occur.
Takeaway
In this article, we discussed my agriculture outlook and a number of stocks that go with that. I expect the agriculture bull market to last, even if the rate of change is slowing (crop and fertilizer prices have already accelerated a lot).
However, that still offers a lot of opportunities to make money as I do not believe that farm income or demand fundamentals will take a hit in 2023 (at least not a lasting hit).
We discussed machinery stocks benefiting from a replacement cycle, fertilizer companies benefiting from high demand and favorable energy price differentials, trade and merchandise companies benefiting from high export demand and high margins, and infrastructure companies like the CP railroad.
Let me know what you think of my outlook. Also, did I miss any stocks? What are you buying?
Be the first to comment