

claffra/iStock via Getty Images
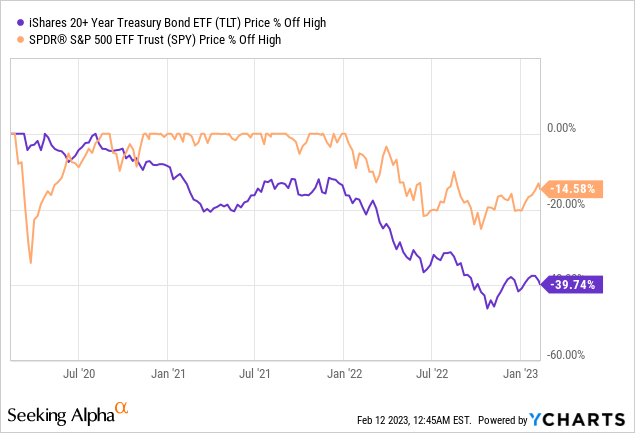
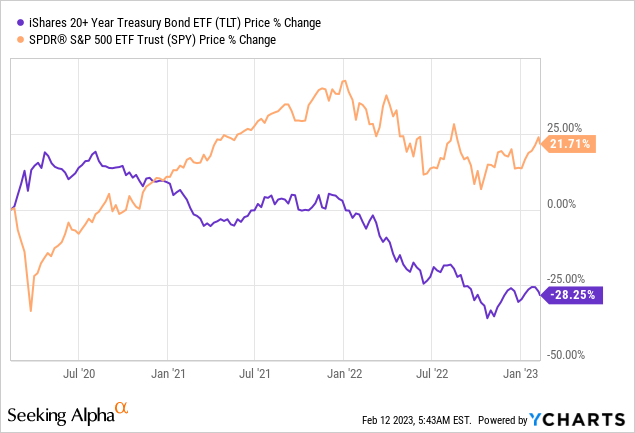
After a terrible 2022, equity markets started 2023 with a serious bang, with the S&P 500 (SPY) already up 6.7% YTD. By comparison, in 2022 the S&P 500 ended nearly 20% lower from peak to trough. But another story that was perhaps a little less on the front pages: the long bond story.
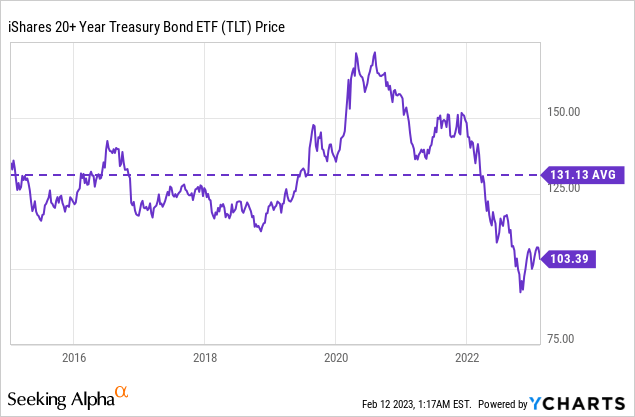
That is why we are ultra-bullish about the price action of ultra-long bonds, particularly the iShares 20+ Year Treasury Bond ETF (NASDAQ:TLT), now that it has fallen to prices not seen in nearly two decades. Since 2020, long bonds like TLT lost nearly 40%, with losses in 2022 representing a record going back to 1754. The second-largest loss went all the way back to the Napoleonic War in 1803 at about 19%.
With multiple economic indicators supporting our recessionary outlook, with deep deflationary forces just around the corner, we explain why investors are best off choosing TLT in 2023 for safety, a near 4% yield and a huge amount of upside if the Fed decides to change course compared to the S&P 500.
The Treasury Bull Run
The past two years were iconic not only for the stark losses in long bonds, but also because it finally broke a 40-year trend, of long bonds trading in a perfect channel.
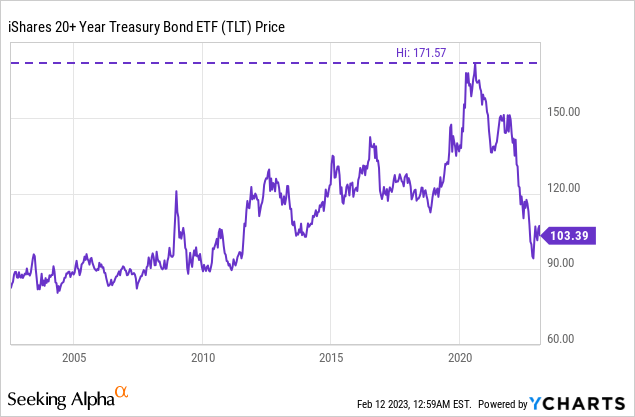
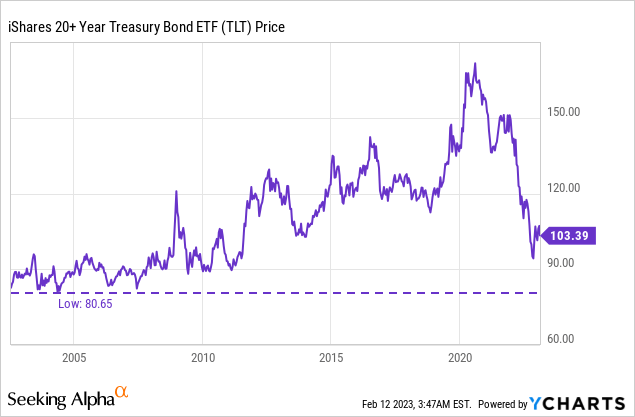
We think this bull run of treasuries is not over yet, and has been broken by the temporary inflows of mostly monetary, but also fiscal policy in 2020 and 2021 leading to the inflation we are seeing now. In 2020, when the Federal Reserve cut interest rates to mind-numbingly low levels, TLT’s price action responded and shot up to highs of $171.
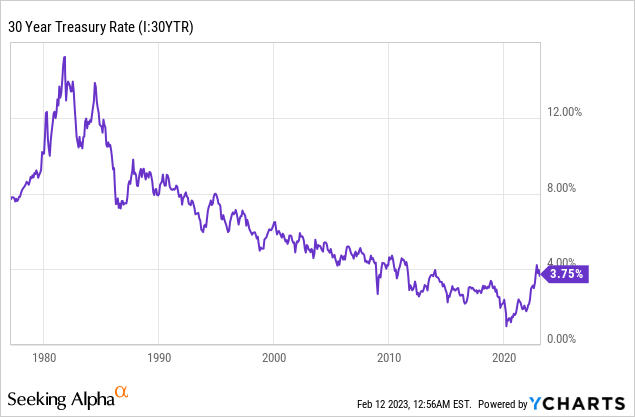
What’s interesting about TLT is that it’s supposed to be fairly flat when interest rates stay the same over time. Unless you have situations like 2020, where the 20-year was trading around 1%, and shot up to the 3.96% where it stands today.
Our call is for the TLT to return to the average of the past eight years, and perhaps beyond. This would require interest rates to fall from around 4% now to around 2.75% closer to the start of this tightening cycle in March 2022.
However, we think there is a significant chance that long bonds could actually go even much further, to where they were trading in late 2019, when the Fed also decided to ease policy and 20-year rates ended around 2%. That could drag TLT closer to $150, or an almost immense 50% repricing of safe long bonds.
A Monetary Phenomenon
To support our thesis, we must emphasize that each situation is unique. History may not repeat itself, but it often does rhyme. With that said, we like to refer to the wise words of Milton Friedman:
Inflation is always and everywhere, a monetary phenomenon. It’s always and everywhere, a result of too much money, of a more rapid increase in the quantity of money than an output. (Milton Friedman)
Simply put, this kind of inflation we are seeing now is not an inherently systemic problem. It is the result of monetary expansion and fiscal stimulus, at a time when supply was constrained by supply chain shocks.
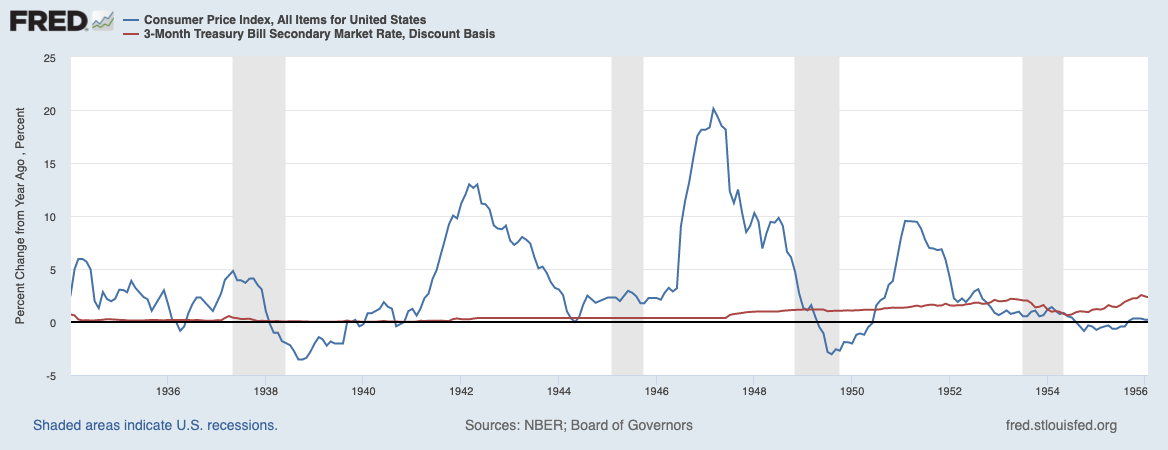
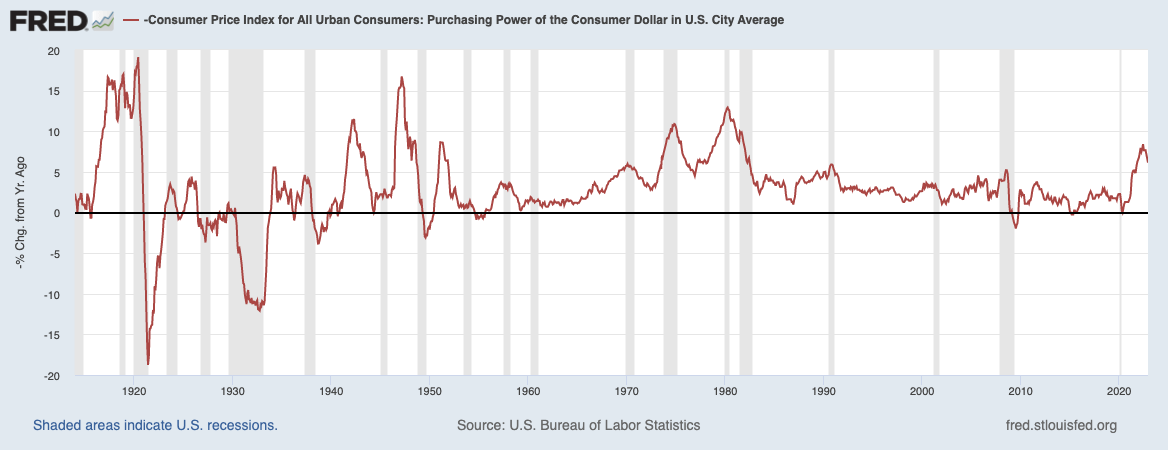
For example, one of the things investors never really talk about is the massive inflation of the 1940s. People often talk about Paul Volcker in the 1980s, but don’t realize how inflation raced through the system and was resolved in the 1940s. How? Not by raising interest rates, to the surprise of most people.
Federal Reserve (FRED)
As you can see, 3-month interest rates remained pretty much flat throughout the period. Inflation peaked several times, but simply flowed through the system and eventually fell. But if this inflation was not expressed as a function of interest rate movements, what was it influenced by?
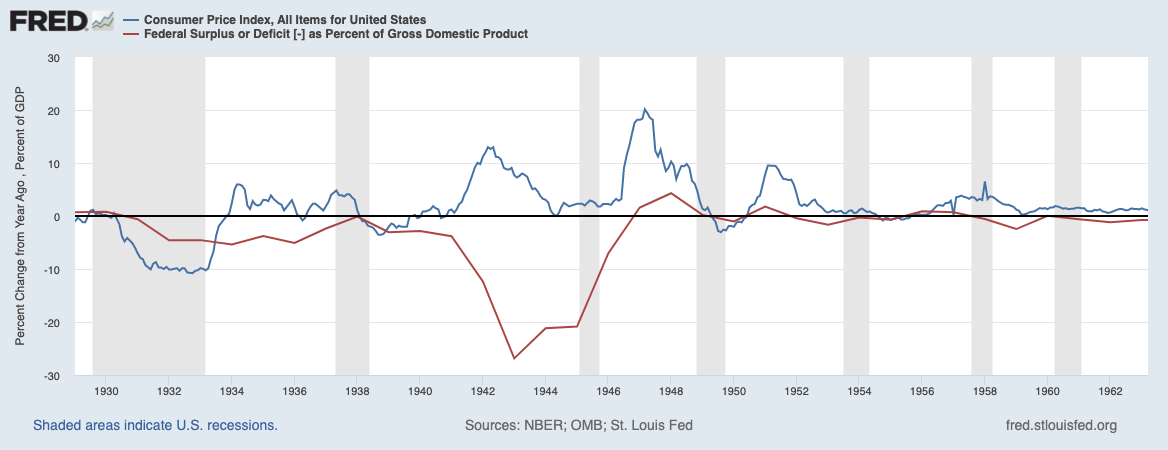
Well, of course there was huge government spending in the 1940s, when Europe was at war in World War II. Deficit spending as a percentage of GDP went through the roof until 1946. When this spending came in, of course there were lagging effects, but inflation resolved itself shortly thereafter.
Federal Reserve (FRED)
Speaking of slowdowns in the economy, we wonder how the Federal Reserve can raise interest rates so sharply while factoring in the lags of monetary policy. To us, it looks like they are currently crashing the economy when we take delays into account. Milton Friedman has beaten us again:
Monetary policy acts with long and variable lags.
How long, some may ask? According to traditional academic research, it takes about 12 months for monetary policy to have an effect, and 18 months to feel the full effect. Strangely, the Atlanta Fed even states on their website that it can take more than two years for the effect to be felt:
A large body of research tells us it can take 18 months to two years or more for tighter monetary policy to materially affect inflation. (Raphael Bostic, Atlantic Fed)
Let’s go back 12 months. Where were we with rates? We just started this tightening cycle. Rates were as good as 0%. But for those connecting the dots: if the Fed raises interest rates to 5.25%, that means we haven’t felt a single 25bp rate hike yet of that 5.25% terminal rate.
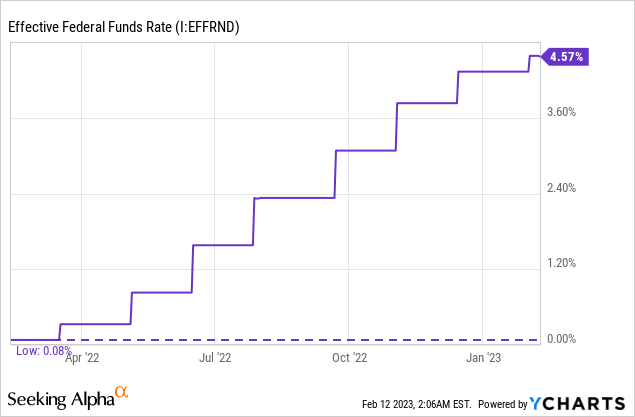
The effects of a 25 basis point rate hike have not even been fully felt yet. Still, annualized inflation fell from nearly 9% to 6.44% now. In fact, if we look at it on a MoM basis, inflation has been close to 0% for the past two months.
Even more amazing is what happens when we subtract shelter from this CPI data. Shelter consists of a very large component called Owner Equivalent Rent, and is a very slow indicator, and perhaps a rather dubious one. But that’s for another topic. In blue, you can see what the CPI looks like, with the shelter component in red.
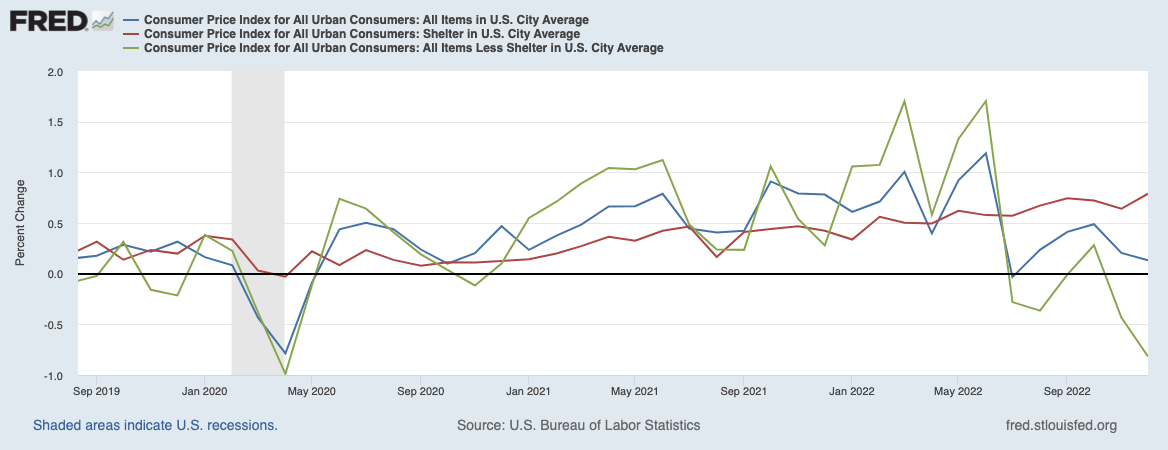
Federal Reserve (FRED)
So if we leave out the shelter component, which we believe is a lagging indicator, we are actually left with strong deflationary forces, currently along the lines of March 2020.
Is This Time Actually Different?
But this goes back to the point: inflation is slowing, and research shows that this is not because of interest rate hikes, because they are not yet in effect. So why is the Fed still raising interest rates? We have absolutely no idea. Maybe they are afraid of inflation, like when Volcker was chairman. On the other hand, we strongly believe that this path will end up with the Fed crushing the economy.
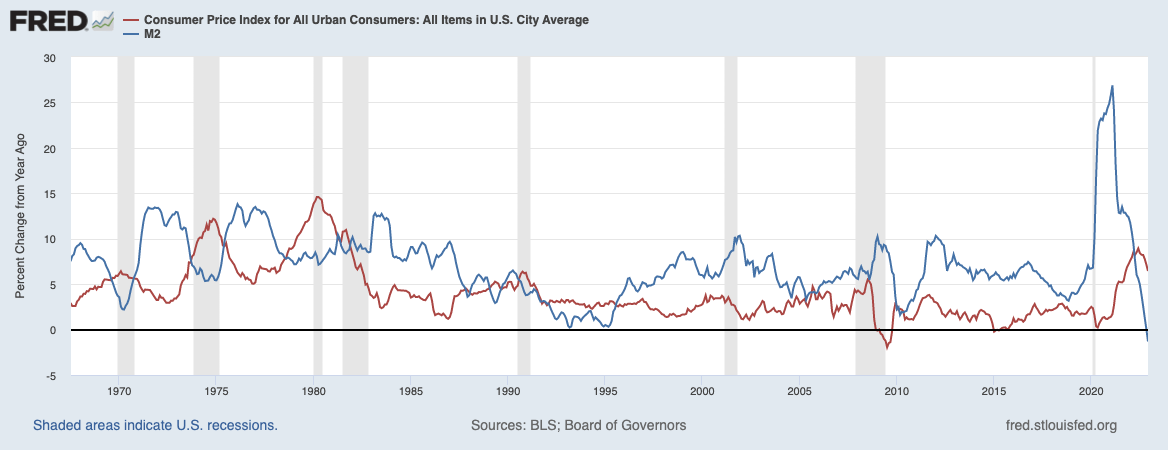
So what has tamed inflation? Well, as a monetary phenomenon, we can look no further than M2 money growth, which had stagnated and has been contracting for more than half a year now. That, combined with supply chain shocks that are starting to resolve.
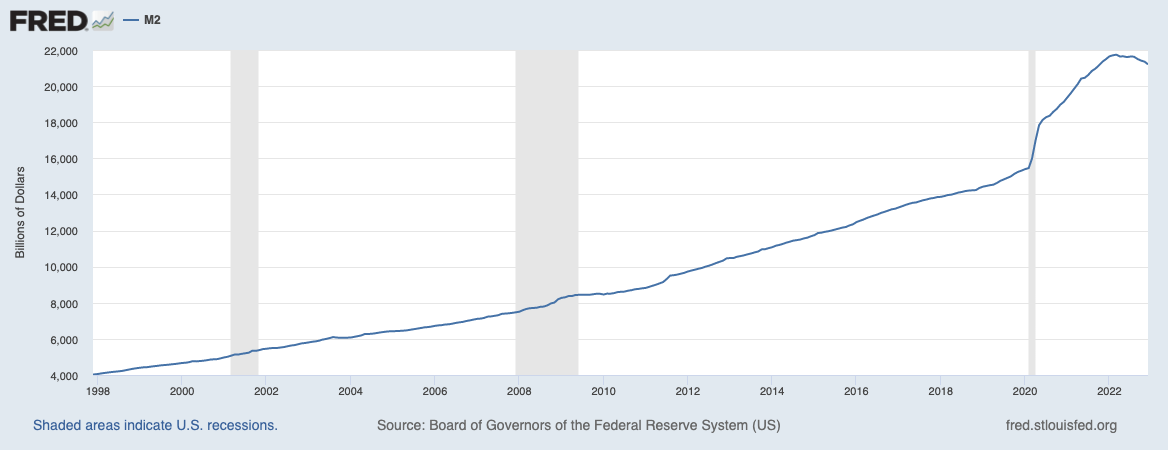
Federal Reserve (FRED)
Look, for example, at the 1970s, when M2 rose abruptly after a recession, eventually driving inflation back up twice. Indeed, the economy works with long and variable lags.
Federal Reserve (FRED)
And as we’ve said before, every situation is different. One of the key differences is that we are currently in a very different situation in terms of debt to GDP. Before, when Volcker jacked up interest rates to 19%, private and public debt to GDP was about 150% of GDP.
By 2020, it crossed over 400%. That means that not only have we not felt anything from the 5.25% terminal interest rate we’re headed for, but 5.25% might feel like more than 10% in the current economic climate. Talk about hitting the economy with a sledgehammer.
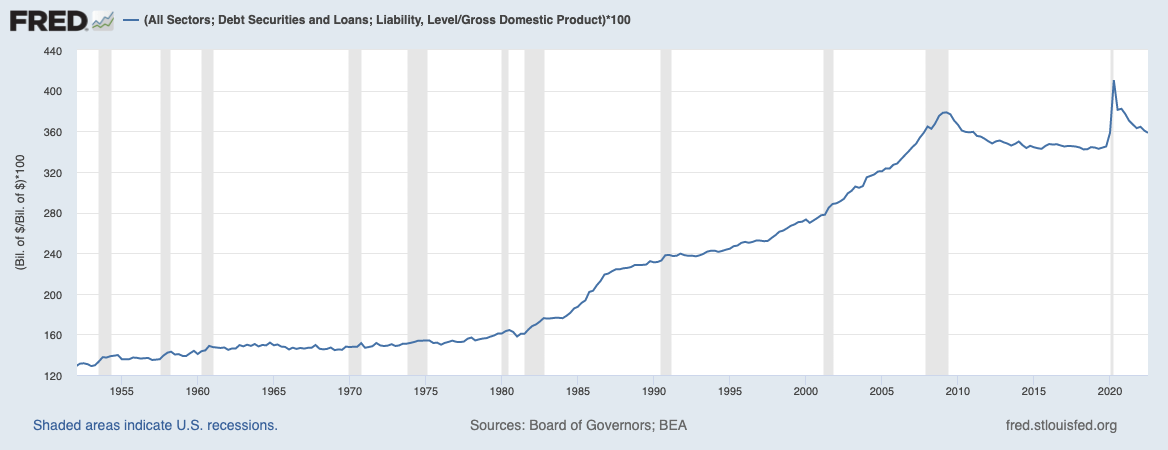
Federal Reserve (FRED)
What makes us so confident in our statement that the Fed is wrong again about achieving a soft landing and keeping interest rates higher for longer? We just look at every time they have raised interest rates in the past. We can’t make this up, but they have raised interest rates heading into every recession.
And yes, maybe 1995 had a soft landing, although the economy later overheated and still went into a fairly sharp recession in 2000. The name of the game is simple: the Fed cuts interest rates when the economy is in shambles.
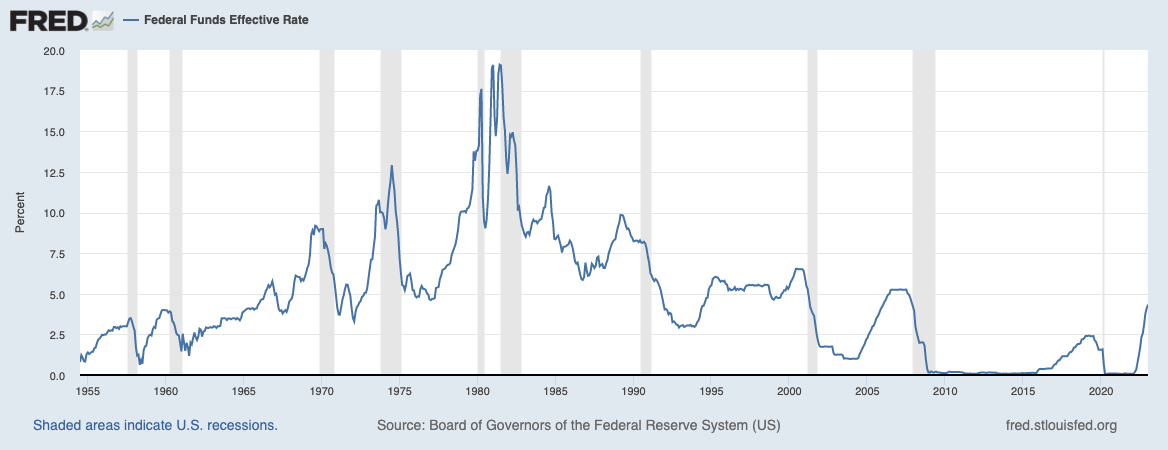
Federal Reserve (FRED)
As a sidenote, in addition to the decline in the M2 money supply, there is an entire market that the Federal Reserve does not oversee: the Eurodollar market/offshore banking market that was formed in the 1950s/60s.
This market was estimated at $13.83 trillion in 2016, although no one knows its true size because it operates out of the Federal Reserve’s sight. Since the U.S. abandoned its gold standard, the U.S. dollar became the new standard for collateral.
The Writing’s On The Wall
There is a great saying that goes like:
Fool me one time, shame on you. Fool me twice, can’t put the blame on you.
There are a few indicators that have always pointed to a recession, and we think this time is indeed no different. Every time in the past 40+ years that the 2-10-year yield curve inverted, the Federal Reserve subsequently cut interest rates. Every time the curve inverted, we also got a recession, with extremely minor exceptions.
But make no mistake, the inversion we are seeing now is not just a small one. It is the biggest inversion we have ever seen in the last 40 years. Everything points to a recession, and yet the Fed and market participants are optimistic. Maybe history is repeating itself after all.
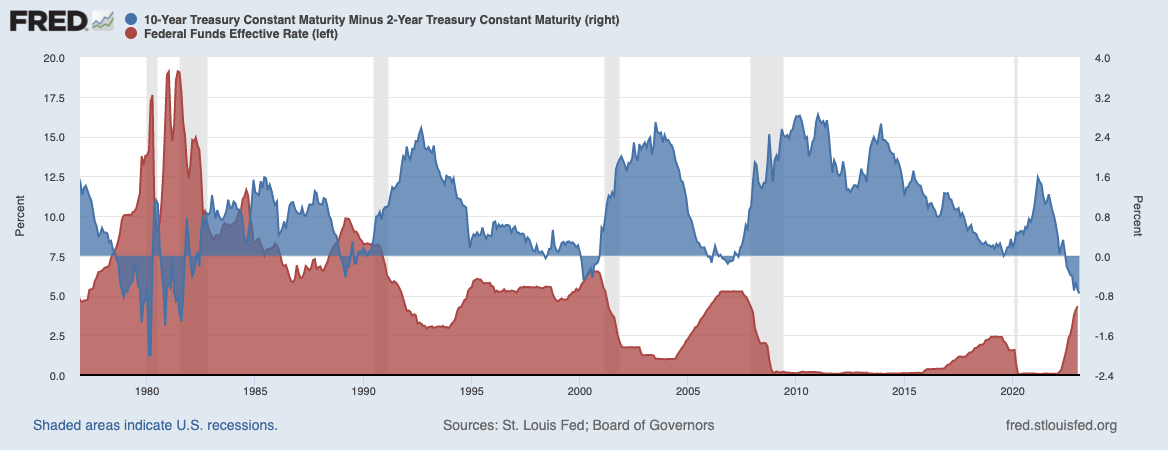
Federal Reserve (FRED)
Even looking at the spread for the 3-month and 10-year treasuries, the chart indicates very worrying times to say the least. The curve reached an inversion of -132bp, again worst since the 1980s.
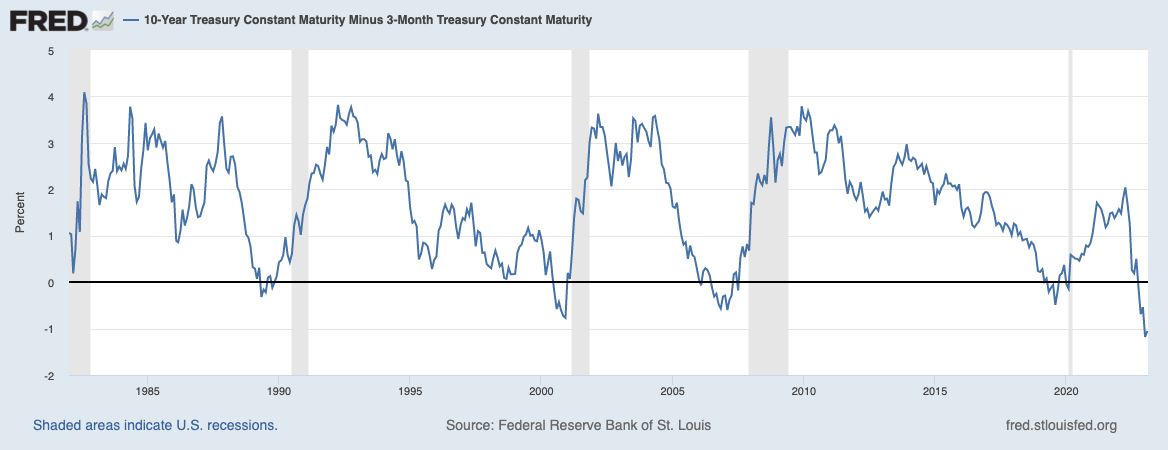
Federal Reserve (FRED)
Yet the pain is already being felt more than perhaps stocks alone can describe. The net worth of households and businesses as a proportion of GDP appears to be moving back in the direction it was before the monetary expansion.
The movement of crushed asset prices is surprisingly similar to that of 2008, as currently both housing prices and the overall value of the stock market are falling.
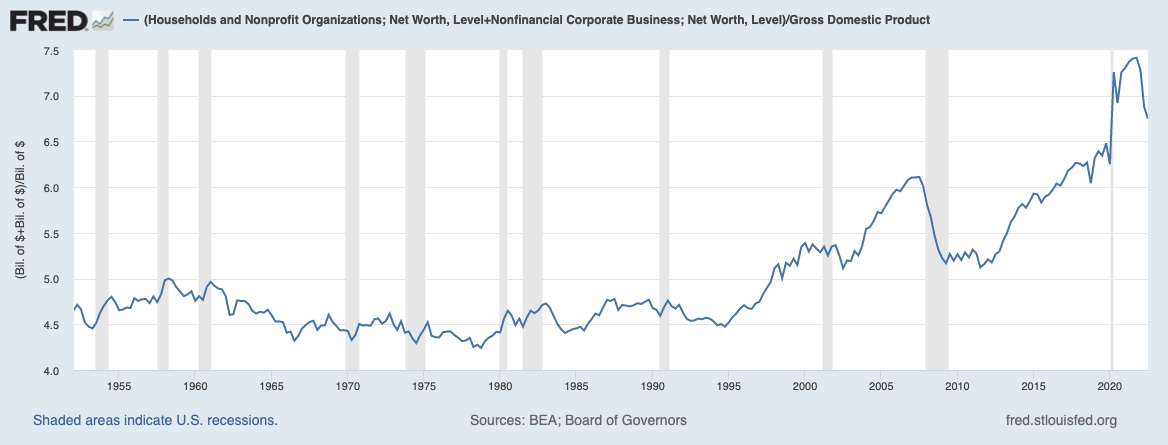
Federal Reserve (FRED)
What’s Next?
Taking all that information together, our thesis for the economy remains largely unchanged from what we thought at the end of last year: asset prices will be crushed, the U.S. will fall into recession, equities will experience a downturn like any other recession.
And most importantly, when interest rates finally take effect, taking into account the slowdown in policy, we expect profound deflation by the second half of the year, with the Fed drastically cutting interest rates as always. No, this time we don’t see why it would be any different. But the question remains: will we see more QE and/or another fiscal move when we enter a recession?
This is a legitimate question, as it could lead to another inflationary spike, as inflation is always and everywhere a monetary phenomenon. Looking back in history, inflation always appears to have multiple peaks. One thing is also certain: a deflationary recession is a very rare recession, which, however, we do not wish upon anyone.
Federal Reserve (FRED)
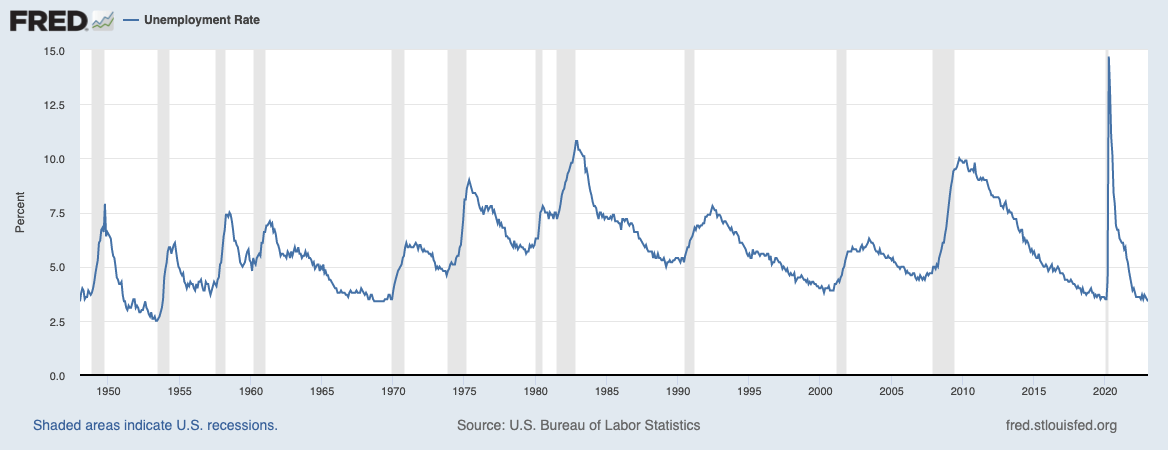
Finally, let’s hit a nail on the coffin of the unemployment debate. As most know, unemployment is a lagging indicator. It rises when we are already in recession. If the Fed is waiting for the labor market to move, it is actually waiting to be in a recession.
Which surprisingly also means that, all else being equal, a deterioration in that labor market could be very toxic to deflationary forces. Currently, inflation is already cooling, while the labor market is immensely hot. Imagine what would happen to inflation if that same labor market were to deteriorate, with interest rates finally taking effect at the same time.
Federal Reserve (FRED)
The Game Plan
With all that, the game seems simple: perhaps own fewer stocks and more ultra-long bonds. Why? If the Fed cuts interest rates dramatically, long bonds should rise with them.
The proposition is very attractive: you get bonds with a 4% yield, you are relatively protected from losing the principal, and you essentially get a free perpetual call option that can yield more than 30% return in the short term. It is quite an obscure strategy, because you are essentially building a call option on the Fed making yet another policy mistake.
If our call about inverted yield curves, declining money supply and monetary policy lags, among other things, turns out to be true, we could gain a lot. While TLT rises another 30% in that scenario, SPY could fall much more, just as in previous recessions.
We can take that 30% gain in repricing our long bonds when the time comes, and start buying stocks at low valuations. Every time in recent history that the yield curve inverted, the S&P 500 crashed accordingly:
- 1982: 19%
- 1990: 10%
- 2000: 49%
- 2008: 57%
- 2020: 35%
Look Down, Not Up
Although we have a very strong conviction, the question remains: what if we are wrong? It is always a good idea to see what the downside looks like in such a scenario. Or as they say, look down, not up.
In the event that inflation is stronger than expected, interest rates could indeed stay higher for a bit longer. But even then, we will first have to implement monetary policy delays. But let’s say that somehow this 40-year bull market is abruptly over, and inflation has somehow become an inherent systemic problem. What would be the downside?
That depends on where the Fed is willing to raise interest rates. But again, keep in mind the 4x debt/GDP the US has exceeded by 2020, this is a totally different situation from the 1980s. The US also has not had longer, sustainable interest rates above 6% after the 1990s. If for some reason the Fed decides to take interest rates to 6% and can do so for an extended period, there is a chance that we could see a loss of principle and opportunity cost.
Therefore, whilst collecting that 4% coupon, we think it would be prudent to maintain a stop-loss around $85 should we find ourselves in a worst-case scenario. We continue to pay particular attention to economic indicators such as unemployment, CPI, the yield curve and other indicators to base our judgment on.
The Bottom Line
Looking at multiple economic indicators, buying TLT seems like a very interesting idea. With the ETF falling from $171 to $103, with the worst losses in centuries, the worst seems definitely behind us when it comes to inflation and interest rate hikes, perhaps until 2025.
If our assumptions are correct, you probably don’t want to own that many stocks, as they still have a long way to go to a recession. If you invest in risk assets and stocks, you are betting on the Fed being right. And judging from historical data, we don’t believe that.
Nevertheless, we would still run a part of our portfolio in a concentrated strategy with high-conviction stocks. If you buy ultra-long bonds, you get a yield of nearly 4%, coupled with what we see as a perpetual call option on a Federal Reserve rate change and the continuation of this 40-year treasury bull run.
Now that the Federal Reserve could cut interest rates, that would also be a golden opportunity to use those gains to buy stocks at greatly reduced prices. We would be overweight in long-bonds and neutral in equities.
Be the first to comment