

damircudic
I’ve written a lot about inflation recently. I still think markets are at the mercy of inflation and the triumvirate of doom, which means that the U.S. inflation report is likely to remain the most economic piece of data for markets, for the foreseeable future. I haven’t been looking at the inflation trades for a while, however, which I will seek to make amends on here.
Falling inflation eventually will allow central banks to perform the much-discussed pivot, both in terms of the speed of tightening and eventual terminal rate. The latter follows naturally from the fact the tightening cycle’s end point inevitably draws nearer as central banks continue to raise rates. An even bigger question is what inflation regime will emerge once the current fever breaks – and it will break, eventually. Markets ought to be able to tell us something about that.
Ask ten investors about their favourite inflation trade, and you are likely to get more than a few answers, so I should set the scene from the get-go. Apart from shorting bonds, which is the purest inflation trade – except in yield curve-controlled markets where you want to short the currency – I’d emphasize three relatively simple inflation trades: energy equities, bank equities, and commodities. The equity leg in this story is a key part in the more general, and fiercely debated, contest between the value and growth factors in equities. The former performs best in periods of rising yields, and rising inflationary pressures. The latter is best suited for regimes with low rates and low inflation, or so the story goes. The final three charts mark this argument to market by showing the relationship with these assets’ relative performance and bond yields and inflation.
The Inflation Trade Is Still In Pole Position (Author)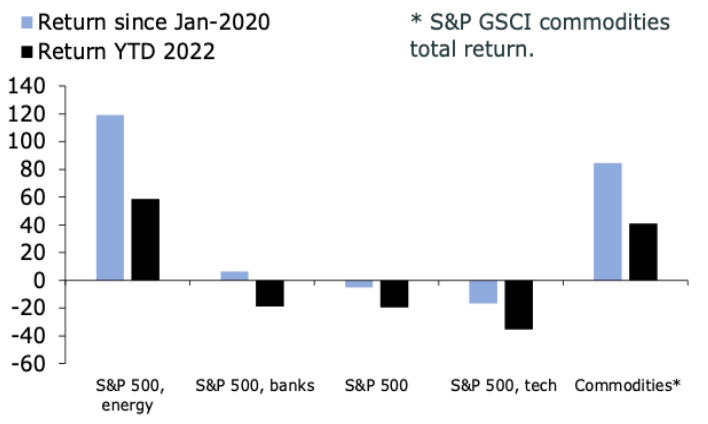
The first chart above plots the performance of these assets in comparison with the S&P 500. It paints a reasonably clear picture. Energy stocks and commodities have comfortably outperformed since 2020, and again this year, consistent with the shift in macro-dynamics since Covid and the war in Ukraine. Banks have outperformed too, but less so, and they have languished this year, in line with the market as a whole. This shows that all inflation trade(s) aren’t made equal. Banks should like a macro-environment with higher yields, inflation and nominal growth, but they don’t like stagflation and inverted yield curves.
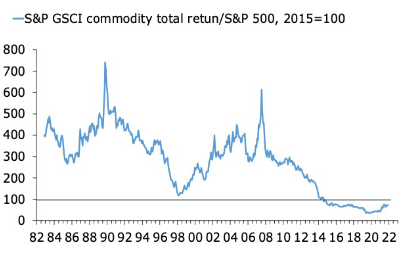
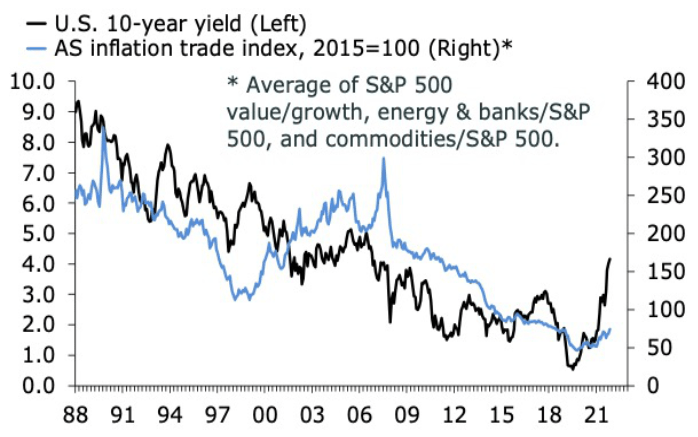
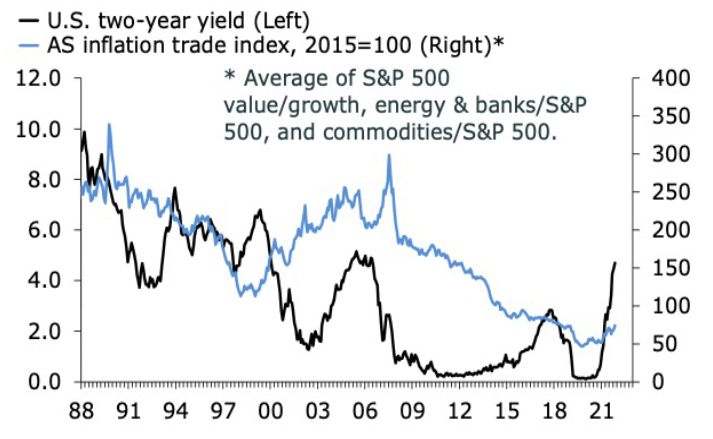
The next two charts put the recent outperformance of the inflation trade(s) in perspective. Looking at these charts, the outperformance of inflation-positive trades is just getting started. This is an interesting picture in comparison with an increasingly stale obsession among investors and analysts over rising inflation, and what looks like early signs that of a global monetary policy pivot, at least in terms of the pace of tightening. The question posed by the charts below is not so much whether acute cyclical inflation-fears will give way to fears of slowing growth and disinflation – it will eventually – but whether the reversal in the relative performance of the inflation trades is the beginning of a more sustained shift in global inflation dynamics, along the lines ofthe recent musings by Dario Perkins.
More To Come For Inflation Trade? (Author) Still Overall Depressed (Author)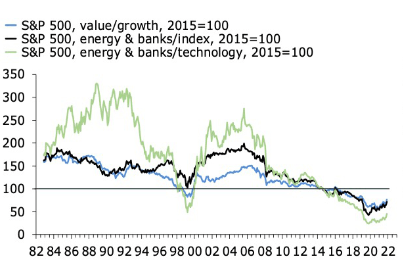
It is impossible to tell simply by looking at the charts above. But we should be looking careful at how the inflation trade respondsto what will inevitably be a turn in the second derivative of core and headline inflation, and central bank policy.The relative performance of banks and financials is particularly interesting. This trade can be thought of as the most pro-cyclical component of the inflation trade. It is hard to imagine a sustained shift in favour of the inflation trade unless it is, at some point, accompanied by a cyclical upturn in the economy. More specifically, it is not enough that rates and bond yields shoot higher in response to an inflation shock; they have to stay high too, or at least higher than before. The alternative is a permanent state of stagflation, which eventually will give way to disinflation and deflation. One way to track the tug-of-war between these two regimes, and presumably the relative performance of banks and financials, is whether the yield curve re-steepens via a fall in shorter rates, or a rise in long-term yields, and more specifically the balance between the two. The stronger the pull of the latter, the stronger the pull of the inflation trade should be. More generally, the performance of the inflation trade in the next 6-12 months will tell us a lot, about the economy and markets alike.
Will High Inflation Persist To Shift? (Author) The Long Bond Signals Upside For The Inflation Trade (Author) A Regime Shift For Policy Rates And Inflation Trades? (Author)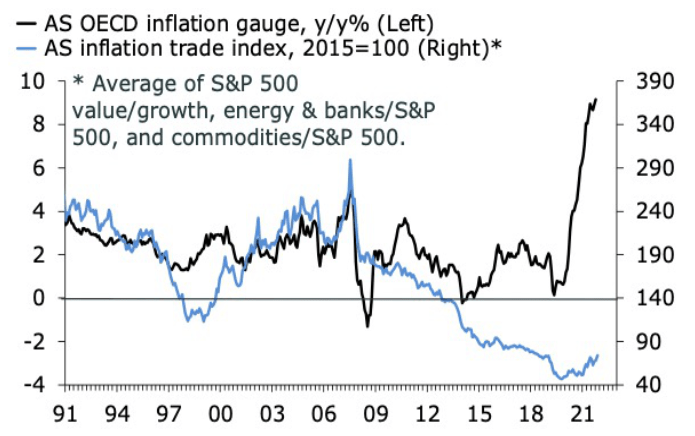
Editor’s Note: The summary bullets for this article were chosen by Seeking Alpha editors.
Be the first to comment