

Luis Alvarez/DigitalVision via Getty Images
Author’s note: This article was released to CEF/ETF Income Laboratory members on June 28th, 2022. Please check latest data before investing.
“High-high-low” closed-end fund report
Quantitative screens help to rapidly narrow down attractive candidates from the database of 500+ closed-end funds [CEFs] for further due diligence and investigation. The “High-High-Low” report was inspired by a member of CEF/ETF Income Laboratory, who wrote:
Stanford, you should do a follow up article on CEF that distribute 8%+, have 90% or more coverage and trade under NAV. What does that look like in today’s world? How many funds are doing that?
What are the Z scores? I think many investors would be interested who are pushing for higher yield to identify best in class of aggressive funds that are coming close to covering dividends. Allows people to reevaluate risk/reward.
The “High-High-Low” report, therefore, screens for the following three attributes that we like to screen for:
- High distributions (>6.5%) (i.e., 6.5% or higher yields)
- High coverage (>85%) (i.e., 85% or better coverage)
- Low premium/discount value (<+5%) (i.e., trading at a +5% premium or less)
Note that the above thresholds are subject to change, based on the number of eligible CEFs there are that satisfy all three of the criteria. I try to aim for a minimum of at least 20 eligible funds so that the “top 10” list actually means something (top 50% of the screen).
As for the Quality CEF report, I should mention some caveats about using coverage as a screen. Firstly, the coverage ratios are calculated using earnings data from CEFConnect. No efforts have been made to independently verify the coverage ratios from the individual fund annual/semi-annual reports themselves. Secondly, having a coverage ratio >90% does not guarantee that the fund’s distribution is secure. Many funds reduce their distributions periodically in line with market conditions in order to maintain good coverage. Thirdly, a coverage cut-off ratio of 90% is, ultimately, an arbitrary number. A fund with 89.9% coverage will be excluded from the rankings, whereas funds with 90.1% coverage will be considered, even though only a sliver of difference separates the two.
The coverage ratio is calculated by dividing the earnings/share number provided by CEFConnect on the “distributions” tab by the distribution/share. CEFData also provides earnings coverage numbers as well.
I should also note that having both high yields and less than 100% coverage (though greater than 80%) makes this a more aggressive screen compared to the Quality report (which only selects for >100% coverage). Furthermore, note that because the universe of eligible funds is pretty small, some of the CEFs will appear in multiple top lists, just in a different order…
I hope that these rankings of “high-high-low” CEFs will provide fertile grounds for further exploration.
Key to table headings:
P/D = premium/discount
Z = 1-year z-score
Cov = coverage
1Y NAV = 1-year NAV total return
Lev = leverage
BE = baseline expense
Data were taken from the close of June 27, 2022.
1. Top 10 widest “high-high-low” discounts
The following data show the 10 CEFs with the widest discounts, yield >6.5% and coverage >85%. Z-scores, leverage and baseline expense are shown for comparison.
| Fund | Ticker | Category | P/D | Yield | Z | Cov | 1Y NAV | Lev | BE |
| Highland Floating Rate Opportunities Fd | (HFRO) | Senior Loans | -27.53% | 8.46% | -2.6 | 116% | 21.4% | 12% | 1.61% |
| Western Asset Emerging Markets Debt | (EMD) | Emerging Market Income | -14.25% | 11.04% | -1.7 | 101% | -18.7% | 36% | 1.30% |
| Ivy High Income Opportunities Fund | (IVH) | High Yield | -13.38% | 8.14% | -2.0 | 110% | -8.3% | 31% | 1.51% |
| Blackstone Long-Short Credit Income | (BGX) | Senior Loans | -12.82% | 8.20% | -1.7 | 112% | -3.5% | 41% | 1.47% |
| Pioneer Floating Rate Fund | (PHD) | Senior Loans | -12.74% | 8.14% | -1.8 | 86% | -4.2% | 36% | 1.88% |
| DoubleLine Yield Opportunities Fund | (DLY) | Multisector Income | -12.65% | 9.79% | -1.9 | 95% | -10.0% | 28% | 1.93% |
| Ares Dynamic Credit Allocation Fund | (ARDC) | Senior Loans | -12.34% | 9.58% | -1.8 | 117% | -4.8% | 27% | 2.08% |
| Blackstone Strategic Credit | (BGB) | Senior Loans | -12.17% | 7.23% | -2.1 | 108% | -3.5% | 39% | 2.17% |
| Barings Global Short Duration High Yield | (BGH) | High Yield | -12.09% | 9.72% | -1.7 | 122% | -4.2% | 31% | 1.32% |
| Nuveen Real Asset Inc and Grwt | (JRI) | Global Allocation | -11.99% | 8.89% | -1.3 | 86.27% | 2.16% | 33% | 1.32% |
Income Lab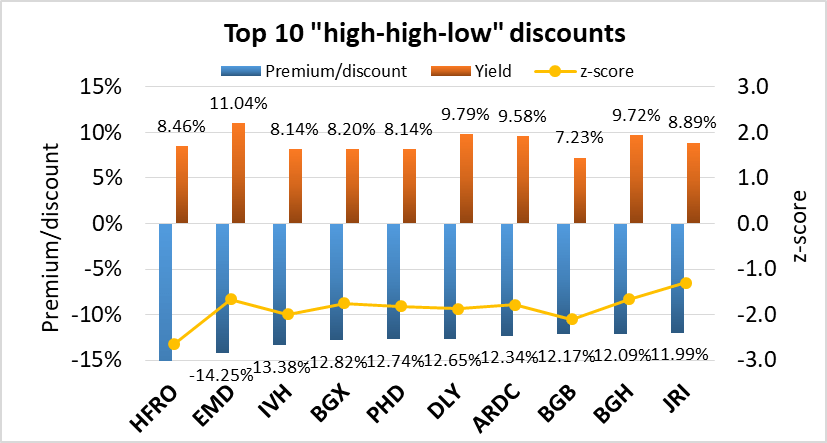
2. Top 10 lowest “high-high-low” z-scores
The following data show the 10 CEFs with the lowest z-scores, yield >6.5%, coverage >85% and premium/discount <+5%. Leverage and baseline expense are shown for comparison.
| Fund | Ticker | Category | Z | P/D | Yield | Cov | 1Y NAV | Lev | BE |
| Oxford Lane Capital Corp | (OXLC) | Senior Loans | -3.2 | -9.51% | 15.93% | 104% | 24.7% | 26% | 8.22% |
| Highland Floating Rate Opportunities Fd | (HFRO) | Senior Loans | -2.6 | -27.53% | 8.46% | 116% | 21.4% | 12% | 1.61% |
| Flah & Crum Dynamic Pref & Income Fund | (DFP) | Preferreds | -2.4 | -2.41% | 8.56% | 101% | -9.4% | 38% | 1.32% |
| Blackstone Strategic Credit | (BGB) | Senior Loans | -2.1 | -12.17% | 7.23% | 108% | -3.5% | 39% | 2.17% |
| Ivy High Income Opportunities Fund | (IVH) | High Yield | -2.0 | -13.38% | 8.14% | 110% | -8.3% | 31% | 1.51% |
| DoubleLine Yield Opportunities Fund | (DLY) | Multisector Income | -1.9 | -12.65% | 9.79% | 95% | -10.0% | 28% | 1.93% |
| Western Asset High Yield Defined Opps | (HYI) | High Yield | -1.8 | -6.99% | 9.52% | 85% | -7.7% | 0% | 0.93% |
| Pioneer Floating Rate Fund | (PHD) | Senior Loans | -1.8 | -12.74% | 8.14% | 86% | -4.2% | 36% | 1.88% |
| Ares Dynamic Credit Allocation Fund | (ARDC) | Senior Loans | -1.8 | -12.34% | 9.58% | 117% | -4.8% | 27% | 2.08% |
| KKR Income Opportunities Fund | (KIO) | High Yield | -1.8 | -11.73% | 10.71% | 109% | -8.3% | 40% | 2.12% |
Income Lab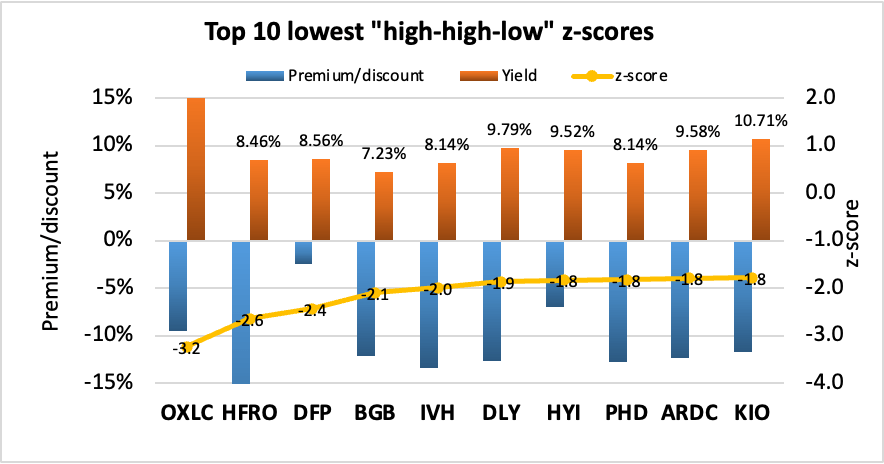
3. Top 10 highest “high-high-low” yields
The following data show the 10 CEFs with the highest yields, coverage >85% and premium/discount <+5%. z-scores, leverage, and baseline expense are shown for comparison.
| Fund | Ticker | Category | Yield | P/D | Z | Cov | 1Y NAV | Lev | BE |
| Oxford Lane Capital Corp | (OXLC) | Senior Loans | 15.93% | -9.51% | -3.2 | 104% | 24.7% | 26% | 0.88% |
| BrandywineGLOBAL – Global Inc Opp Fund | (BWG) | Global Income | 12.52% | -10.91% | -0.6 | 97% | -17.7% | 42% | 2.46% |
| Pioneer Diversified High Income | (HNW) | High Yield | 11.86% | -9.70% | -1.3 | 98% | -9.3% | 37% | 1.60% |
| Western Asset High Income II | (HIX) | High Yield | 11.62% | -2.85% | -0.6 | 93% | -12.5% | 33% | 1.27% |
| Western Asset Global High Income | (EHI) | High Yield | 11.16% | -7.65% | -0.8 | 103% | -13.5% | 38% | 1.27% |
| RiverNorth Specialty Finance | (RSF) | High Yield | 11.12% | -0.37% | 1.1 | 172% | 3.0% | 37% | 6.53% |
| Western Asset Emerging Markets Debt | (EMD) | Emerging Market Income | 11.04% | -14.25% | -1.7 | 101% | -18.7% | 36% | 1.30% |
| DoubleLine Income Solutions Fund | (DSL) | Global Income | 10.88% | -10.71% | -1.6 | 116% | -14.5% | 31% | 1.50% |
| KKR Income Opportunities Fund | (KIO) | High Yield | 10.71% | -11.73% | -1.8 | 109% | -8.3% | 40% | 1.32% |
| PIMCO Global StocksPLUS & Income | (PGP) | Global Allocation | 10.68% | 4.05% | 0.3 | 104% | -11.8% | 42% | 1.66% |
Income Lab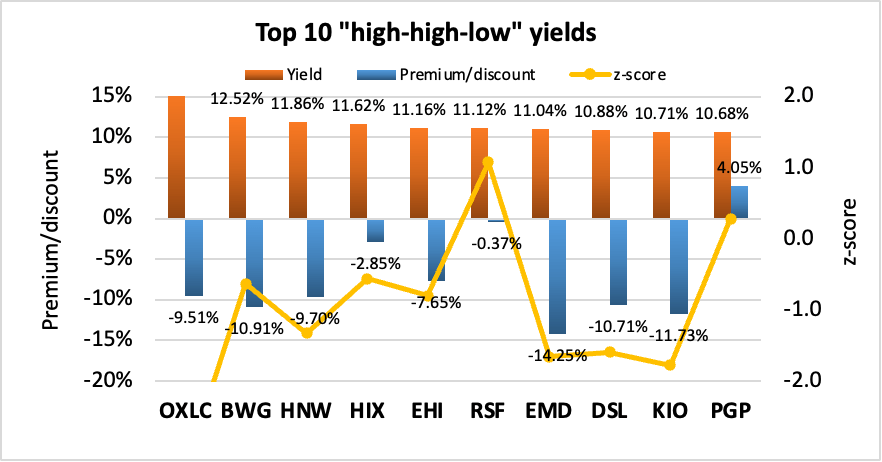
4. Top 10 best combination of “high-high-low” yield and discount
For possible buy candidates, it is probably a good idea to consider both yield and discount. Buying a CEF with both a high yield and discount not only gives you the opportunity to capitalize from discount contraction, but you also get “free” alpha as a result of the distribution being paid out. This is because paying out a distribution is effectively the same as liquidating part of the fund at NAV and returning the capital to the unitholders. I considered several ways to rank CEFs by a composite metric of both yield and discount. The simplest would be yield + discount, however I disregarded this because yields and discounts may have different ranges of absolute values and a sum would be biased towards the larger set of values. I finally settled on the multiplicative product, yield x discount. This is because I consider a CEF with 7% yield and 7% discount to be more desirable than a fund with 2% yield and 12% discount, or 12% yield and 2% discount, even though each pair of quantities sum to 14%. Multiplying yield and discount together biases towards funds with both high yield and discount. Since discount is negative and yield is positive, the more negative the “DxY” metric, the better. Only funds with >6.5% yield, >85% coverage and <+5% premium/discount are considered.
| Fund | Ticker | Category | P/D | Yield | Z | DxY | Cov | 1Y NAV | Lev | BE |
| Highland Floating Rate Opportunities Fd | (HFRO) | Senior Loans | -27.53% | 8.46% | -2.6 | -2.33 | 116% | 21.4% | 12% | 1.61% |
| Western Asset Emerging Markets Debt | (EMD) | Emerging Market Income | -14.25% | 11.04% | -1.7 | -1.57 | 101% | -18.7% | 36% | 1.30% |
| Oxford Lane Capital Corp | (OXLC) | Senior Loans | -9.51% | 15.93% | -3.2 | -1.51 | 104% | 24.7% | 26% | 1.47% |
| BrandywineGLOBAL – Global Inc Opp Fund | (BWG) | Global Income | -10.91% | 12.52% | -0.6 | -1.37 | 97% | -17.7% | 42% | 2.46% |
| KKR Income Opportunities Fund | (KIO) | High Yield | -11.73% | 10.71% | -1.8 | -1.26 | 109% | -8.3% | 40% | 2.12% |
| DoubleLine Yield Opportunities Fund | (DLY) | Multisector Income | -12.65% | 9.79% | -1.9 | -1.24 | 95% | -10.0% | 28% | 1.93% |
| Ares Dynamic Credit Allocation Fund | (ARDC) | Senior Loans | -12.34% | 9.58% | -1.8 | -1.18 | 117% | -4.8% | 27% | 2.08% |
| Barings Global Short Duration High Yield | (BGH) | High Yield | -12.09% | 9.72% | -1.7 | -1.18 | 122% | -4.2% | 31% | 1.32% |
| DoubleLine Income Solutions Fund | (DSL) | Global Income | -10.71% | 10.88% | -1.6 | -1.17 | 116% | -14.5% | 31% | 0.88% |
| Pioneer Diversified High Income | (HNW) | High Yield | -9.70% | 11.86% | -1.3 | -1.15 | 98% | -9.3% | 37% | 1.60% |
Income Lab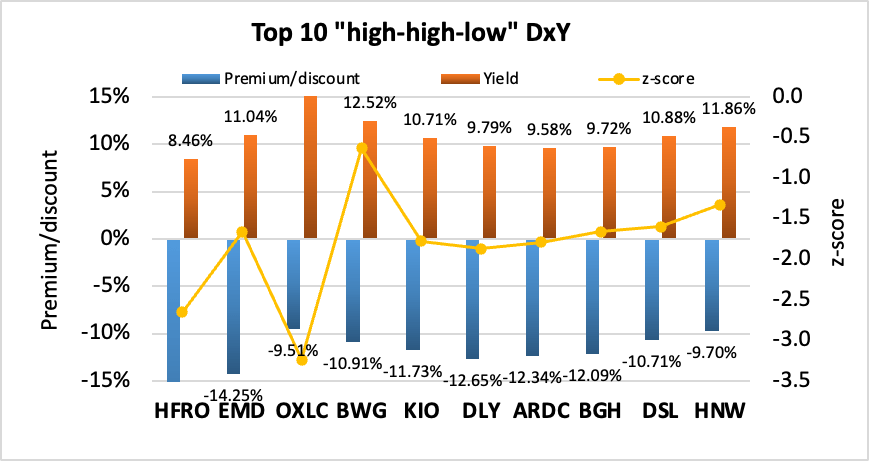
5. Top 10 best combination of “high-high-low” yield, discount and z-score
This is my favorite metric because it takes into account all three factors that I always consider when buying or selling CEFs: yield, discount and z-score. The composite metric simply multiplies the three quantities together. As both discount and z-score are negative while yield is positive, the more positive the “DxYxZ” metric, the better. Only funds with >7% yield, >85% coverage and <+5% premium/discount are considered.
| Fund | Ticker | Category | P/D | Yield | Z | DxYxZ | Cov | 1Y NAV | Lev | BE |
| Highland Floating Rate Opportunities Fd | (HFRO) | Senior Loans | -27.53% | 8.46% | -2.6 | 6.17 | 116% | 21.4% | 12% | 1.32% |
| Oxford Lane Capital Corp | (OXLC) | Senior Loans | -9.51% | 15.93% | -3.2 | 4.91 | 104% | 24.7% | 26% | 8.22% |
| Western Asset Emerging Markets Debt | (EMD) | Emerging Market Income | -14.25% | 11.04% | -1.7 | 2.61 | 101% | -18.7% | 36% | 1.47% |
| DoubleLine Yield Opportunities Fund | (DLY) | Multisector Income | -12.65% | 9.79% | -1.9 | 2.32 | 95% | -10.0% | 28% | 1.93% |
| KKR Income Opportunities Fund | (KIO) | High Yield | -11.73% | 10.71% | -1.8 | 2.24 | 109% | -8.3% | 40% | 2.12% |
| Ivy High Income Opportunities Fund | (IVH) | High Yield | -13.38% | 8.14% | -2.0 | 2.17 | 110% | -8.3% | 31% | 1.51% |
| Ares Dynamic Credit Allocation Fund | (ARDC) | Senior Loans | -12.34% | 9.58% | -1.8 | 2.12 | 117% | -4.8% | 27% | 1.87% |
| Barings Global Short Duration High Yield | (BGH) | High Yield | -12.09% | 9.72% | -1.7 | 1.95 | 122% | -4.2% | 31% | 1.62% |
| Pioneer Floating Rate Fund | (PHD) | Senior Loans | -12.74% | 8.14% | -1.8 | 1.89 | 86% | -4.2% | 36% | 1.88% |
| DoubleLine Income Solutions Fund | (DSL) | Global Income | -10.71% | 10.88% | -1.6 | 1.86 | 116% | -14.5% | 31% | 1.50% |
Strategy statement
Our goal at the CEF/ETF Income Laboratory is to provide consistent income with enhanced total returns. We achieve this by:
- (1) Identifying the most profitable CEF and ETF opportunities.
- (2) Avoiding mismanaged or overpriced funds that can sink your portfolio.
- (3) Employing our unique CEF rotation strategy to “double compound“ your income.
It’s the combination of these factors that has allowed our Income Generator portfolio to massively outperform our fund-of-CEFs benchmark ETF (YYY) whilst providing growing income, too (approx. 10% CAGR).
Income Lab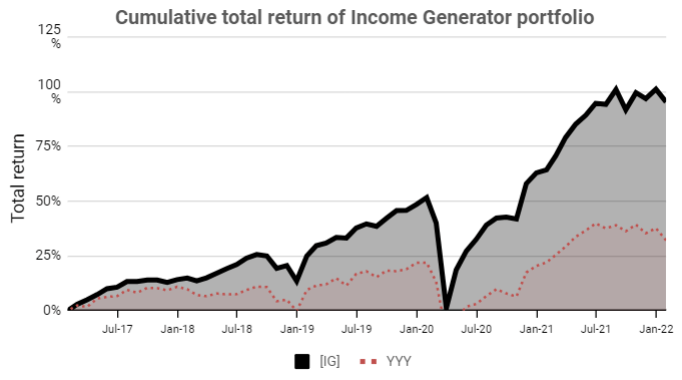
Remember, it’s really easy to put together a high-yielding CEF portfolio, but to do so profitably is another matter!
Be the first to comment