

takasuu/iStock via Getty Images
Previously we promised to “share extracts from our weekly reviews.” This article is part of that effort, and this is taken from analysis originally published for Wheel of Fortune’s subscribers on Dec. 13-14.
——————————————————————————–
No Santa Rally in Sight
Poof, and it’s gone.
Following a nice rally that spanned over seven weeks, the month of December – particularly last (trading) week – has been putting sticks in the wheels [Just to be clear: Not our Wheel!…]
Bloomberg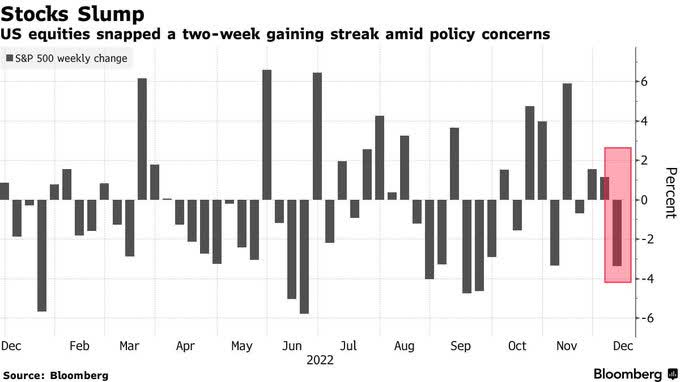
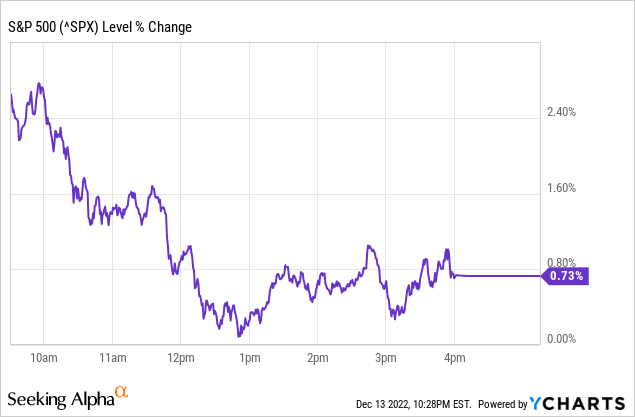
As a matter of fact, the recent rally was so strong that it nearly took the S&P 500 Index (SP500) from a bear-market to a bull-market territory within a blink of (baking) a (Thanksgiving/Halloween) pie.
Y-Charts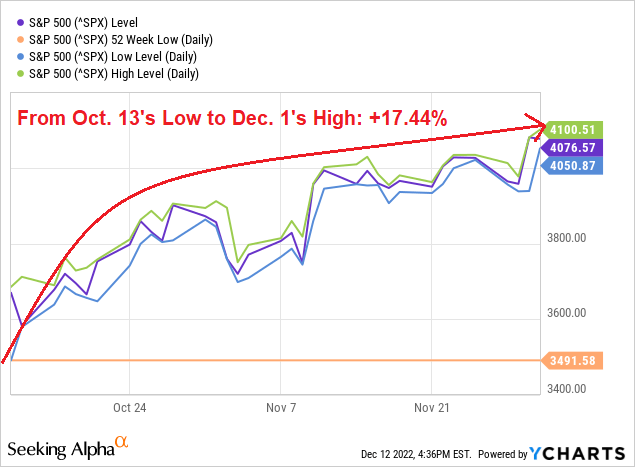
Recall that last week we warned that “Santa Doesn’t Like Bear Markets”:
Everybody is waiting for (and counting on) Santa to save this year, however it’s important to note that he tends not to show up during bear markets.
TopDown Charts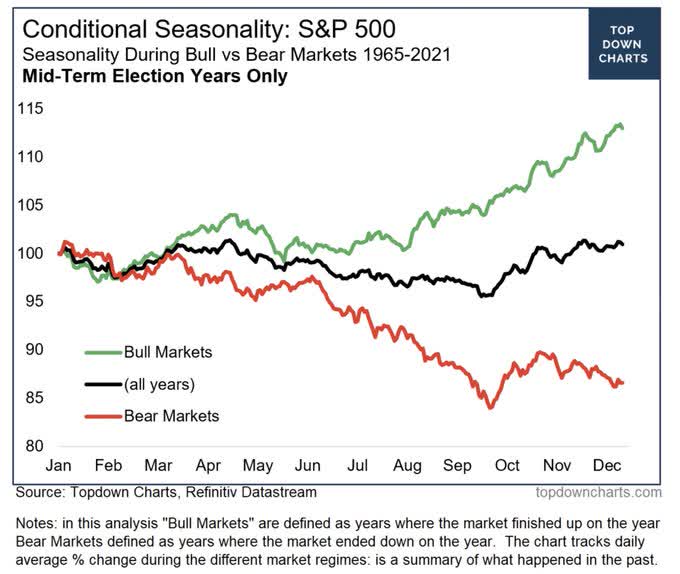
And indeed, looking at the MTD sector performance, it doesn’t look like Santa is anywhere near “StockMarket town” (at least) so far in December.
HedgeEye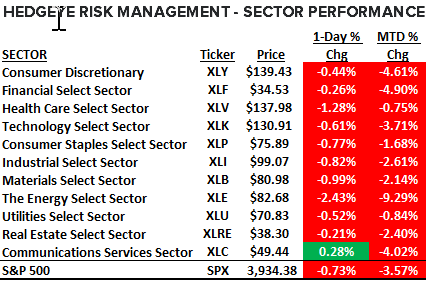
The December pullback has been broad-based, with (not only all sectors but also) 62 out of 68 industries within the S&P 1500 Index posting negative MTD returns.
Charles Schwab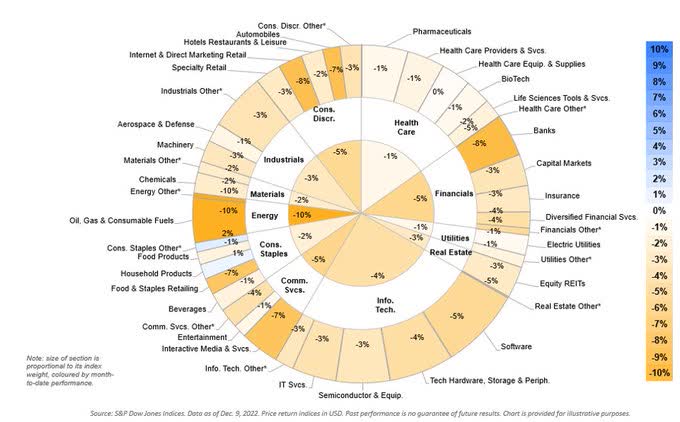
From a technical perspective, things keep looking weak/bearish.
Not only the recent rally (from mid-October to late-November) didn’t reach the (bullish) point of 50% retracement, but the yellow line remains a firm, long-term, resistance that the S&P 500 finds really hard to break through.
Bloomberg, Charles Schwab, Author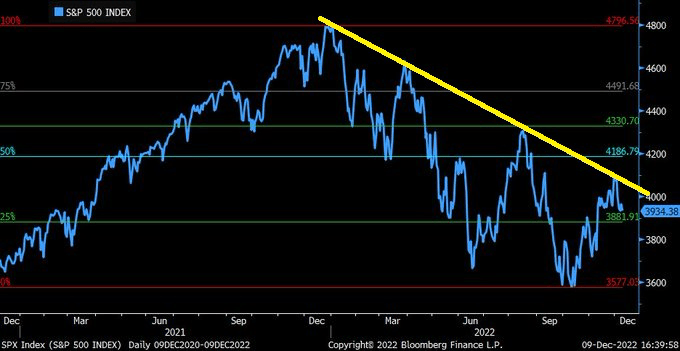
There were many landmines this year, and if you wonder how come the average retail investor (=not WoF/MTF subscriber of course!) is down 30% for the year – the following drawdowns (related to stocks belonging to the S&P 1500 Index) might explain the horrible performance:
- Average maximum drawdown (all stocks): -41.8%
- Average current drawdown (all stocks): -25.4%
- Average drawdown of worst performing (=1st) decile: -74.0%
- Average drawdown of best performing (=10th) decile: -19.0%.
Bloomberg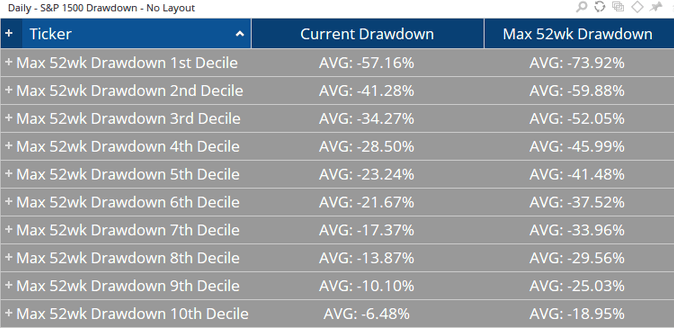
CPI Matters a Lot
Inflation data has been a major market driver this year.
The Average True Range (“ATR”) of the SPX over the last 7 CPI release trading dates has been nearly twice as wide as it’s (on average) for a non-CPI day.
Moreover, during the last 3 CPI release trading dates average ATR is circa 200 points, or ~5% daily-range assuming SPX ~4000.
Quatifable Edges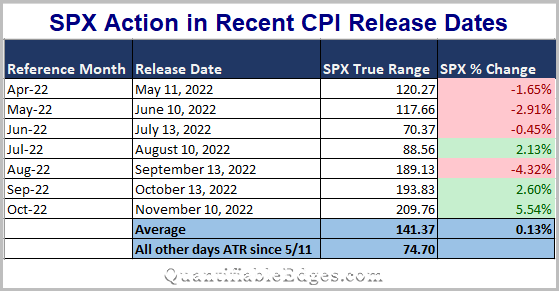
Let’s take a closer look at the past three CPI release dates:
- Sep. 13: Worse than expected CPI >>> Worst day for SPX in two years.
- Oct. 13: Worse than expected CPI >>> Futures initially tanked, however stocks recovered during regular hours staging one of largest intraday reversals in history.
- Nov. 10: Better than expected CPI >>> SPX had its best day in 2022.
Now you know why everybody is anxious ahead of tomorrow, with most everybody expecting some serious action and extreme volatility.
Anxious, but totally confused…
Bloomberg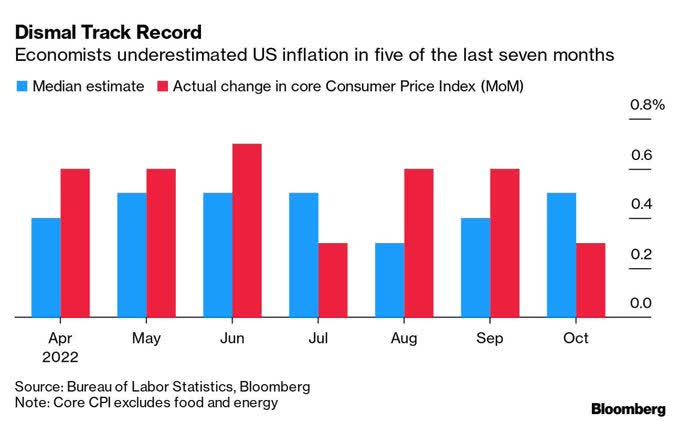
Never before have so many economists expected a recession in 2023 as they do today.
43.5% of respondents to the U.S. Survey of Professional Forecasters expect negative GDP growth one year from now.
You can look at this (recession) glass as being half-full because the majority of economists/respondents still (apparently) don’t expect a recession in 2023. However, the glass is also (at least) half-empty because 43.5% is by far the largest percentage (over the last 50 years) of respondents expecting a recession one year down the road.
The Macro Compass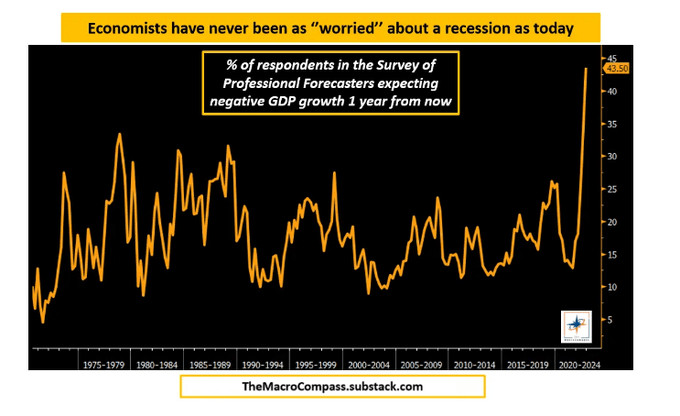
Here’s a reminder how U.S. inflation evolved over the last couple of months (CPI Y/Y change):
- October 2021: +6.2%
- November 2021: +6.8%
- December 2021: +7.0%
- January 2022: +7.5%
- February 2022: +7.9%
- March 2022: +8.5%
- April 2022: +8.3%
- May 2022: +8.6%
- June 2022: +9.1%
- July 2022: +8.5%
- August 2022: +8.3%
- September 2022: +8.2%
- October 2022: +7.7%
- November 2022: Consensus expectation is for a +7.3% Y/Y change.
Bloomberg consensus (separate survey) expects 7.2%.
Cleveland Fed inflation nowcast forecasts 7.5%.
Cleveland Fed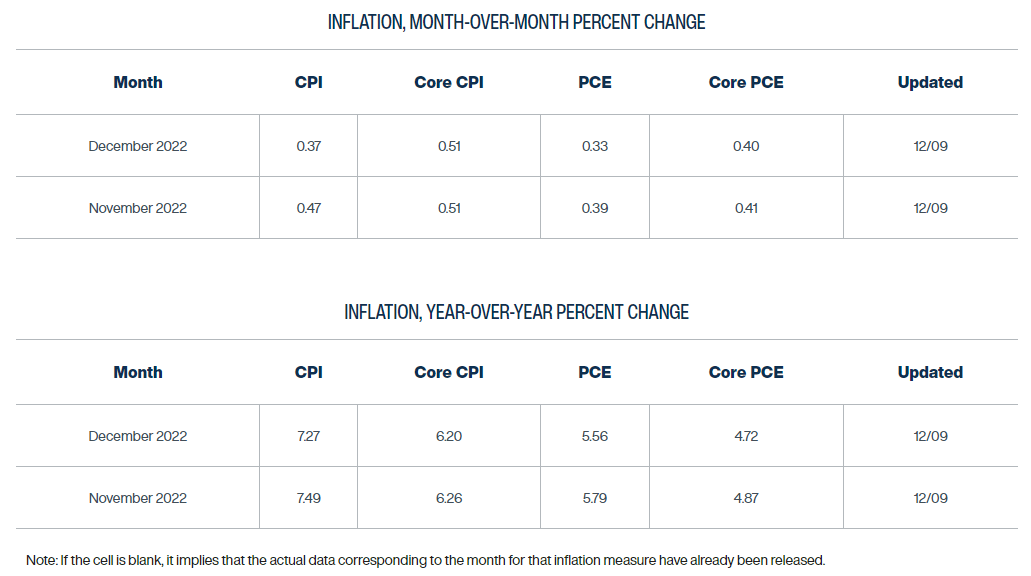
Note that last month’s actual CPI figure was the first downside surprise after 9 consecutive upside surprises compared to the Cleveland Fed estimate.
Cleveland Fed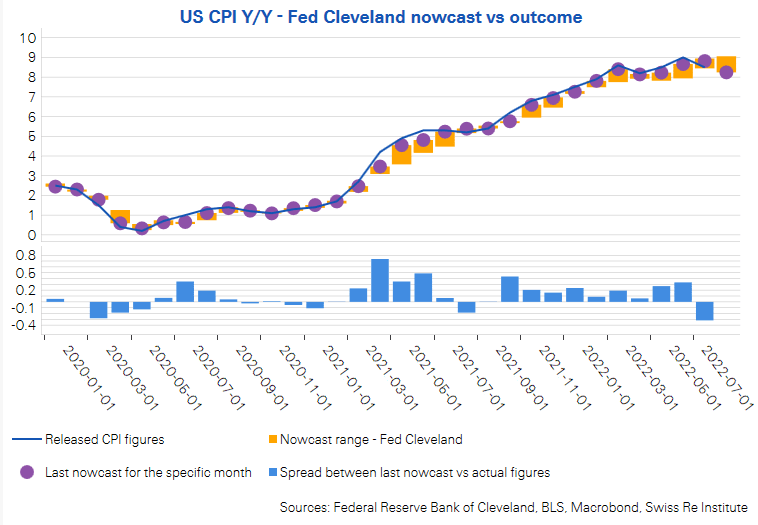
Based on a preliminary Michigan survey of consumers, forward 12 month U.S. inflation expectations fell from 4.9% in November to 4.6% in December – the lowest level in 15 months.
[Forward 5-year inflation expectations remained unchanged at 3%.]
Bloomberg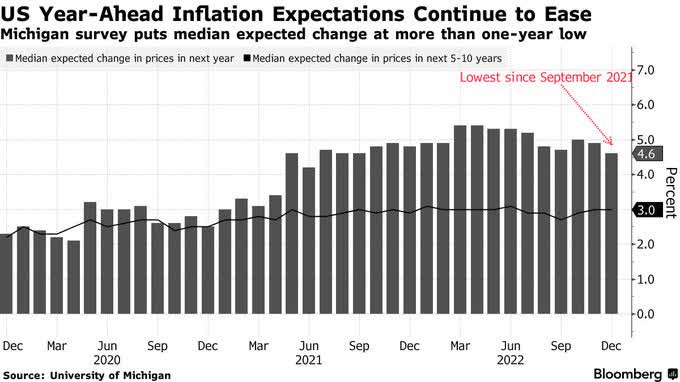
Remember: Historically, when inflation in a given year was lower than the preceding year, SPX climbed 12.6% on average.
When inflation was higher, SPX was up only 5.8% on average.
[Keep in mind that inflation in 2023 is expected/likely to be lower than that in 2022.]
Carson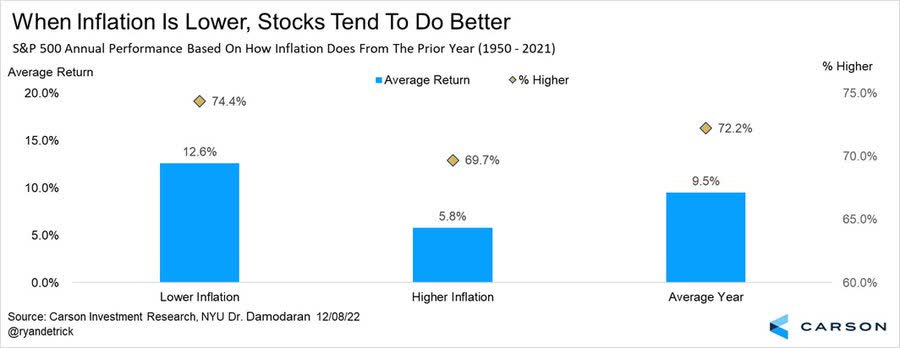
Speaking of lower expected inflation in 2023 vs 2022, it’s worth noting that although PPI figures (published last Friday) came in higher than expected, the trend of the 3-month Y/Y change is now running at the slowest pace in two years (since December 2020).
Charles Schwab, Bloomberg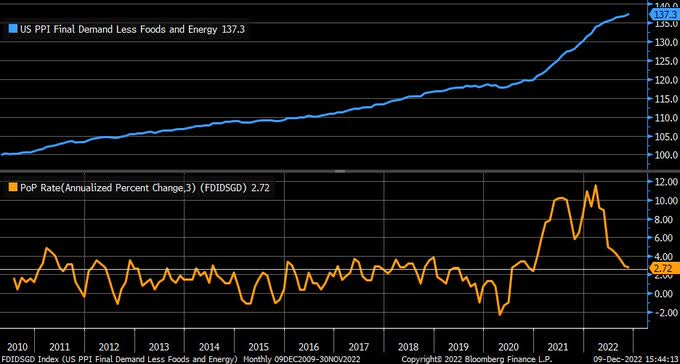
Furthermore, the PPI Manufacturing component fell again (by 0.3%) in November for the 6th-straight month.
We need to go back to 2019 in order to see the last time we had six consecutive monthly declines for this component.
Charles Schwab, Bloomberg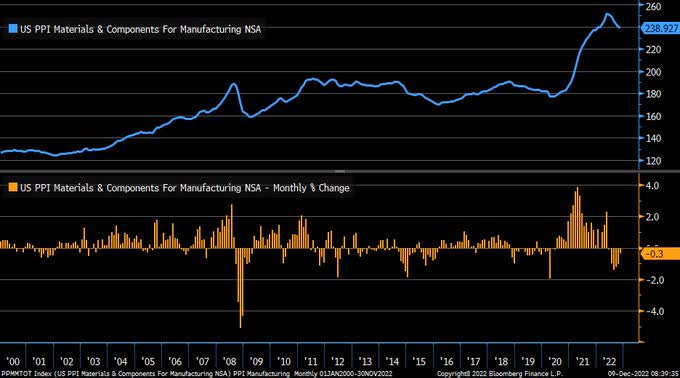
FOMC / Monetary Policy
Indeed, inflation looks like it’s easing, however the two most important questions remain open:
- Will inflation ease enough for the Fed to Pivot (=stop hiking rates and back off from further tightening steps) no later than the first 2023 FOMC meeting/decision (Feb. 1)? [Our answer: Not yet. We believe this is likely going to wait for the May 2-3 or even June 13-14 FOMC meeting]
- When inflation is going to be low enough for the Fed to start cutting rates? [Our answer: Not in 1H/2013 and we’re not certain that this is going to happen in 2023 at all]
This is probably the right moment to point out that as much as we’re focusing on inflation figures, we also have the FOMC meeting/rate decision on Dec. 14, November Retail Sales on Dec. 15, and various PMI gauges on Dec. 16.
So yes, CPI is likely going to be the highlight, but it’s certainly not the only economic release that would get our full attention this week.
Charles Schwab, Bloomberg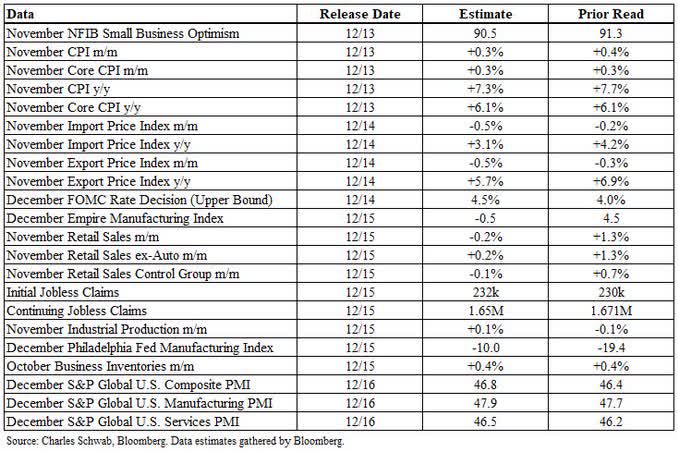
Investors bet that Fed Chair Powell will take the leg off the pedal even before 5%.
If they’re correct, we’re due for a 50bps hike this week (per consensus), another 25bps in January, and actually this is it. No more hikes then after.
Moreover, investors believe that shortly after Powell stops hiking he will start cutting quickly, all the way down to ~3%.
We think this is nothing but wishful thinking, showing how desperate so many investors are for encouraging news and how addicted they’re to QE.
The basis for this (delusional) hope is the expectation for such a deep recession that inflation will fall by a lot, very quickly.
Bloomberg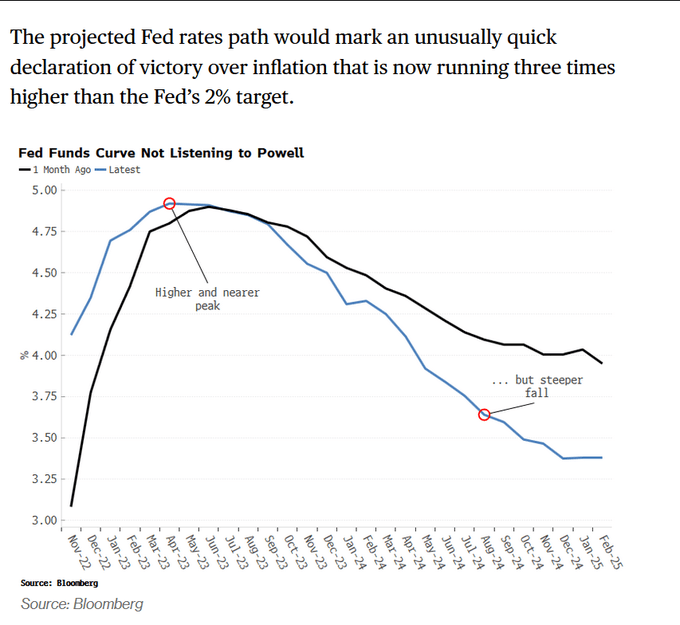
Think about it for a minute: The Fed got burned because they kept cutting rates for too long and too much without an economic crisis (aka “Wolf”) justifying this.
Then, when the “Wolf” came – rates were near-zero and there was nothing to cut from.
Powell is unlikely to make the same mistake again.
As long as inflation is way-too-high and as long as the U.S. isn’t in recession (“Wolf”) – there’s a good reason/justification for him to hike, and there’s no reason for him to cut.
Once the “Wolf” shows up (recession; lower inflation) – he will be able to cut a lot and very quickly, becoming the man of the hour and turning (again) into a hero.
Barron’s
Facts:
- Fed Funds Rate (“FFR”) hasn’t peaked yet [Everybody agrees with that]
- It takes, on average, 11 months from FFR peak to the first rate cut.
- The shortest gap was 5 months. Even if the Fed stops hiking on Feb. 1, 2023 and maintains such a short gap – the first cut won’t happen before 2H/2023.
Bloomberg![Fed Funds Rate ("FFR") hasn't peaked yet [Everybody agrees with that] It takes, on average, 11 months from FFR peak to the first rate cut.](https://static.seekingalpha.com/uploads/2022/12/12/saupload_FjwngDaXEAAfnml.png)
We’re sorry that we can’t bring you better/more encouraging news regarding how quickly we see a (significant) shift in monetary policy (from tightening to easing).
Nonetheless, in order to cheer you up a little bit, when we look at the upcoming rotation of voting members, it looks as if the FOMC is going to be slightly more dovish starting next month.
Pictet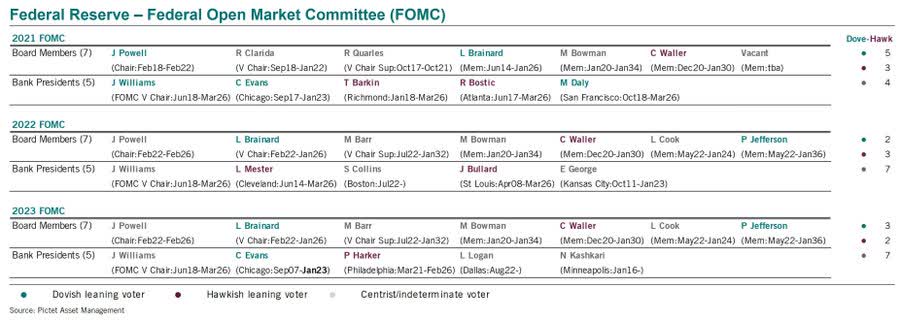
Having said that, we’re now seeing a Fed that is way more data-dependent than the one we saw prior to 2022 which was more popularity- and politically- oriented than data-dependent.
Therefore, the shift of one voter from the hawkish camp to the dovish camp is unlikely to shift the power (from Powell) or focus (from inflation).
Economic Data & Yield Curve Keep Pointing to Recession
Let’s start with the global Housing Market which is suffering from some of the largest Y/Y losses since the Great Financial Crisis (“GFC”).
BofA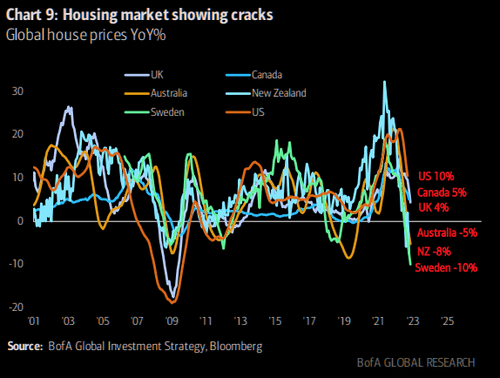
Taking into consideration how high mortgage rates already are – and how high they may climb if tightening policies aren’t coming to an end soon – the housing market seems vulnerable to further downside.
At the end of the day, something – either rates or house prices – gotta give, i.e., move down; a lot… [And yes, you guess right if you think we bet on the latter more than on the former].
JPM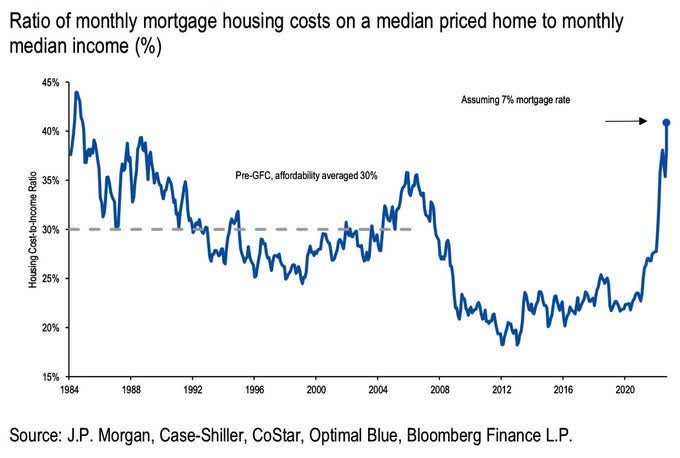
As for the job market, all we have to say is: “Wait for it. It’s going to be legendary (in a bad way).”
I mean, isn’t it already?…
Spoiler alert: Look at the November bar with heavy guns like Meta Platforms (META), Amazon (AMZN), and Twitter (TWTR) making very disturbing noises.
Unfortunately, more – correction: much more – is on its way.
Visual Capitalist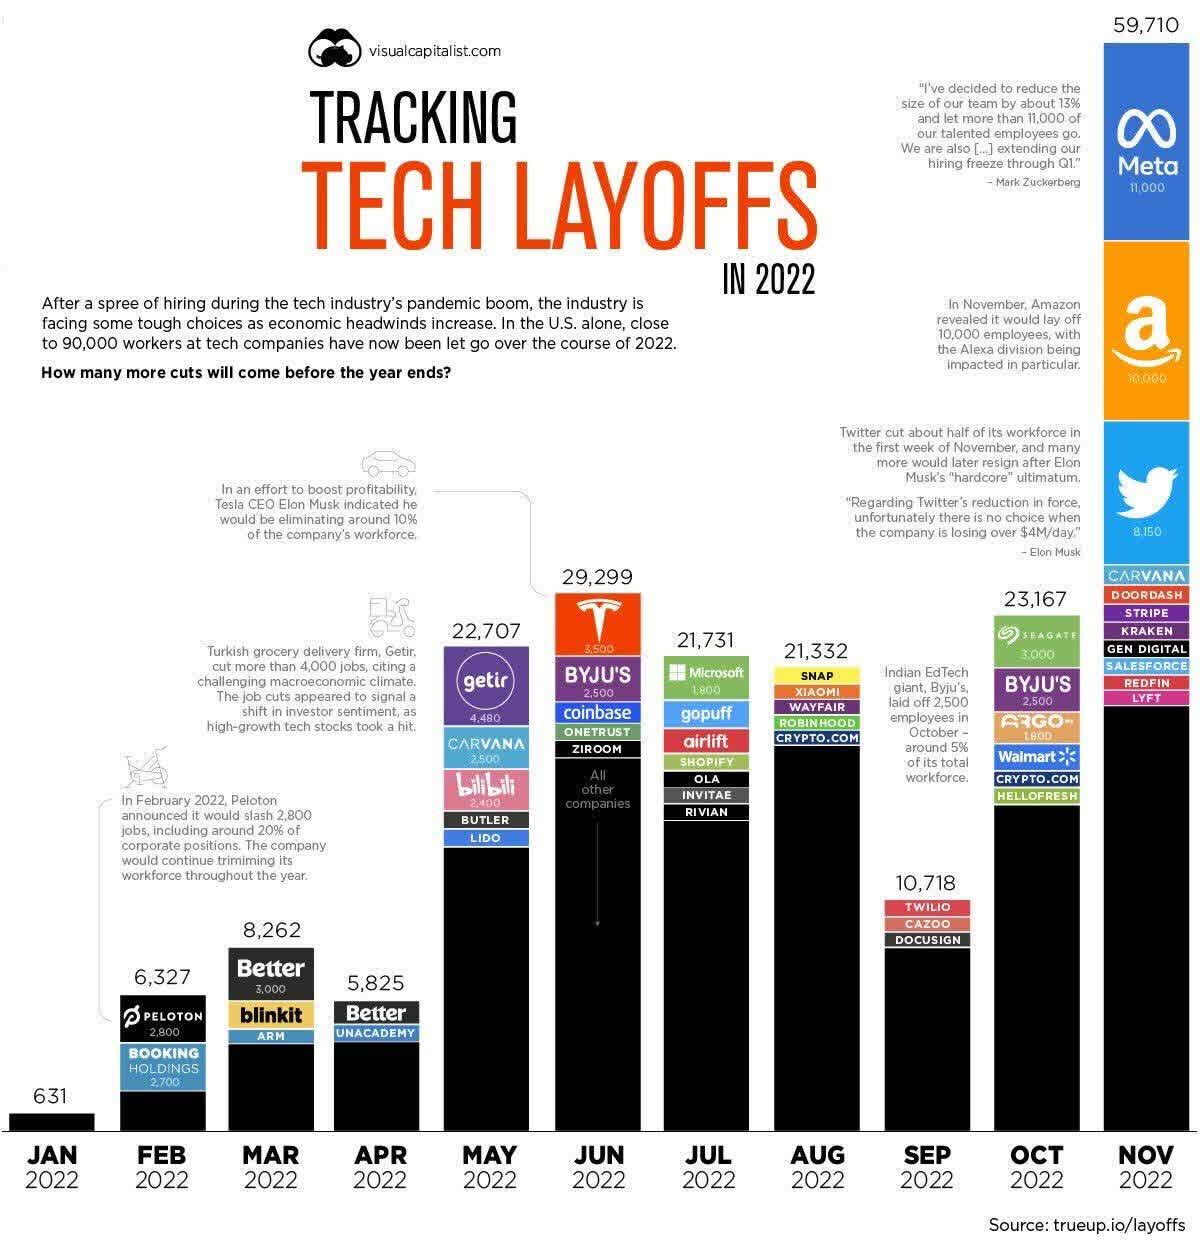
Both “leading indicators” and “coincident” gauges already triggered the “recession probability” barometer, suggesting that a recession is now a matter of when (only a few months down the road), not if.
Taking into consideration that these gauges haven’t delivered a false signal in over 50 years – it looks as if the odds of the U.S. entering a recession are now way greater than 50%.
RecessionAlert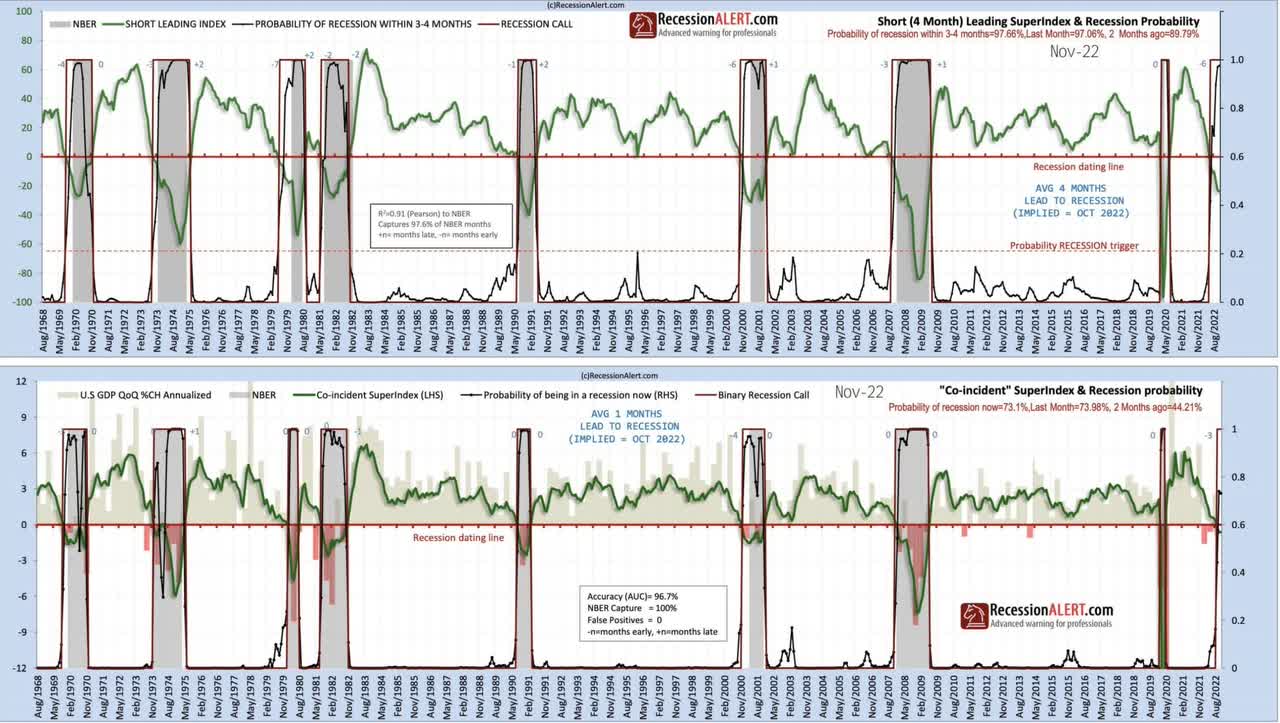
50%!? How about ~80%?…
That’s the probability of a recession over the next 12 months, based on the 3-month/10-year U.S. Treasury spread.
Barclays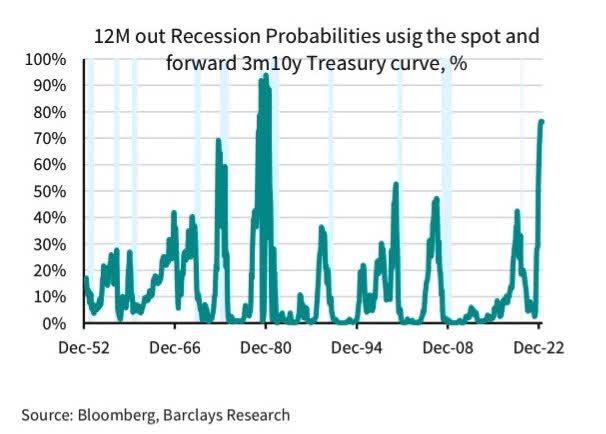
Speaking of the 3-month/10-year US Treasury spread, it’s remarkable how fast this spread (orange line) has caught down with the 2-year/10-year US Treasury spread (blue line).
Charles Schwab, Bloomberg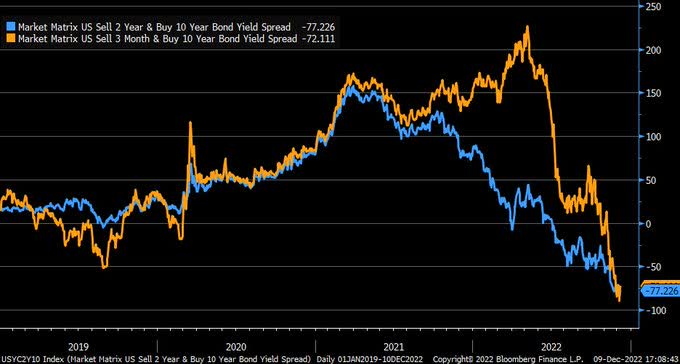
Recall that over the past seven recessions, the 3-month/10-year spread has turned negative 15 months, on average, before an actual recession started.
Moreover, this spread hasn’t given a false signal as other parts of the yield-curve have (occasionally).
Bloomberg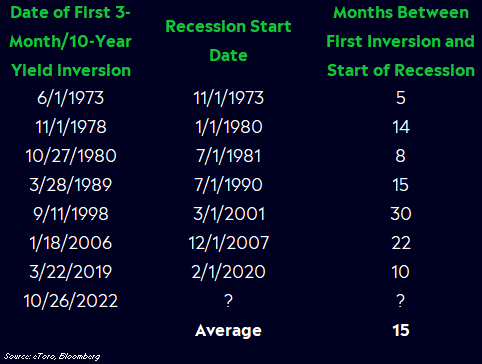
Inflation Day Behind, FOMC Day Ahead
This article isn’t meant to be about the lower-than-expected CPI data, but we can’t ignore what turned out to be a fascinating trading day.
Therefore, let’s dedicate the opening chapter to yesterday albeit with a look/implication for today.
“CPI Day” promised to bring extreme volatility to the stock market – and it did, however nowhere near the 4%-5% move up that JPMorgan forecasted for a +7.1% Y/Y change.
JPMorgan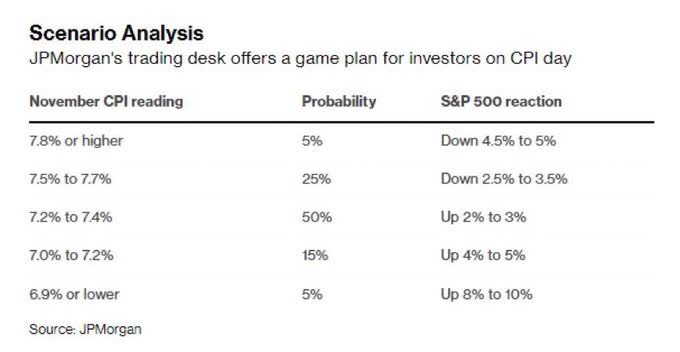
It was a weird trading day yesterday with the main stock indices starting very strong (SPX and NDX up nearly +3% and 4%, respectively) but fading away into the session.
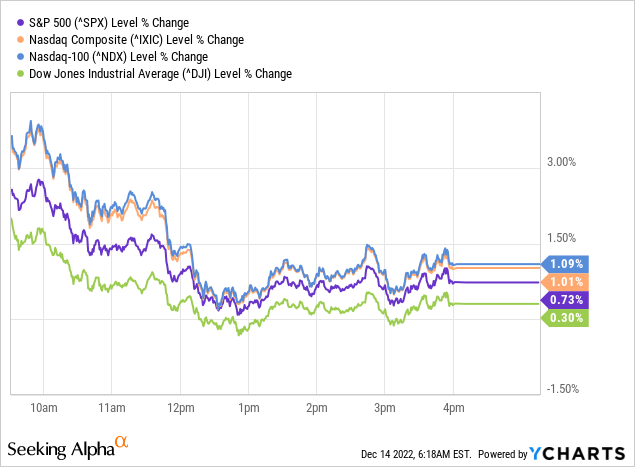
While the DJIA even turned negative at some point, SPX barely managed to escape a similar fate and yet – losing >2.5% intra-day isn’t something we see every day.
As a matter of fact, it’s quite a rare event.
Here are all the trading days in which SPY started the day higher by at least 2% and finished with a daily return of only 0%-1%.
Pay attention to the only two December dates (on the table) that accidentally (or not?…) fall in the years 2000 and 2007. We trust you recall what came next back then…
Steve Deppe, CMT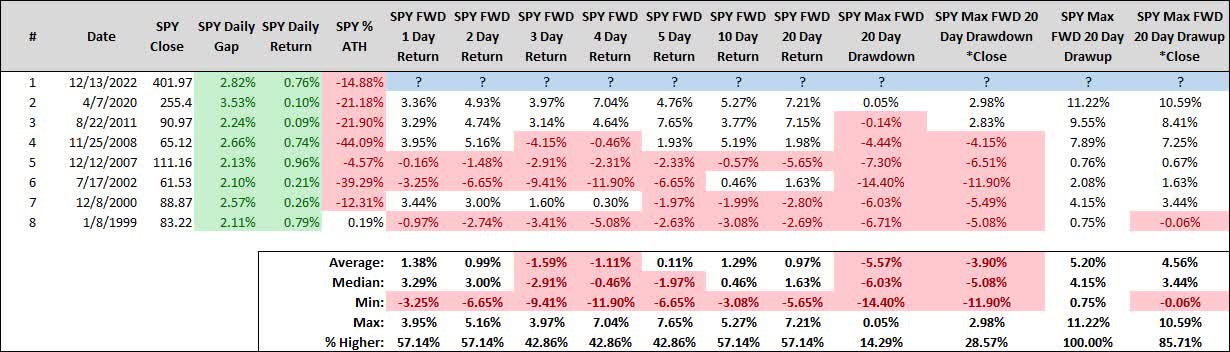
Despite the encouraging inflation report, and in-spite of an intra-day move above the downtrend line, another S&P 500’s attempt to break & stay/close above its year-old resistance has failed – a sign of technical weakness.
Jesse Colombo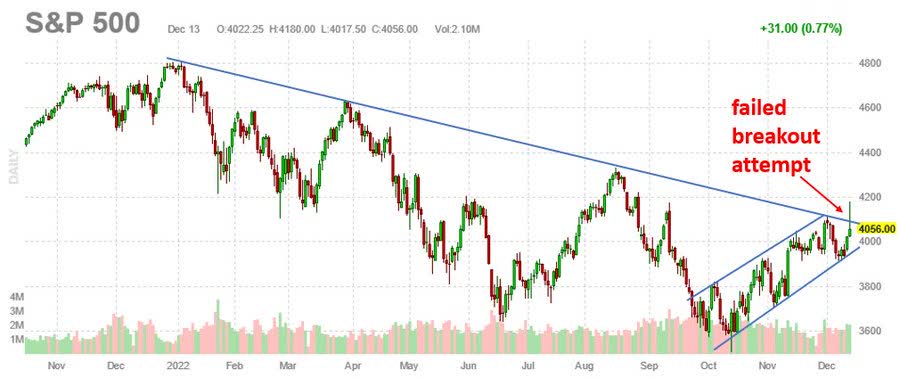
As we keep saying over and over again: At the end of the day, Macro Trumps Micro; the ‘Big Picture’ (e.g., Monetary Policy) is way more important than small, short-lived, events (e.g., slightly better than expected monthly inflation figures within a broader context of a much higher than normal inflation rate).
Give investors enough (Easing) hope – and even the worst company flies. Feed investors with (Tightening) despair – and even the best company tanks.
Although the ever-lasting goal is to create a whole greater than its parts, we mustn’t forget that the whole matters more than its parts.
It was (an expected) 50 bps (rate hike) prior to CPI data and it remains 50 bps post the release (79.4% chance for 50 bps).
CME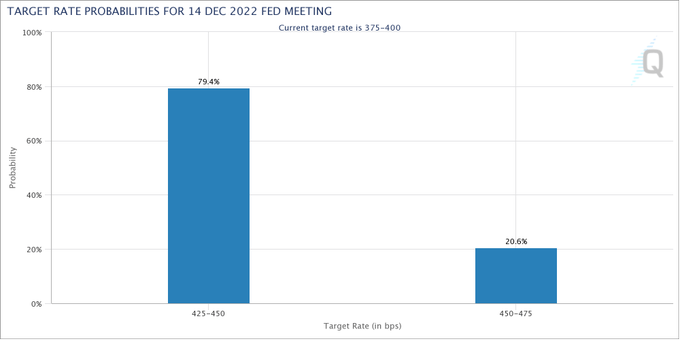
Similarly, Powell’s speech (according to our expectations) would be leaning hawkish prior to CPI data and it remains so post the release.
Too many people don’t (or refuse to) understand that the Fed’s only goal (right now) is inflation and +7.1% Y/Y isn’t going to stop anyone – surely not Powell – from keep trying to kill it.
Keeping stocks down is a major building block in bringing inflation down. It’s as simple as that.
Smaller doses (of rate hikes) and lower pace? Sure, but not yet backing off from tightening and surely not shifting into easing.
And just to be clear: Smaller rate hikes ≠Pivot.
While CPI Y/Y went down to “only” 7.1%, the (upper end of) Fed Funds Rate (“FFR”) is only 4.0%, and likely going to 4.5% today.
Over the past eight tightening cycles the Fed didn’t stop hiking rates before the FFR was higher than CPI Y/Y change.
We are getting closer, but we’re nowhere near equilibrium!
Carson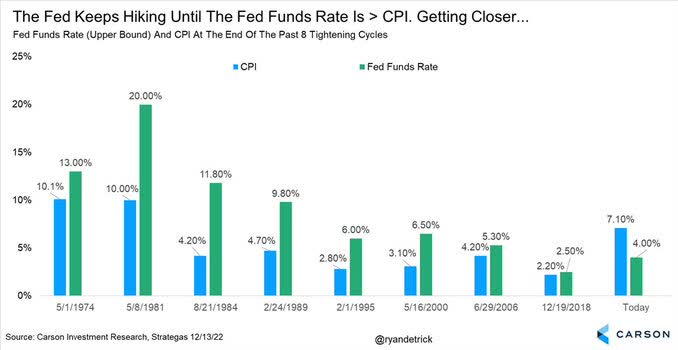
Just like yesterday, there’s a potential for higher/extreme volatility today.
Based on SPX action during this year’s Fed rate hiking days investors can be both optimistic and pessimistic.
Optimistic because the average daily gain (across all six days) is +0.85%.
Pessimistic because following the last two FOMC meetings stocks sold off on both the rate hike day (-2.1% on average) as well as on the next day (-1.0% on average).
Carson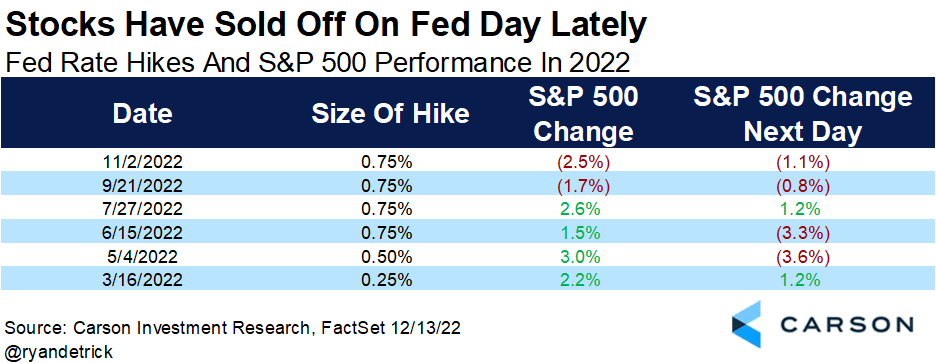
Side note: High volatility is also a result of positioning and it seems like everybody and their mother is currently moving to one (=the “BEAR”) side of the boat.
Not only has the 30-DMA of CBOE Equity Put/Call Ratio moved up like crazy over the past year, but it’s currently at the highest level since April 2020 (peak of COVID panic). Prior to that, we saw such a high level in December 2008.
Bloomberg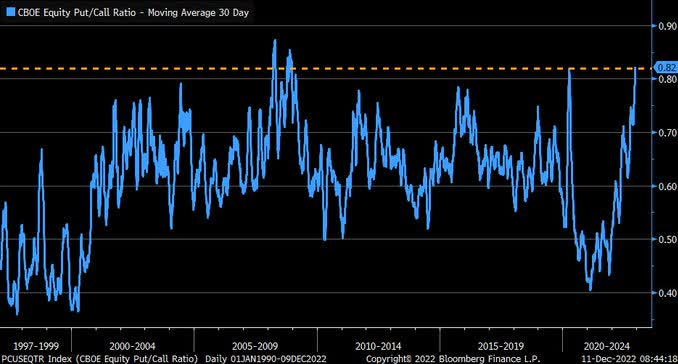
Thing is, there are very good reasons to be bearish.
At the start of this trading week:
- Only 6 sectors were above their 200-DMA (mediocre sector breadth).
- Only 3 sectors had a rising long-term price trend.
- Only 1 sector was above its August high.
Willie Delwiche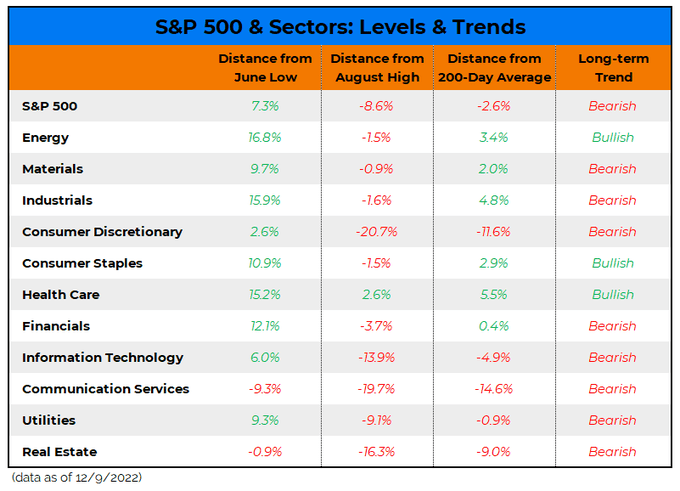
Taking into consideration that 100% of SPX gains over the past 24 years have come when >=9 or <=1 sector/s traded above their 200-DMA – the current situation (6 sectors above 200-DMA) doesn’t bode well for bulls.
Willie Delwiche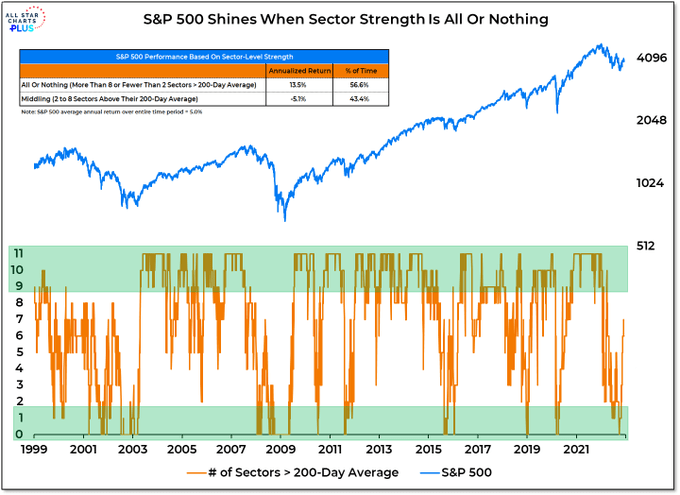
Where is S&P 500 Heading to From Here?
First and foremost, stocks are not cheap.
Sure, we can strip Big Tech out and suddenly everything look much better
S&P 500’s TTM P/E is ~21.8x.
With the 10-Year US Treasury Yield (“UST10Y”) at ~3.45%, that multiple falls in the 86th percentile, suggesting we’re still in “too expensive” territory.
SoFi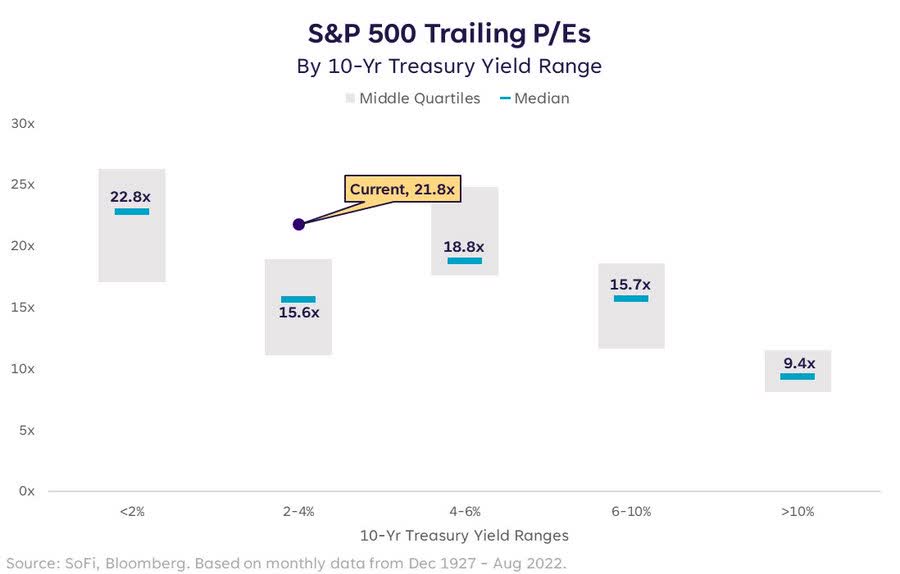
Historically, SPX bottomed (on average) only after the start of a recession.
Therefore, if a recession is upon us in 2023, a new bear-market low is likely still ahead of us.
Ned Davis Research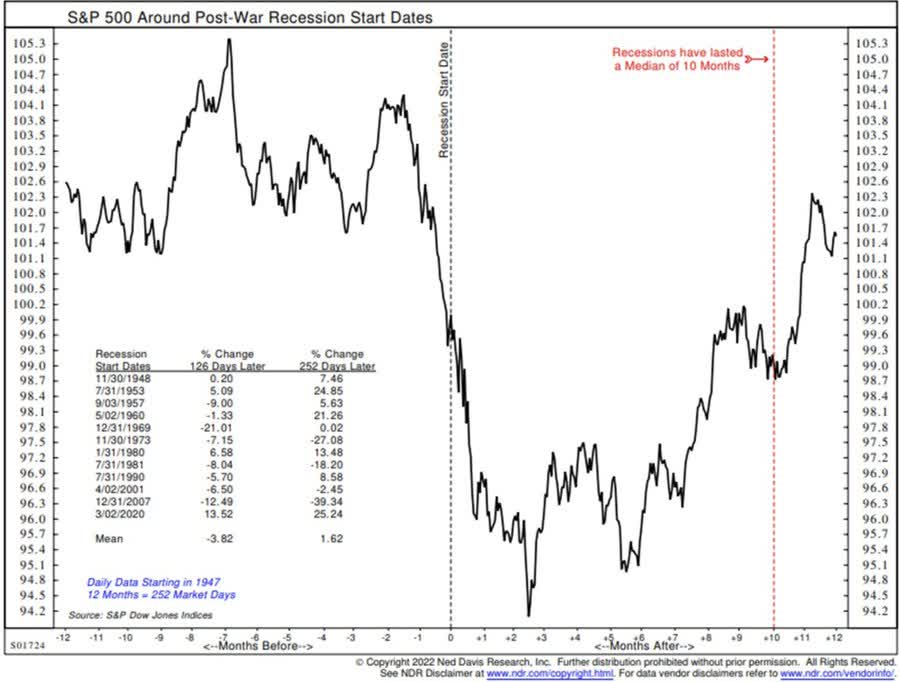
How low can a “new bear-market low” be?
Well, [IF and WHEN,] it’s quite likely for the SPX to head south all the way down to the 3000-3200 area.
IF and WHEN stocks “decide” to dig themselves a new low, 3000-3200 isn’t only a reasonable target fundamentally (=EPS ~$200 X ~15x-16x Multiple) but surely technically.
- 3000 is exactly where the very long-term, uptrend, support line is.
StockCharts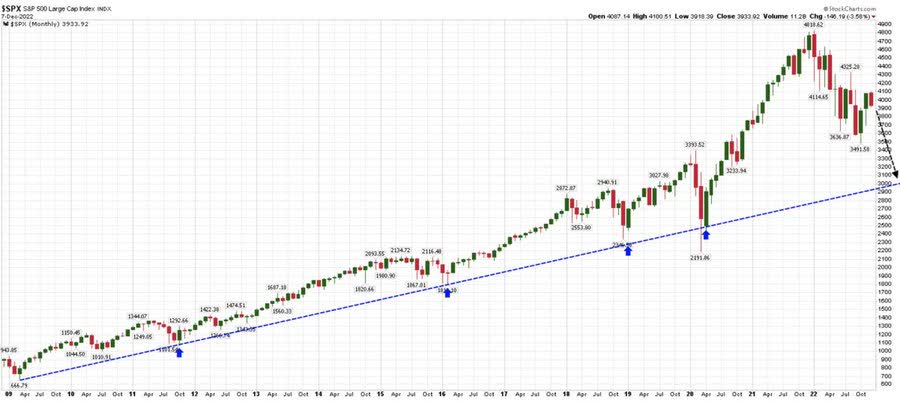
- 3000-3200 is roughly where the SPX may land if it moves from the upper end to the lower end of the downtrend band.
StockCharts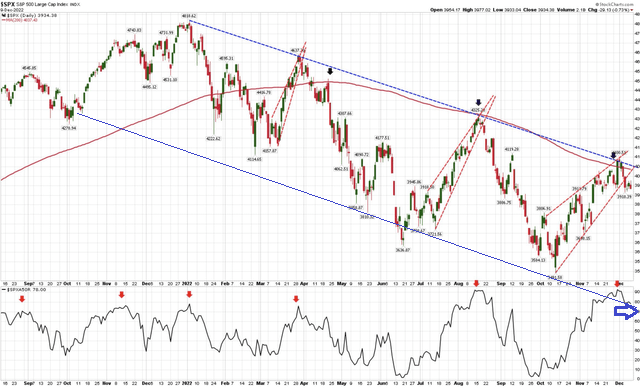
- 3200 is the where the SPX finds support on the weekly chart (if and when 3400 breaks down)
TradingView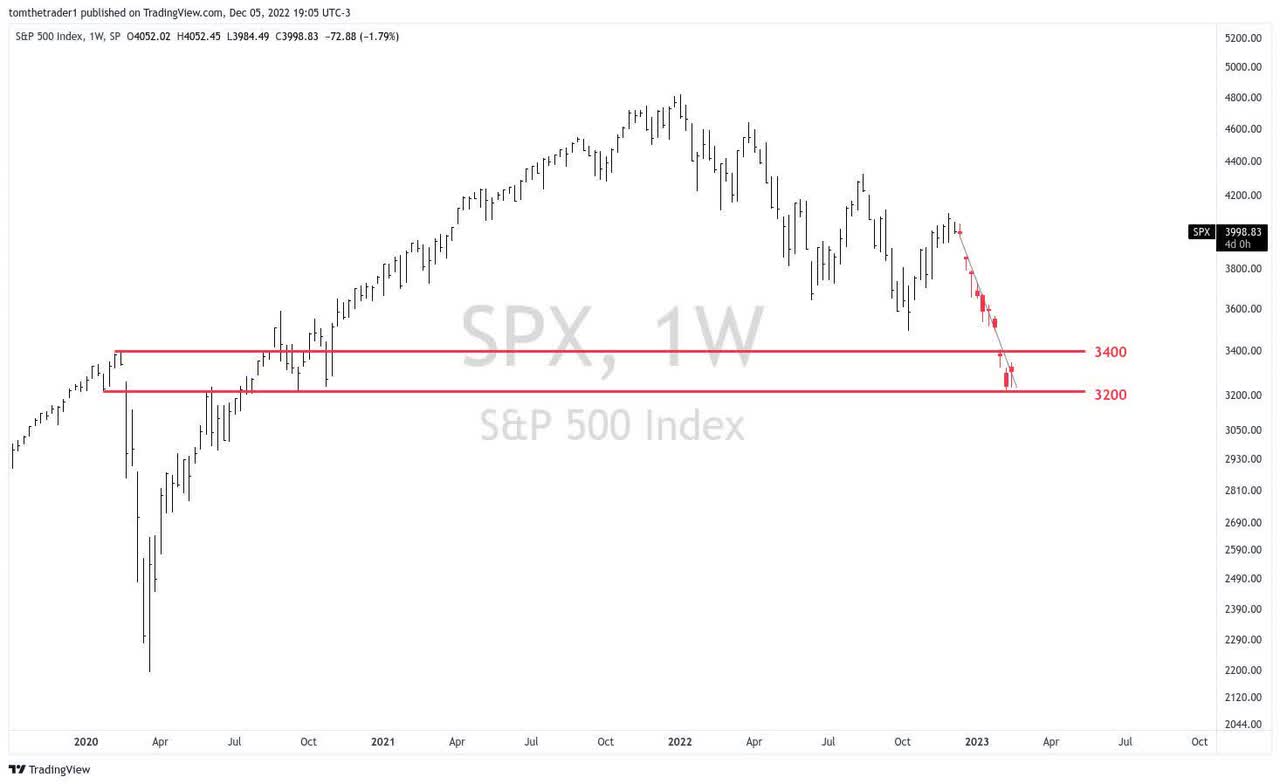
Wall Street is still expecting (=hoping for) decent 2023 earnings that will lead to a stronger stock market.
Current consensus year-end (“YE”) target is 4493.50, implying an upside of about 12% from current level.
Keep in mind that looking over the past 20 years, analysts’ YE targets for SPX have overestimated actual closing levels by ~8.3%.
FactSet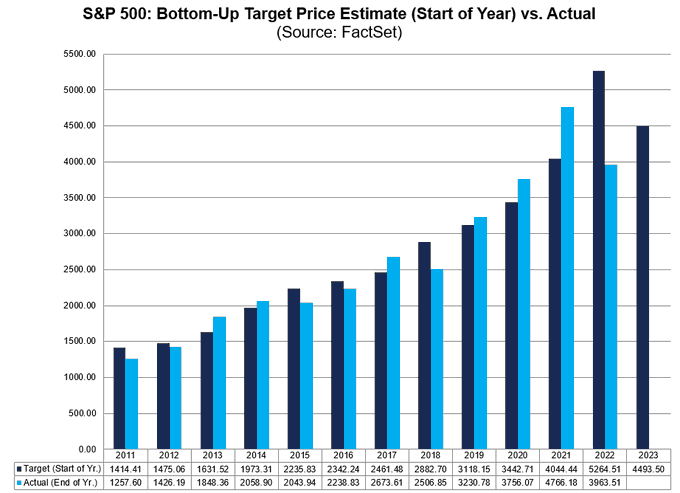
Moreover, when we say “consensus” this time round it should be noted that there’s little consensus in the “2023 consensus” with strategists’ SPX targets exhibiting their widest dispersion since 2009.
What do we learn from this?
- Tons of (=way more than usual) negativity and volatility are priced into next year’s projections.
- If it’s unwise to pay (too much) attention to such projections in an average year – it’s less wise (perhaps pointless) to pay (even little) attention to projections related to 2023 – a year with an unusually high “explosive” potential.
Bloomberg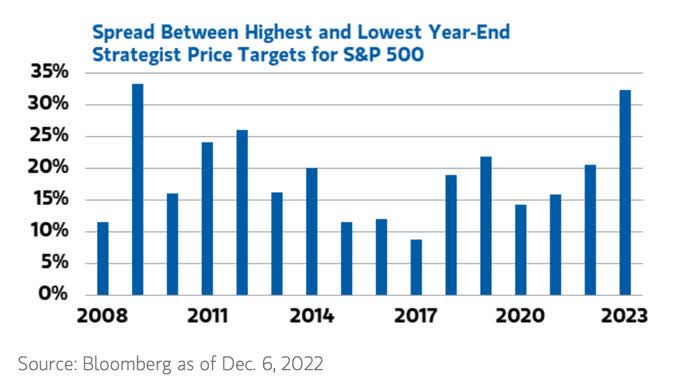
Similarly to SPX, Nasdaq 100-Index (NDX) needs to decline 20-25% to reach low multiples similar to previous bear-markets, e.g. 2015 and 2018.
Forward P/E of 22x is cheaper than the ~30x from a year ago, but it’s not yet attractive.
The top multiple of the “Taper Avenue” is ~23x (versus 22x right now) but SPX EPS downgrades are likely to be significant over the next few months.
During previous earnings downgrade periods SPX traded with multiples of 16x (in 2015) and even 13x (in 2012) so there’s a long way down to go in order to be/buy on the safe side.
Morgan Stanley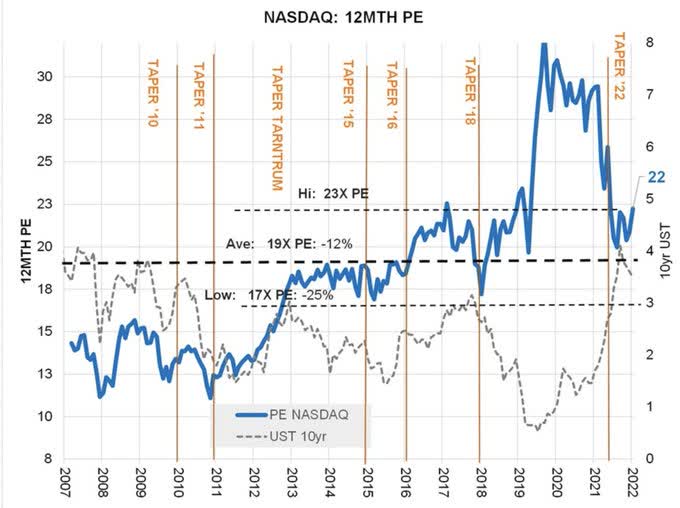
An Economic Slowdown, Let Alone Recession, is NOT Priced into Earnings Forecasts
Although there’s a decent probability for 2023 EPS to decline ~20% (in line with previous recessions) to ~175, Wall Street is still forecasting $230 (+4%) SPX EPS for next year.
Given where rates are (and heading) as well as based on history, SPX is unlikely to bottom before we get to 14x-15x forward P/E.
Now, close your eyes for 10 seconds… $175 X 14x-15x = 2450-2625 (!!!)
Even under a more optimistic scenario (you may open your eyes now), we get to SPX at ~3000 = $200 SPX EPS in 2023 X 15x Forward P/E
As a matter of fact, we’re seeing the exact same story throughout the year: While Retail FOMO investors are buying, institutional investors are selling.
Peak inflation is yesterday’s news (literally and figuratively). After all, inflation has declined (as one would expect) and the Fed has cut rates (as one would expect) during every recession in modern history.
The story in 2023 will be economic downturn (recession?) and earnings decline (crash?) which hasn’t yet been priced in at the index level.
Despite falling inflation and rate cuts, stocks fell during each and every single downturn and only bottomed after a recession started.
At the moment, recession is a high likelihood scenario (perhaps inevitable) and downward earning revisions is a near-certainty scenario for 1Q/2023.
Bloomberg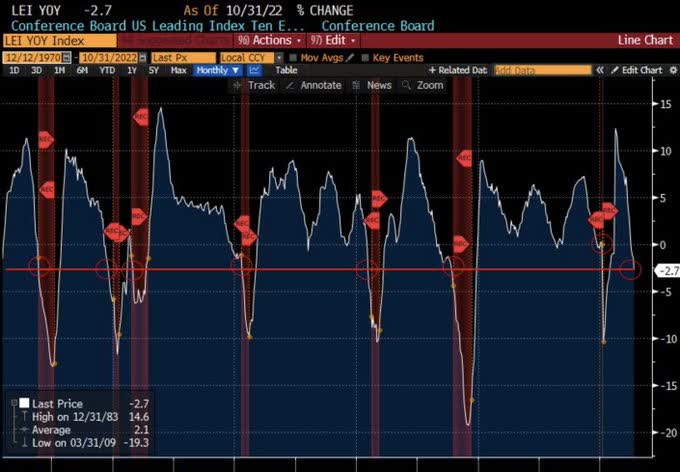
Duncan Leading Indicator, which is the ratio of real durable goods spending and fixed investment to real final demand, is also flashing recession.
Haver
As we all know (from the happy QE days), liquidity drives stocks.
And right now, liquidity is evaporating: Fed is hiking rates at an unprecedented pace/magnitude, U.S. total credit Y/Y growth has turned negative, and QT (=shrinking the balance sheet) is ongoing.
Do the math yourself.
Longview Economics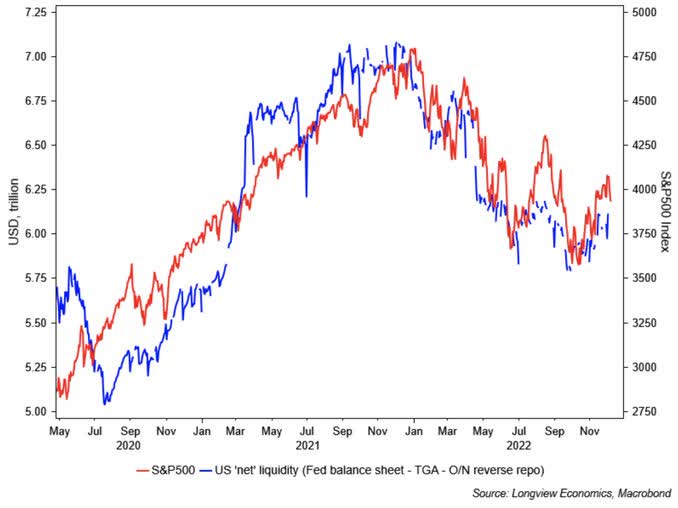
Such a pace of tightening as Financial Conditions are going through these days has always led to a recession.
Hedgeye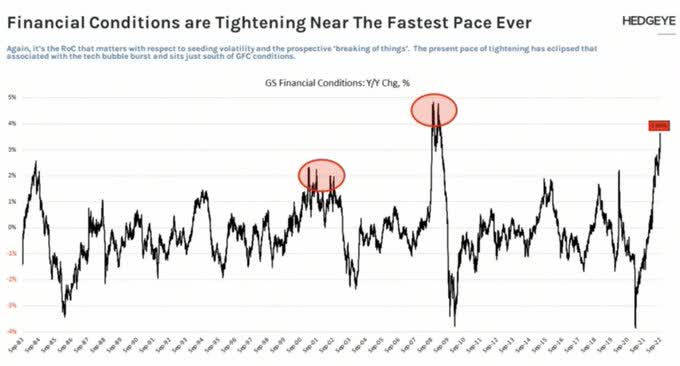
As always, there’s no one who explains the bearish side of things better than Morgan Stanley’s (MS) Mike Wilson:
“The ERP today is just 225bps. Back in Aug 2008, the ERP was 380bps, arguing the market is more mispriced today than back then for the earnings revisions we think are ahead…Our expectation for SPX price low in Q1 is in the 3000-3300 range.”
Morgan Stanley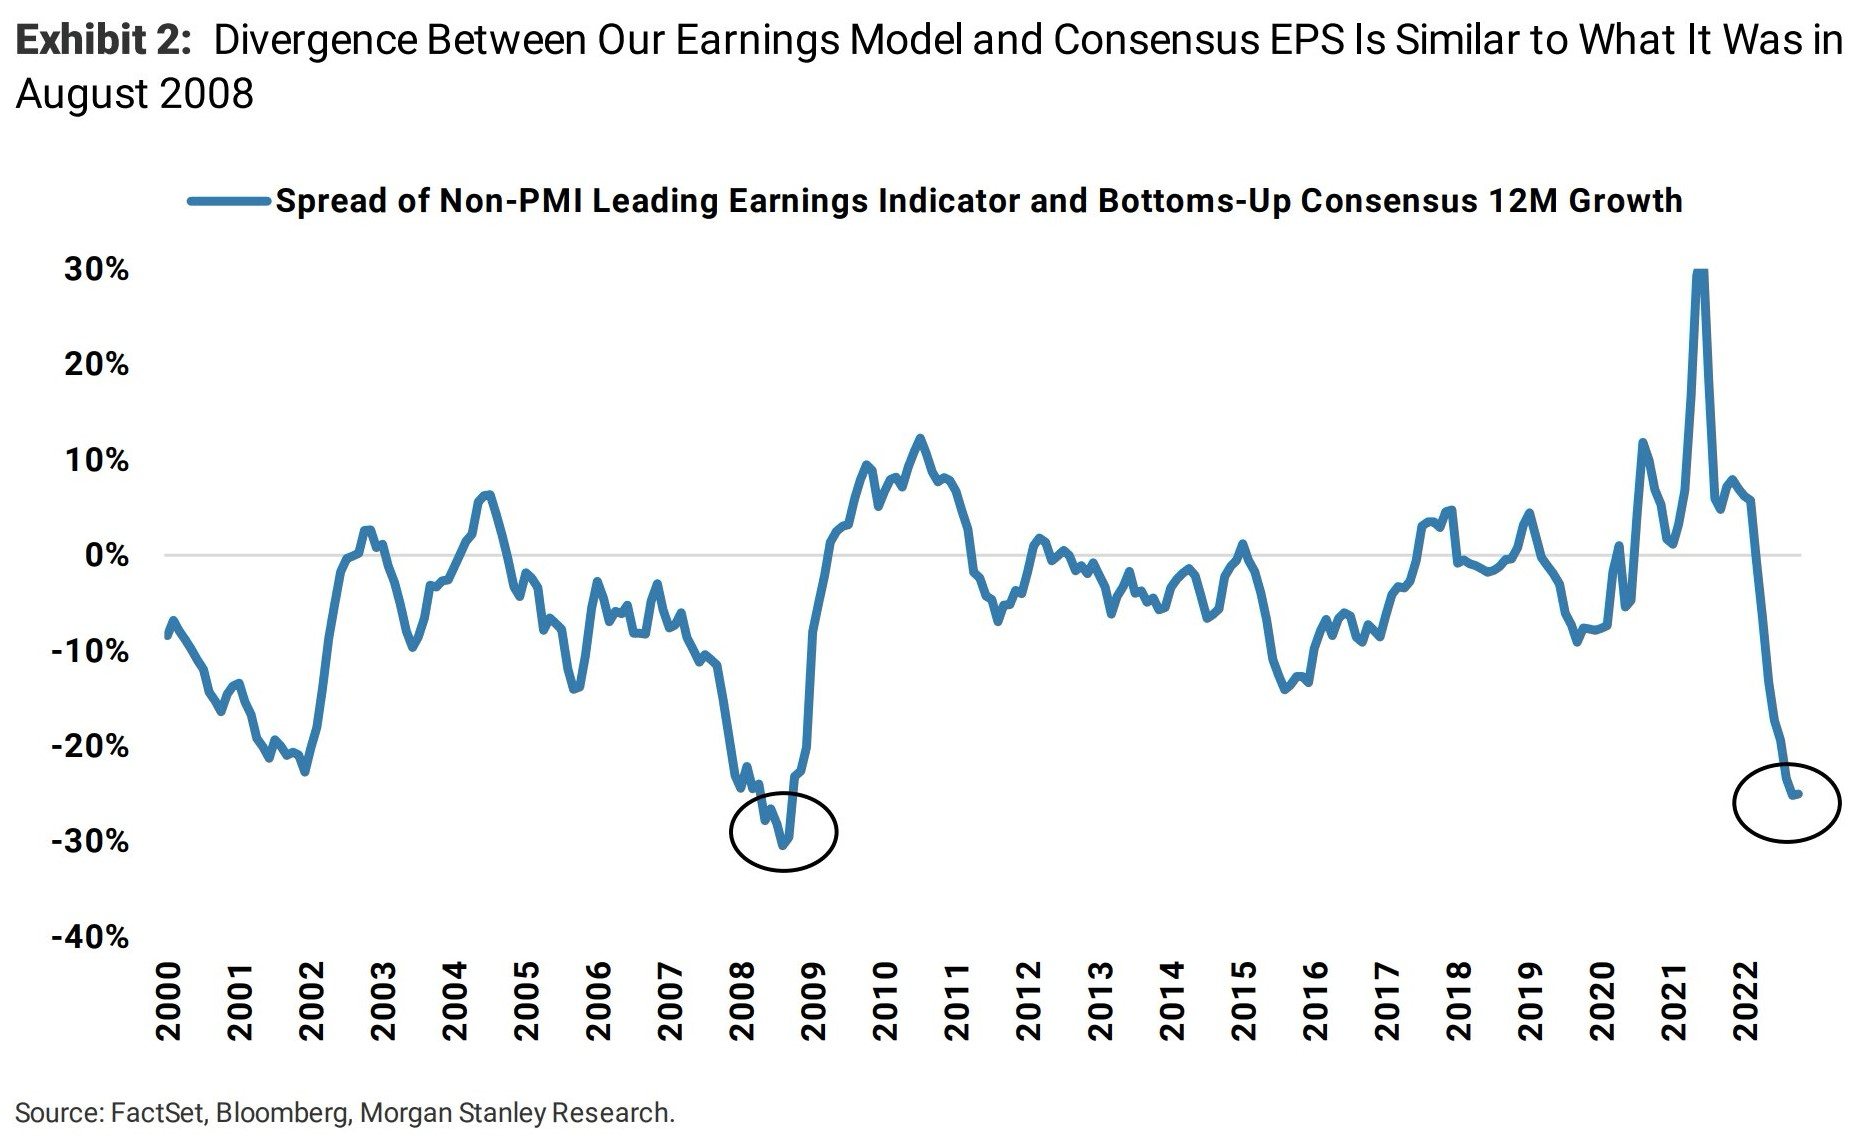
Downward earning revisions have barely begun, and MS already expects SPX EPS 2023 to decline ~20%.
Bonds vs Stocks
Bonds, just like stocks, have been beaten-up this year, which is a highly unusual outcome.
Right now, the traditional 60 (stocks)/40 (bonds) portfolio is suffering its 2nd-worse Y/Y return with data going back all the way to 1950. Only in 1974 60/40 investors suffered more than they do this year.
Paul de Jong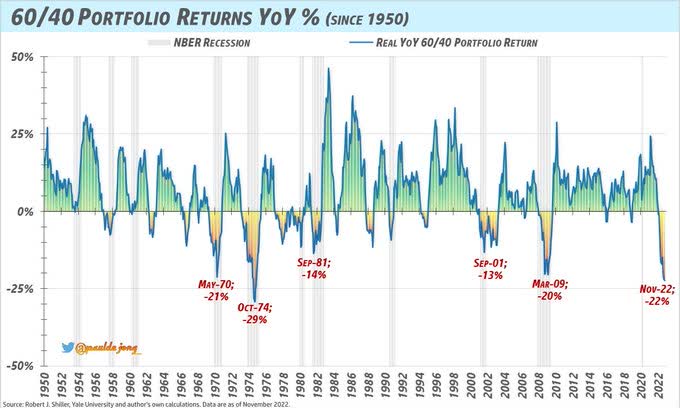
If 2022 is a very rare year for the bonds+stocks combination, it’s extremely unlikely for 2023 to be (just as) bad too.
As for the question which of the two asset-classes bounce back at all, or more) – you already know that our (variable) vote goes to bonds (until further notice, of course).
Bloomberg, Lombard Odier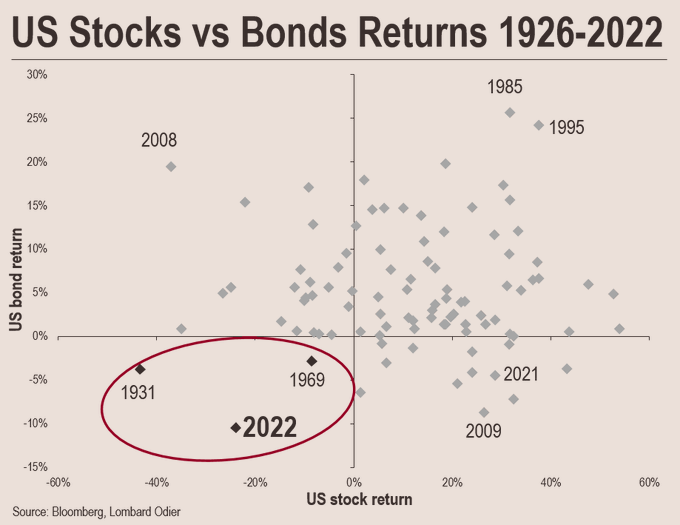
Having said that, along with the recent equity market recovery we also saw a credit market recovery. Over the past 35 trading days (ending on Dec. 9), the iShares Core U.S. Aggregate Bond ETF (AGG) delivered a total return of 6.2%.
As you can see below (upper chart), this is quite an out of the ordinary performance for this exchange-traded fund (“ETF”) over such a short period.
StockCharts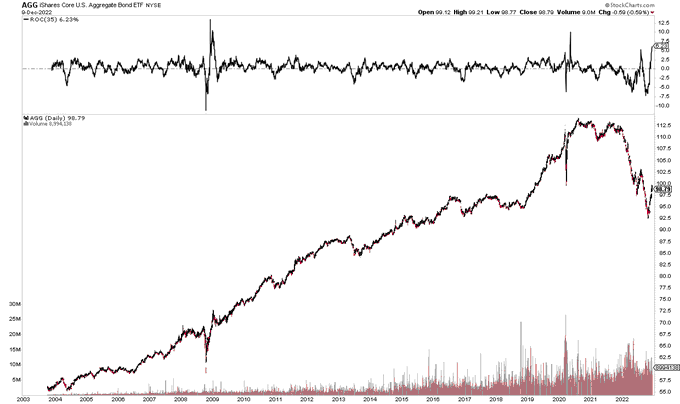
Probabilities for More Losses in 2023
If we hit an average recession in 2023, here’s what we should expect:
- Length of recession: 13 months.
- From the start of a recession until market bottom: 8 months.
- From market bottom until end of recession: 5 months.
- Probability for stocks to bottom during the recession: 86.7%
- SPX performance: -6.4% [Past 3, all in 21st century, recessions: -13.5%].
Schroders![If we hit an average recession in 2023, here's what we should expect: Length of recession: 13 months. From start of recession until market bottom: 8 months. From market bottom until end of recession: 5 months. Probability for stocks to bottom during the recession: 86.7% SPX performance: -6.4% [Past 3, all in 21st century, recessions: -13.5%]](https://static.seekingalpha.com/uploads/2022/12/14/saupload_FjuK7G1WIAIwSxQ.png)
Although the risk for a back-to-back down year is only 9% – never say never!
Ben Carlson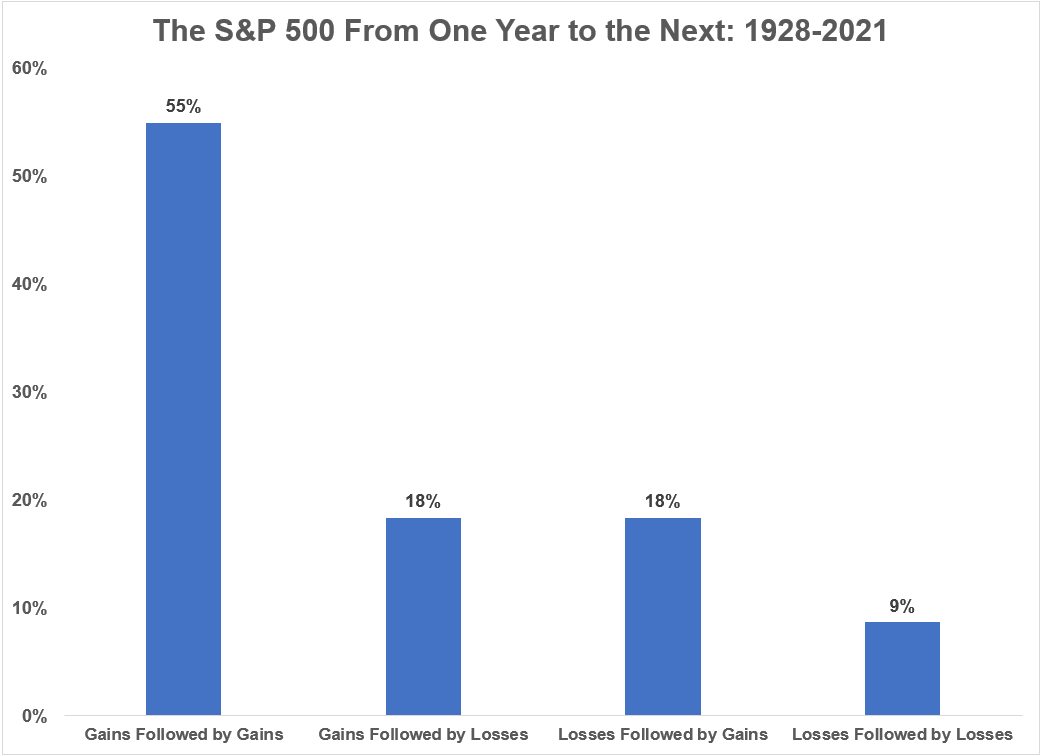
There can be 3 (1939-1941, 2000-2002) and even 4 (1929-1933) consecutive losing years for stocks (SP500), but this is quite rare.
Ben Carlson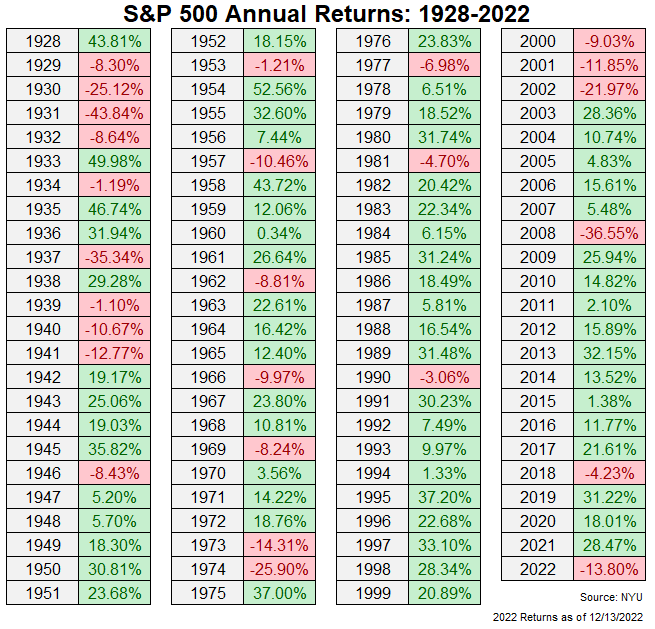
As for bonds (UST10Y), even 2 consecutive losing years are rare and only happened 3 times over the past 95 years (1955-1956, 1958-1959, 2021-2022).
The fact that we’re coming off back-to-back losing years make it very unlikely for 2023 to turn into a third losing year. [On the other hand, had 1957 been a losing year, we would have a streak of 5 losing years, something that even stocks haven’t done before.]
Ben Carlson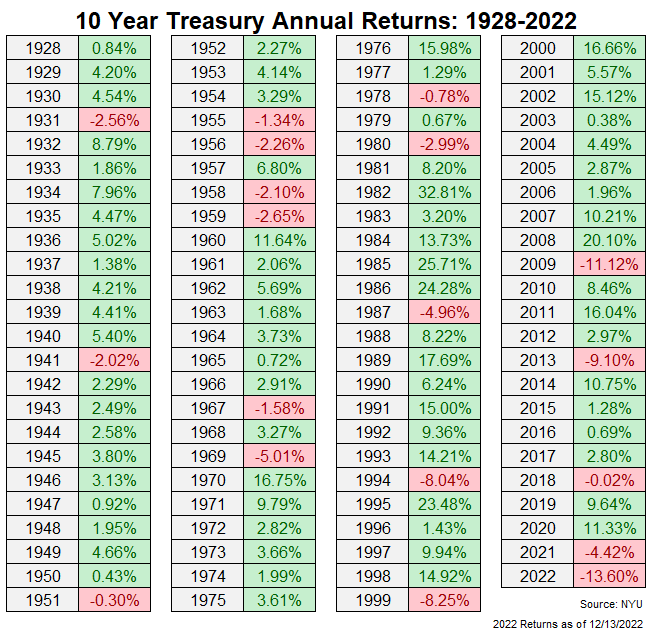
The mid-late 1950s also was a period of rising rates, and yet 2022 (if the current loss holds) is about to go down as the worst year for UST10Y in modern history (and only the 2nd year to deliver a double-digit loss).
Things to Keep in Mind Going Into 2023
- Sentiment of retail investors is hovering near all-time lows.
Unknown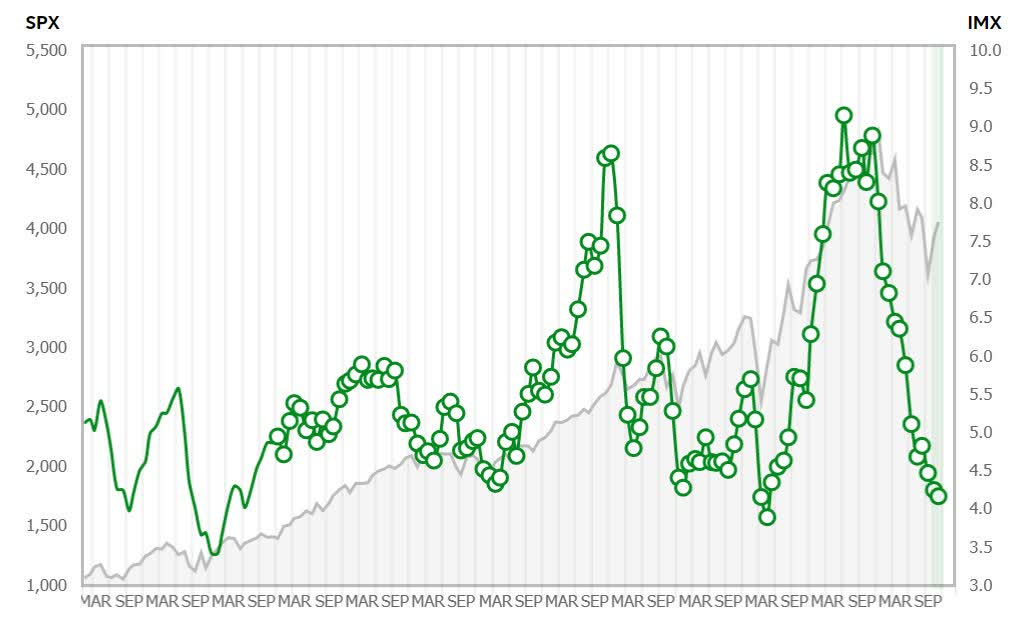
- Bears outweigh Bulls in the AAII Sentiment Poll for the longest time ever.
Charlie Bilello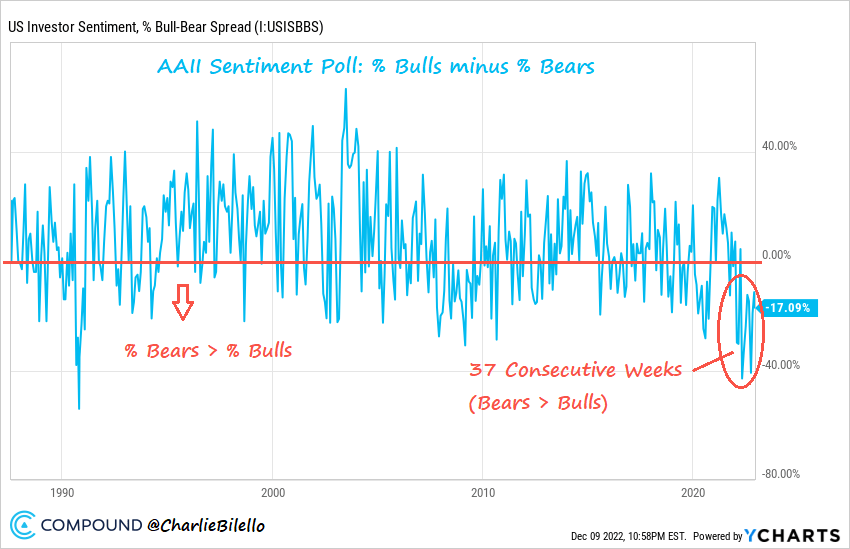
- Even the permanently-bullish Wall Street analysts are throwing in the towel on 2023.
Bloomberg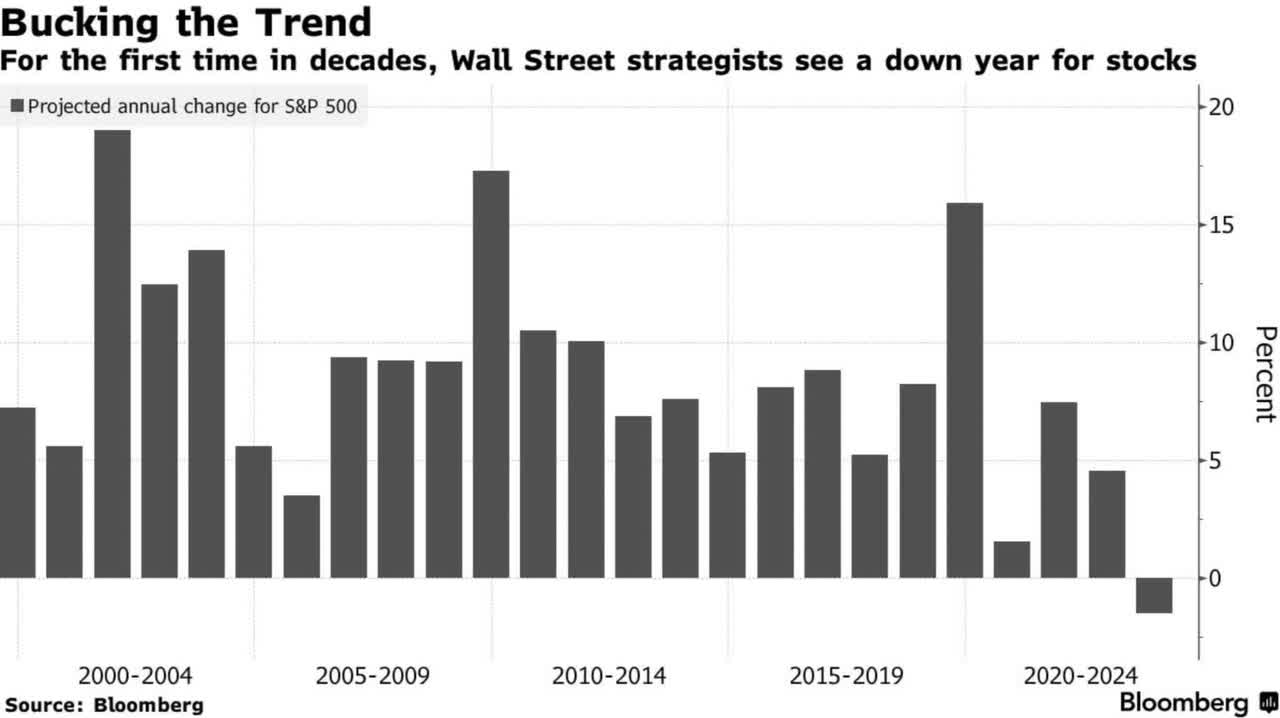
- SPX gains 24.6% (on average) in the year that follows a negative midterm year, with no false signals (=a perfect 8 out of 8 score).
Carson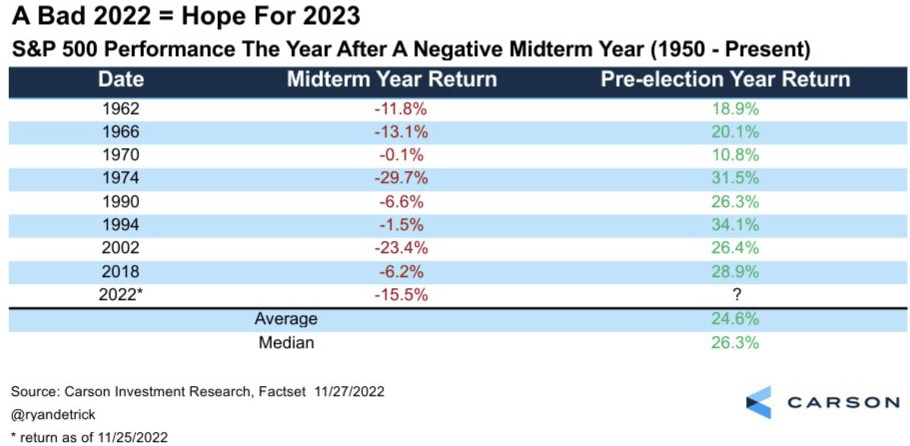
- It was Stanley Druckenmiller who once said that the best economist he knows is the guts of the stock market.
Capital Group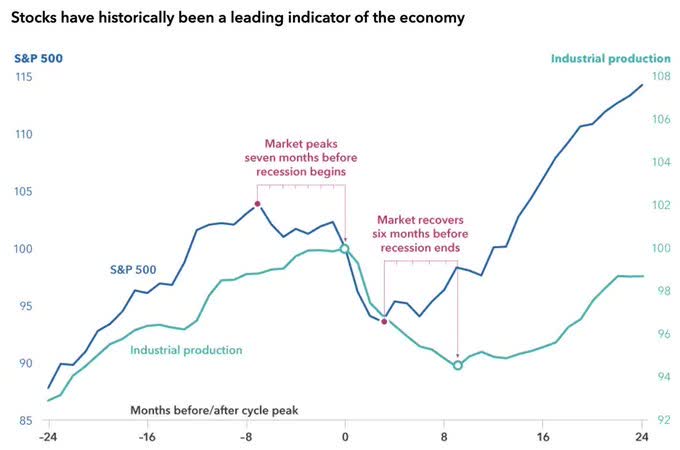
- Short-Term: If In Doubt, Move Out.
Schroders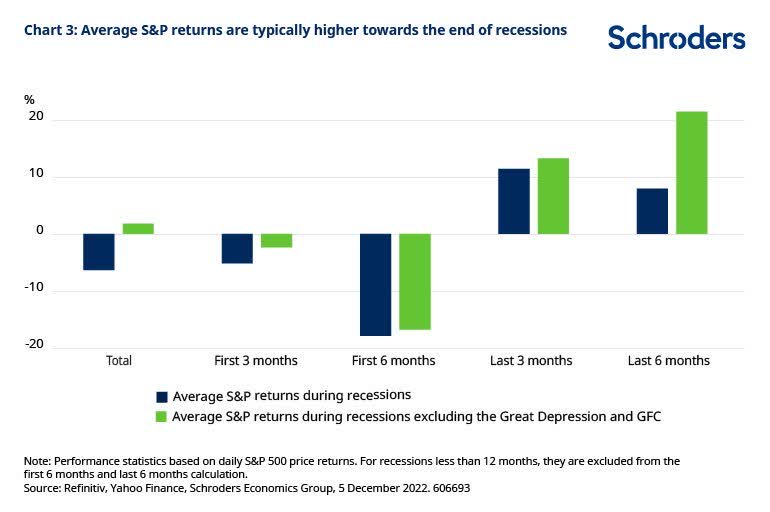
- Long-Term: If In Doubt, Zoom Out.
Unknown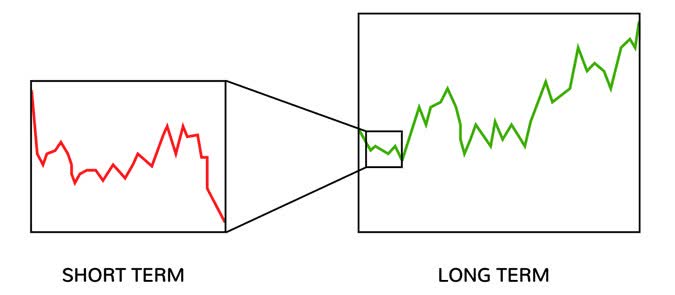
- Cutting losses isn’t always the right/suggested move but it must always be a possible, worthwhile considering, move.
Unknown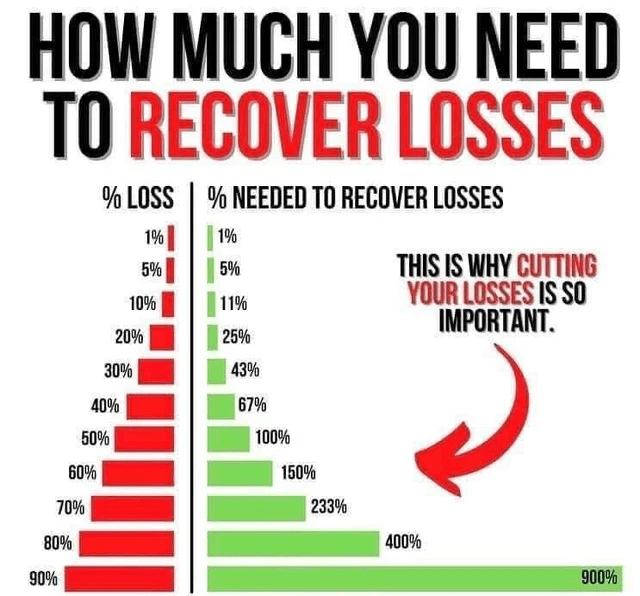
And now, ladies and gentlemen, The Greatest Showman, i.e., Powell press conference following the FOMC decision – may start.
Grab your popcorn and watch closely.
Bottom Line
The U.S. economy is slowing fast, and even the St. Louis Fed is seeing a national recession risk:
In sum, a threshold estimate based on this analysis shows that 26 states need to have negative growth in the SCI to have reasonable confidence that the national economy entered into a recession. Excluding the 2008 outlier raises the threshold to 29 states.
So, where are we now? In October 2022, 27 states had negative growth in the SCI. That would exceed the six-recession average of 26 states but would fall short of the outlier-adjusted estimate (excluding 2008) of 29.
St. Louis Fed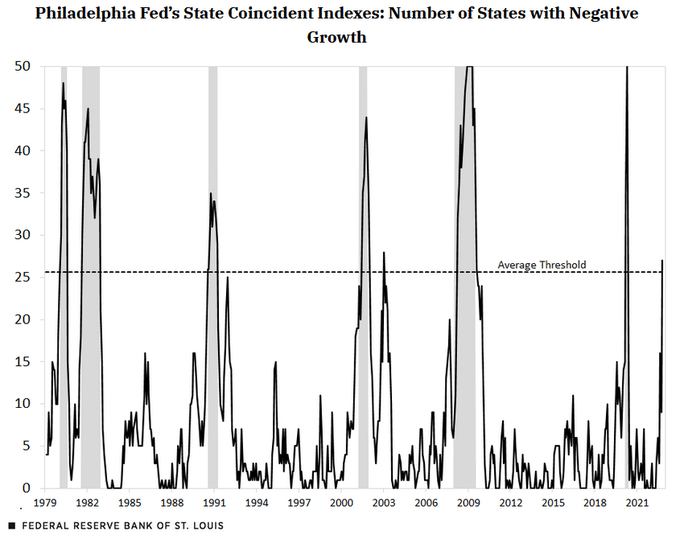
FFR reaching 5% is now viewed as a “done deal,” and even if inflation eases significantly along the year (and it will), expectations for the Fed to cut rates in a meaningful way are fading, or at least looking to be more muted.
CME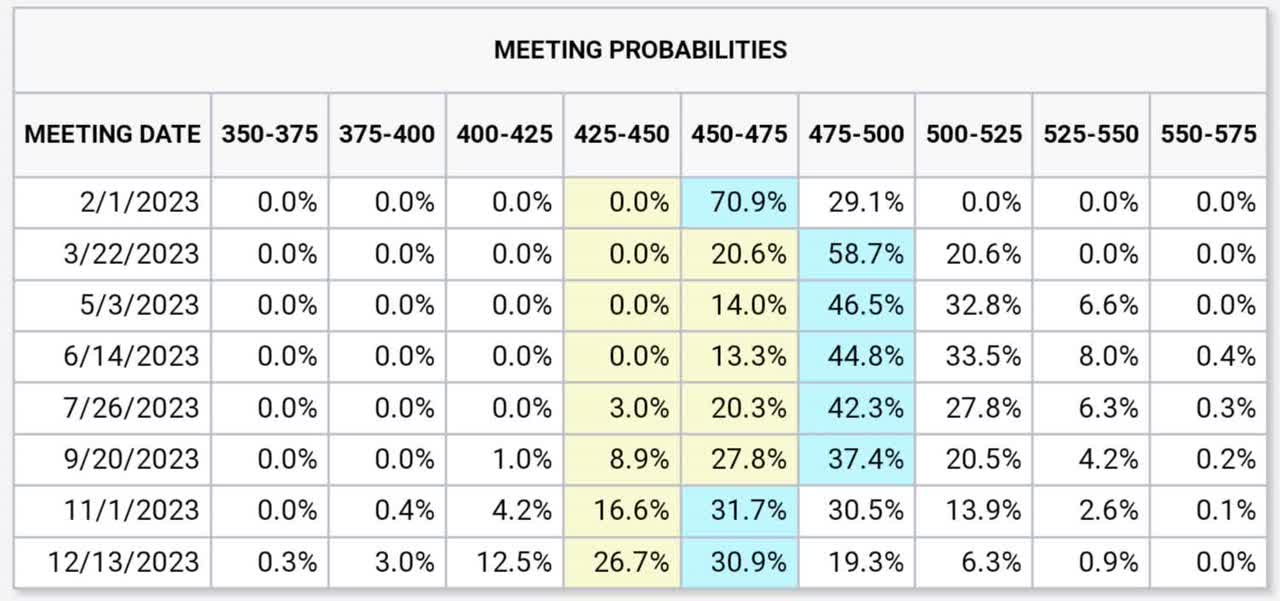
We expect the S&P 500 to make lower lows in 2023, and to trade closer to 3000 than to 4000 along the year.
Not only is the short-term (past year) downtrend line threatening to kill any more above 4000, but the long-term (since 2008 lows, while ignoring the COVID overreaction) is calling for 3000 to be met (at some point).
StockCharts
Thing is, there’s a big difference between where the SPX is “supposed” to trade to where it actually will. Moreover, there’s a big difference between where the SPX might trade along 2023 to the exact level it finishes the year at.
For the sake of this article, we are setting the target for the SPX at 3390 for year-end 2023 for three reasons:
1) We wish to be lower than the most bearish Wall Street forecast. Since Wall Street is traditionally way too bullish, this is statistically the right thing to do.
Street Insider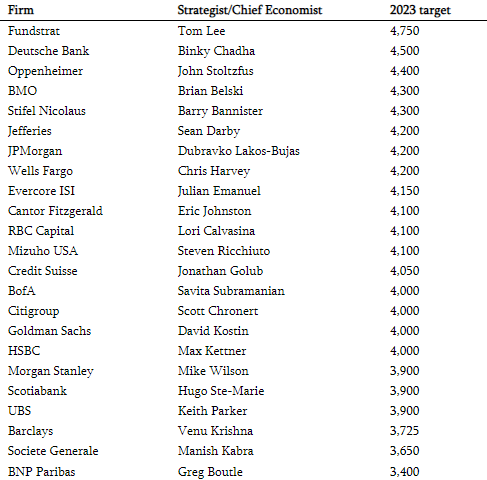
2) If and when SPX goes to 3000 (or around it), we expect a bounce to follow. This bounce very much depends on the exact timing the market will bottom. An early bottoming may see a larger bounce (20%+), whereas a late bottoming may see a smaller bounce (5%-10%).
3390 reflects a 13% bounce from 3000, somewhere between the two possible scenarios.
Reuters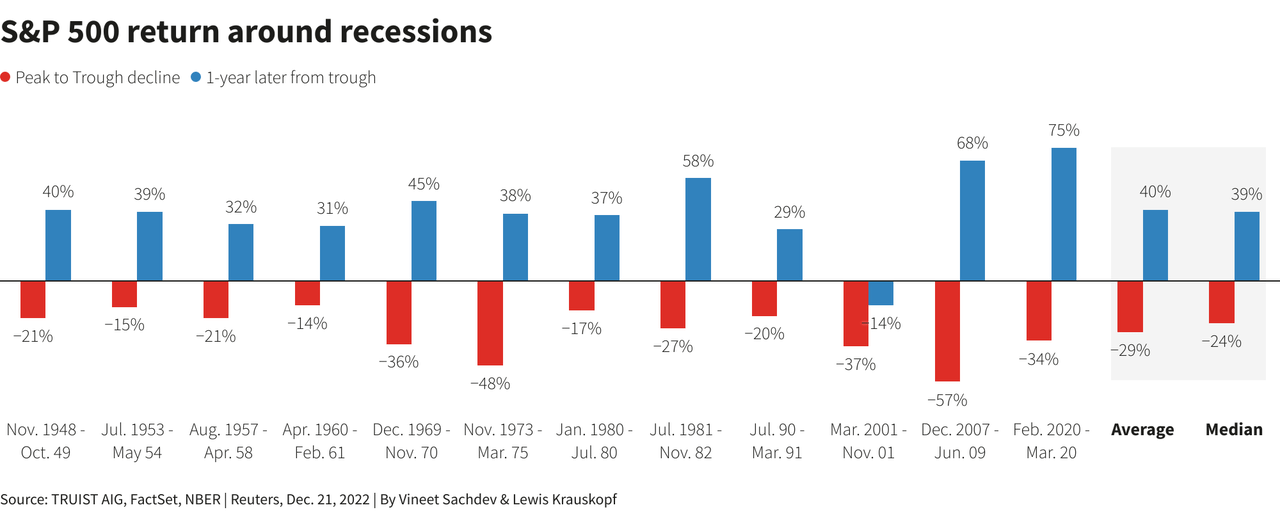
3) Wall Street is still expecting SPX 2023 EPS to grow by ~4.7% to ~$230 in 2023 from ~$220 in 2022.
We, however, expect it to go down by anywhere between 10% ($198) to 20% ($176), depending on how deep the economic slowdown, let alone recession, will be.
If we assign a forward P/E ratio between 17.1 (10-year average) to 18.5 (5-year average) on these EPS estimates we get a most pessimistic level of 3010 [=17.1X176] and a most optimistic level of 3663 [=18.5X198].
The average of these two levels is 3337, and so 3390 is a fairly reasonable mid-way compromise.
Yardeni
Keep in mind that it could have been even way worse than that, and perhaps it should…
CMV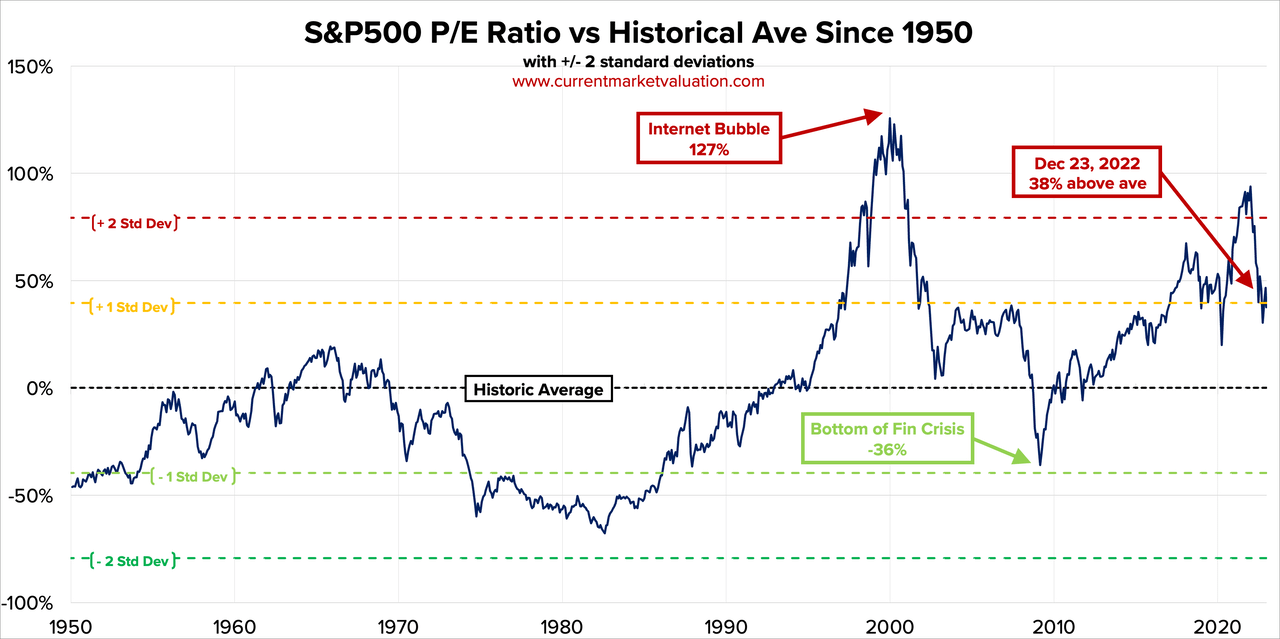
If the SPX doesn’t find a bottom in 2023 – a drop to as low as mid 2000s isn’t out of question.
The good news is that we believe the Fed will start feeling very uncomfortable if the SPX falls below 3000.
In any case, ending 2023 at, or below, 3000, would mean that our forecast (even if it’s not accurate for itself) is going to be very valuable in terms of (the general) direction, surely the best one you could get across Wall Street.
At the end of the day, where the wind blows is more important than the exact speed the wind blows at.
- Editor’s Note: This article was submitted as part of Seeking Alpha’s 2023 Market Prediction contest. Do you have a conviction view for the S&P 500 next year? If so, click here to find out more and submit your article today!
Be the first to comment