

YinYang
Investment Thesis
After riding the tailwind of higher grain prices in the past two years, ADM is facing the prospect of lower agricultural commodity prices in the near future on top of a high valuation of its current stock price. We showed how closely its financial statements relate to commodity prices, which is a double-edged sword, and deemed its current price to be rich in valuation.
Company Overview
The Archer-Daniels-Midland Company (NYSE:ADM), commonly known as ADM, is an American multinational food processing and agricultural commodities trading corporation founded in 1902 and headquartered in Chicago, Illinois. The company is one of the largest providers in the world of human and animal nutrition, agricultural origination and processing, and bio-based alternatives to fossil fuel products. Its business is divided into three segments: Ag Services and Oilseeds [ASO], Carbohydrate Solutions [CS], and Nutrition.
Strength
ADM is a large global company with many operations. Here we focus on a few points that we see as most relevant to our thesis. Over the past two years, ADM has posted exceptionally strong performance. The company’s gross profit and net income have been hitting the highest levels in its history since its IPO.
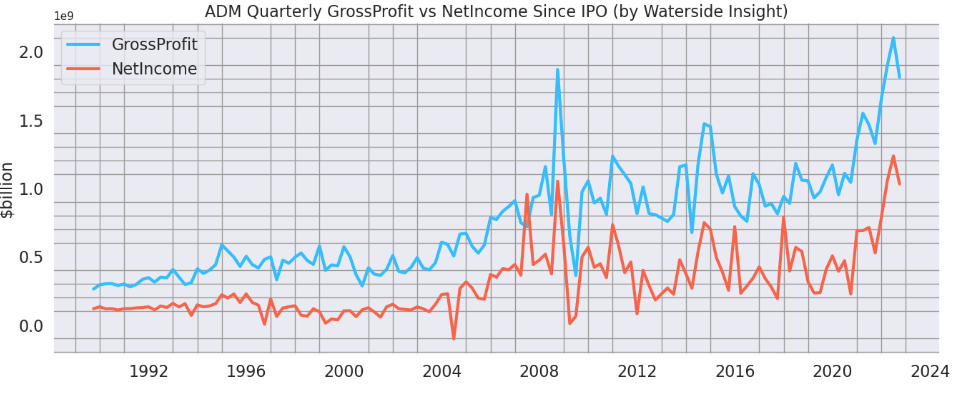
ADM Gross Profit vs Net Income (Calculated and Charted by Waterside Insight with data from the company)
So did its EBITDA:
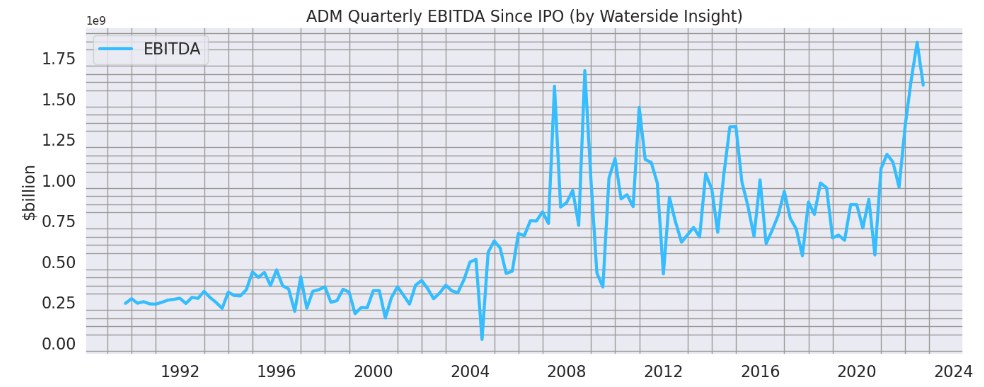
ADM Quarterly EBITDA (Calculated and Charted by Waterside Insight with data from the company)
ADM’s strong performance can still find its roots in the business of crushing and refining OilSeeds and Corn. The company’s ASO segment comprises Ag Services, Crushing, and RPO (Refined Products and Others), while its CS segment is based on Starches & Sweeteners and Vantage Corn Processors. The revenue from these two segments accounted for over 80% of its total revenue.
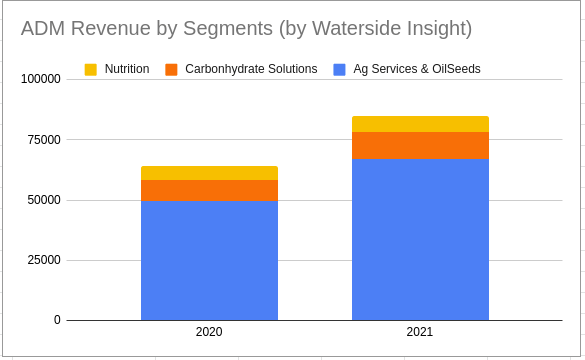
ADM Revenue by Segment (Calculated and Charted by Waterside Insight with data from the company)
These two segments have been highly profitable in recent quarters. They are posting almost 60-80% of the total operating profit. They helped to propel its total profit to rise by almost 50% compared to the same quarter last year.
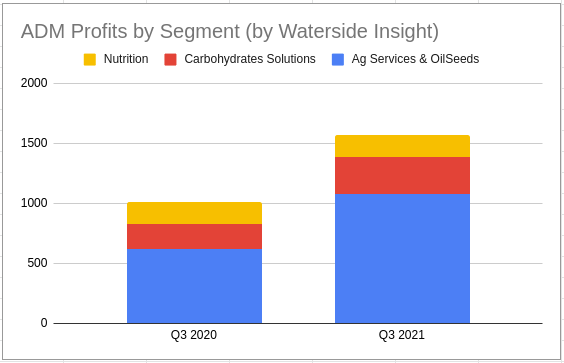
ADM Profits by Segments (Calculated and Charted by Waterside Insight with data from the company)
Risks: Close Links To Grain Market Prices as a Double-edged sword
However, as the company stated in its 10-K, the rise in revenue and profit was not due to an increase in volume but the prices. To put this in perspective, we stack the processed volume of OilSeeds and Corn against the ASO and CS segments’ combined revenue and profit. We can see with almost no change in its processed volume from 2020 to 2021, both their revenue and profits jumped by 30-40%.
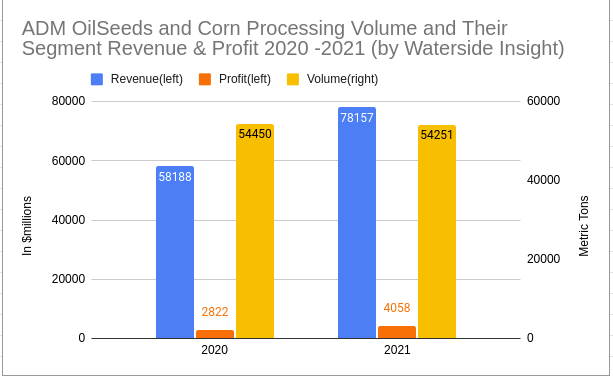
ADM OilSeeds and Corn processed Volume vs Segment Profits (Calculated and Charted by Waterside Insight with data from the company)
We can all understand that as a grain processing company, ADM is greatly impacted by grain market prices. Not only from its cost of goods side but also from the sales price on the market. But not all impacts are equal. In the past two years, soybean crush spread, which is the gauge of the profit margin of how much processors would make from crushing the soybeans into meals and oil, has risen to its highest level in history. And we can see ADM’s revenue has become closely correlated to this crush margin to a degree unseen before 2020. A similar pattern of correlation also shows in its profit and earning figures, as we presented earlier.
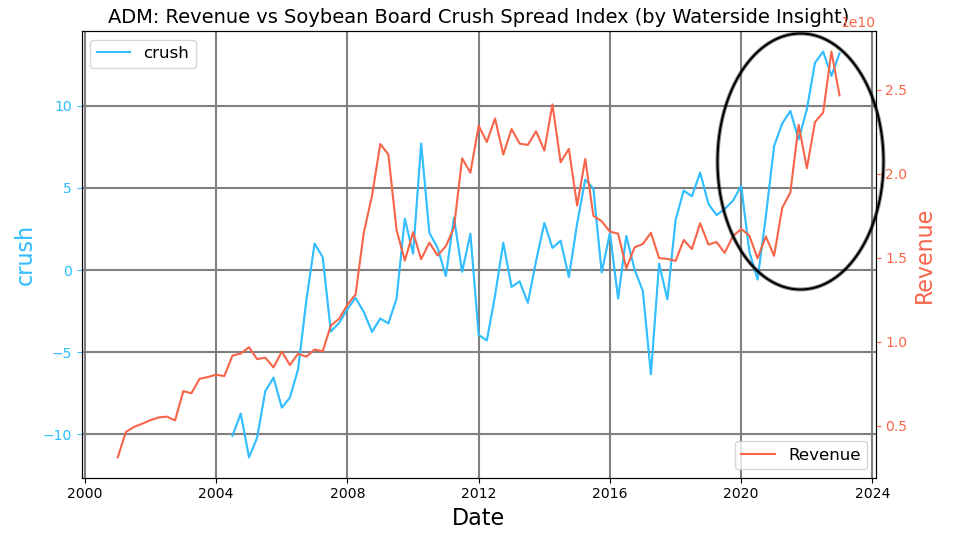
ADM Revenue vs Soybean Crush Spread Index (Calculated and Charted by Waterside Insight with data from the company, CME)
On top of the value of its processed product flow being impacted by the market margin, its inventory valuation is also greatly subject to market price changes. In 2020, ADM changed the method of accounting to value its inventory from LIFO (last-in, first-out) method to mark-to-market in its largest business unit, the ASO segment. To see how much impact it could potentially have on its revenue, we take a look at the following charts.
ADM’s cash conversion pace has been in lock-step with its revenue growth; see the chart below:
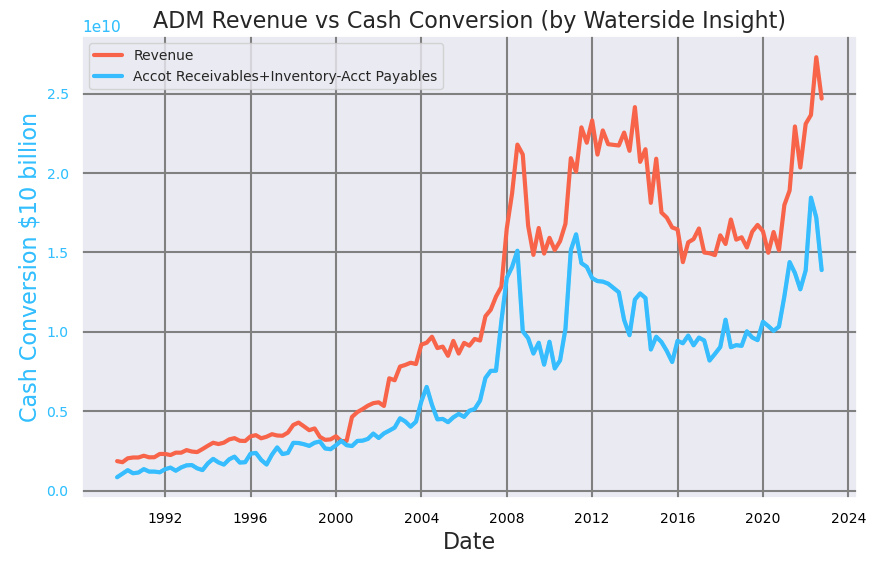
ADM Revenue vs Cash Conversion (Calculated and Charted by Waterside Insight with data from the company)
However, if you take off inventory, the growth of the cash conversion is basically flat.
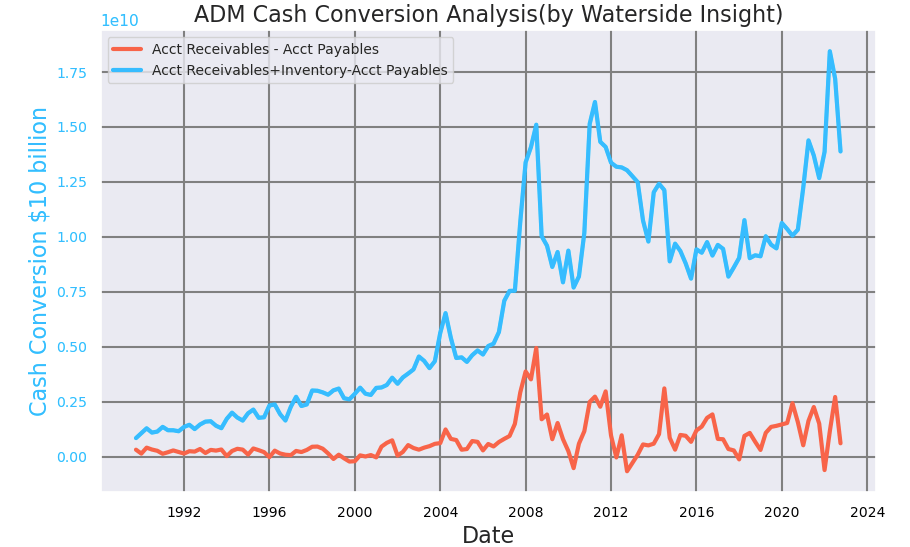
ADM Cash Conversion (Calculated and Charted by Waterside Insight with data from the company)
From our previous chart, we can see ASO’s revenue almost accounted for 80% of the total revenue. The company’s inventory-to-revenue ratio in Q3 was 56%, so this change impacts at least 70% of the total revenue. And ADM’s quarterly turnover rate is about 1.65 times, roughly the same rate compared to a year ago. It means this large expansion since 2020, at least on the balance sheet, has a component of the mark-to-market price increase of the inventory. And the growth of inventory seems to be a good predictor of revenue growth as well since, with a robust turnover rate, inventory eventually sold off to become revenue.
With this much exposure to market prices, it is logical that ADM has a large derivative hedging operation in-house. In fact, the company’s derivatives contracts have hundreds of millions of fair value.
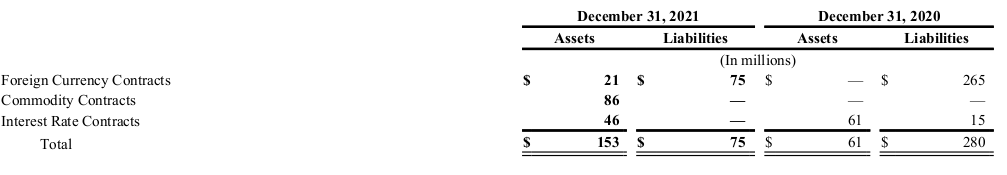
ADM Derivatives Contract Fair value (ADM 2022 10-K)
And both the gain and losses from these contracts are in the range of billions of dollars. From its Other Current Assets item, the company recognized over $3.1 billion in gains for 2020 and $1.6 billion for 2021.
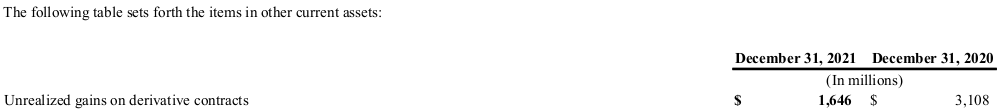
ADM Derivatives Contract Gains (ADM 2022 10-k)
While from its Accrued Expenses And Other Payables item, the company recognized losses of $2.5 billion for 2020 and $1.9 billion for 2021.
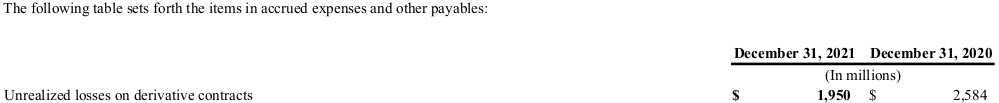
ADM Derivatives Contract Losses (ADM 2022 10-K)
ADM stated in its 10-k that it had after-tax gains of $161 million and $133 million in AOCI for 2021 and 2020, respectively. And it expects to recognize the $161 million gain of 2021 in its consolidated statement of earnings in the next 12 months. Compared to its TTM earnings of $4.1 billion, these figures are no peanuts.
Overall, we can’t help but notice how closely ADM depends on the commodity market prices to grow its revenue and profits. It’s natural to ask, where will the commodity prices of agriculture products be in the next 12 to 18 months?
According to data from the FRED, The U.S. Urban Food Inflation has outpaced the inflation of all other items, excluding food, in its CPI index for the past decade or so. This is especially acute as it logged the widest margin since 2020.
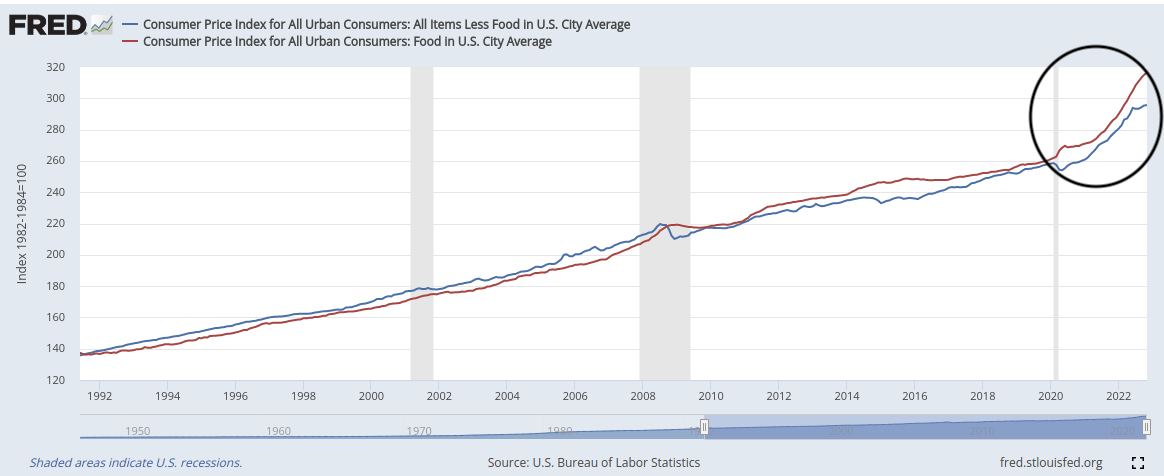
US Urban Inflation: All Item excluding Food vs Food (FRED)
If an investor asks how much longer the Fed will keep raising the rates, this will give a clue. Since food is the most basic living expense, the inflation of it will also have great erosion on consumers’ living standards. Unless the food prices come down substantially, the Fed will continue the battle. That will inevitably bring down the commodity prices as a whole. From our analysis above, we see ADM becoming highly correlated with agricultural commodity market prices. After riding the tailwind of the highest inflation in decades, ADM’s revenue and profit margin would face a double-edged sword from lower commodity prices. Furthermore, greater fluctuation should be expected for ADM’s free cash flow due to the exposure to the commodity market’s volatility.
Financial Overview
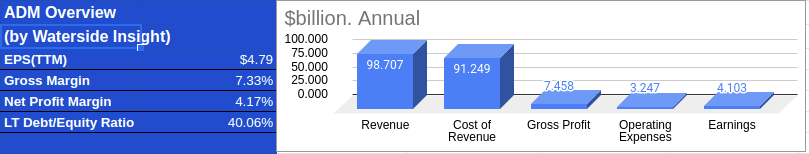
ADM Financial Overview (Calculated and Charted by Waterside Insight with data from the company)
In Q3, ADM’s adjusted earnings of $1.86 per share surged 91.8% from 97 cents YoY. The company’s quarterly revenue advanced 21.4% YoY to $24,683 million. Its gross profit for the quarter increased to $1.811 billion, up by 36.6% YoY, and its gross margin grew 80 bps to 7.3% in the quarter. It ended the quarter with cash and cash equivalents of $1.09 billion and holding long-term debt, including current maturities, of $8.559 billion. Its overall financial position is healthy and strong.
Valuation
In this valuation process, we paid particular attention to the future volatility of ADM’s free cash flow with potential impacts from market prices. With our proprietary models, we assess its fair value with a ten-year forward projection. In our bullish case, where ADM is able to smooth out the volatility but nonetheless impacted by the lower market prices in the commodity cycle, it reached $78.31 in fair value. In our bearish case, where the volatility continues to shape its cash flow, it is valued at $56.77. In our base case, where ADM’s cash flow takes an inevitable hit in 2023 and 2024 but recovers strongly afterward, it is valued at $69.02. In all scenarios, we baked in high volatility in its free cash flow.
Conclusion
At its roots, ADM is still an agricultural commodity processor. The company’s finances are highly correlated with commodity market prices, which investors should consider when assessing its future cash flow. The company indicated a $1 billion stock buyback starting in Q4 last year and lasting throughout 2023 is in its plan. Therefore, its price could have a floor in 2023. But its current valuation is too high for what we perceive as an inevitable regression of the commodity price to return to the normal range. We continue to believe in the company’s strong performance but would sell at the current price and look for a better valuation to participate in.
Be the first to comment