

BernardaSv/iStock via Getty Images
Last week was an exceptionally strong one, with a gain of 6.4%. And it accomplished it in just 4 days, due to Monday’s holiday. We are now 6.7% off the bottom of 3,666 on the S&P 500, which was set on June 16th.
Causes
In a complex, adaptive system like the stock market, nailing down the proximate causes of a big rally is highly subjective and frequently misguided. But there is no shortage of opinions about what caused the sudden shift from rampant bearishness to glass half-full optimism. Here are a few examples.
Ed Hyman, head of Evercore ISI and one of Wall Street’s top-rated economists, said: “People expect a recession because the highest inflation in decades will force the Fed to tighten enough to push the economy into a downturn.” He can envision the Fed raising short-term rates to 4% or 5% before inflation is truly under control.
How is this widespread fear of a recession good for the stock market? According to Randall Forsyth in this week’s Barron’s, “The fall in stock prices could push corporate executives to cut back on spending and hiring, restraining the economy. That, in turn, could lessen the need for the Federal Reserve to raise interest rates as much as feared. The central bank, the thinking goes, could actually be easing monetary policy by late 2023.”
Doug Ramsey, chief investment officer at the Leuthold Group, had this to say. “If inflation pressures are at a peak, thank the stock market. Major drops in the S&P 500 … have “usually unleashed a powerful, disinflationary impulse.””
Again, from Forsyth at Barron’s, “In sum, the markets perceive Powell & Co. won’t drive the economy into a deep recession to get inflation back to their desired target.”
Implications
The good news for investors is that big moves in the market, like we’ve seen in May and June, tend to come at the end of market cycles. This implies that the long-term trend (down, in this case) is likely to reverse and produce positive returns over the coming weeks and months.
Specifically, when the market rallies 6% or more during a bear market, the average return after 3 months is 4.9%, which would put the S&P 500 at 4100 by the end of summer. By the end of the year, the S&P 500 could reach 4,260, and 12 months from now, the market could be at 4,580. I arrived at these numbers by reviewing the historical record of price changes in the market after big up weeks.
When you include the fact that we’ve had two big weeks within a month of each other, plus an 11% rally back in March, it strengthens the case for higher returns going forward.
Friday’s stats
Friday’s 3% gain capped a strong week. Friday was a rare 15-to-1 up day.
June 24 S&P 500 daily stats (Author)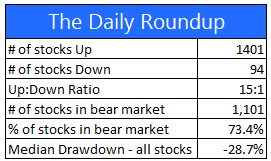
Drawdown Chart
From the perspective of percentage drawdowns, it looks like the dip-buyers have successfully defended the minus -25% line. This rally can fail, and we can make a lower low, without negating the likelihood that we will move higher from this point to the 3-, 6-, and 12-month time frames as described above.
S&P 500 drawdown chart 2022 (Author)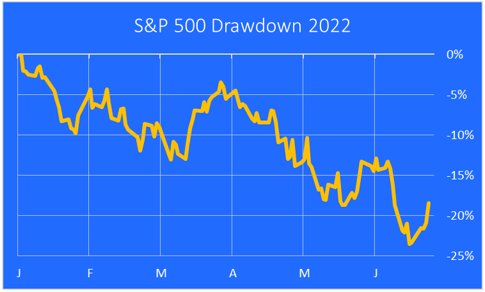
Major markets YTD performance
Emerging Markets continue to outperform, while the NASDAQ remains in last place, even after a big up week. The strongest performers were the Big Tech names like Microsoft (MSFT), Amazon (AMZN), Nvidia (NVDA), and Meta (META).
Major markets chart (Author)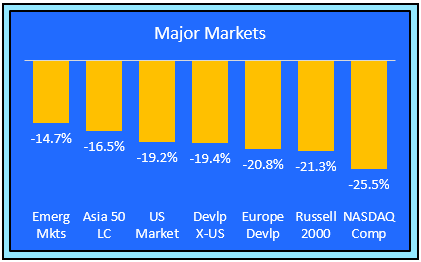
Value vs. Growth YTD
Value is still ahead of growth this year, even after a rally in growth names narrowed the gap last week. Large cap growth had a great week, led by Big Tech.
value vs. growth (Author)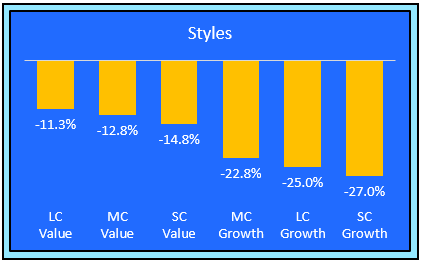
Size categories YTD
Small cap stocks still trail behind their mid and large cap counterparts. Mid caps outperformed last week.
Size categories YTD (Author)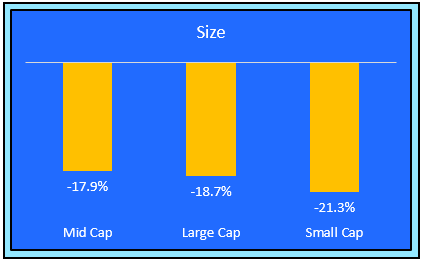
Sensitivity to the business cycle
Cyclical stocks caught a bid last week, but still remain well below their more defensive counterparts on a YTD basis.
business cycle sensitivity (Author)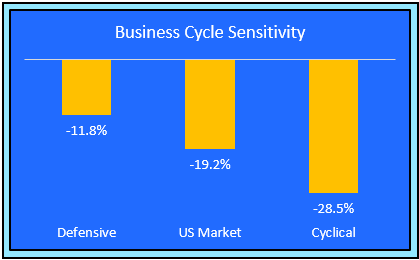
Factor breakdown
Stocks that pay dependable and rising dividends are leading all other factors I track. The quality factor is struggling this year. Quality includes measures of profitability, and that is being called into question by investors, given the sharp rise in input costs and their anticipated hit to profit margins.
stock factors (Author)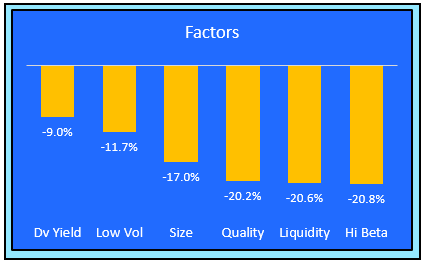
Sectors
The energy sector has given back more than half of its gains but still remains the top performing market sector YTD. Tech, Communications Services, and Consumer Discretionary performed well last week, but they still have a long way to go before they catch up with the more defensive utilities and consumer staples sectors.
market sector performance YTD (Author)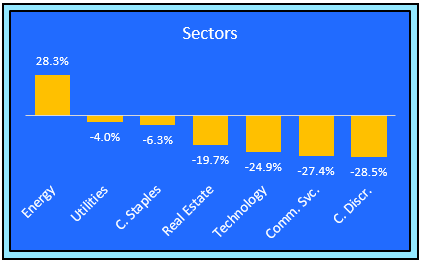
Industries
Energy Exploration & Production remains the leading industry YTD, even after giving back half of their gains since June 8th. Autos are the worst performer, as high prices and lack of inventory discourage many potential car buyers.
industry performance YTD (Author)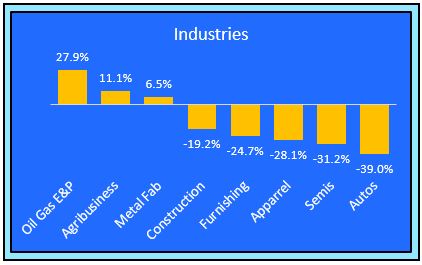
Individual winners & losers
You can see from the winners list that economically sensitive names are dominant. This is a result of the slight reduction in recession expectations among investors.
The losers list is dominated by defensive plays that hold up better when investors are expecting a recession.
stock winners & losers June 24, 2022 (Author)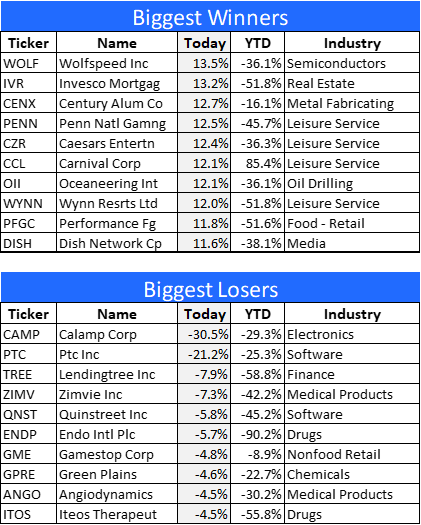
Final thoughts
The rally we saw last week was powerful, but does it have staying power? That’s impossible to know at this early stage, and the real bottom of this market cycle could still lie ahead. But there is reason for optimism after two strong weeks less than a month apart.
Investors seem to be saying: If a recession is what it will take to get inflation back down to an acceptable level, then so be it. If the recession comes, it probably won’t be a bad one because the Powell Fed will stop tightening and may even start easing again.
I’m not as optimistic as that. I think the Fed will continue to tighten until one of three things happen: 1. Inflation cools enough for them to declare victory, even if it settles at a level that’s higher than their stated 2% target. 2. The economy slows so quickly that the unemployment rate starts to rise in a meaningful way. 3. The stock market keeps going down, past -25% and approaching -30%. At that point, I think Chairman Powell will cry uncle and take his foot off the brakes.
I think the chances of a down -30% market (3360 on the S&P 500) are quite small, but not zero. The wild card is inflation. If the Fed has to keep tightening because of persistently high inflation, a recession seems like a logical result. Under recessionary conditions, I would put the odds of a -30% bear market at close to even money.
There is no recession yet, and as long as investors are in the mood to expect a mild one at worst, this rally might have some legs.
Be the first to comment