

24K-Production/iStock via Getty Images
In January 2021 I published “Market And Earning Cycles Point To A Pause In 2022.” The jest of the article was: “The average duration of the business cycle suggests the market will pause in 2022.” The implication was: “It may be prudent and to revisit the defensive strategy so successful during the 2018-2020 down leg of the business cycle.”
Where do we go from here? The indicators reviewed in this article suggest the bear market is far from over and may last well into 2023.
The main force driving the business cycle since 2021 has been the sharp slowdown in liquidity orchestrated by the Fed.
St. Louis Fed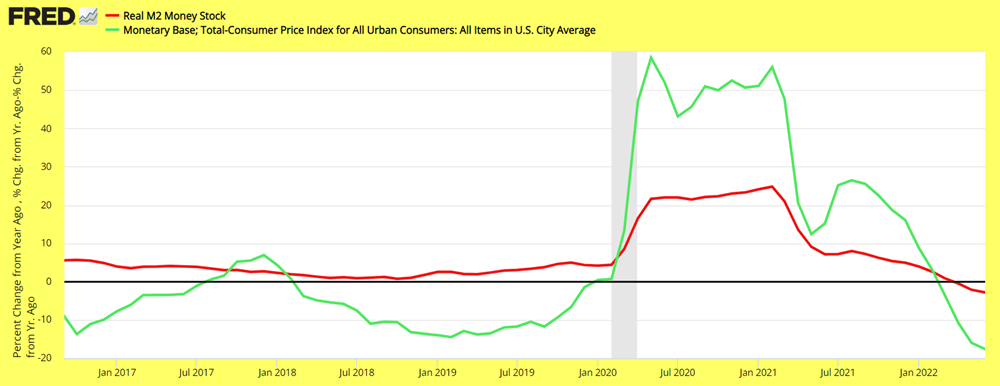
The aggressive amount of liquidity injected by the Fed and government in 2020 caused unprecedented growth in the monetary base (green) and M2 (red) (see above chart, data are after inflation). The outcome has been inflation rising to 9.1% in 2022 as real GDP soared 12.2% y/y well above recent historical average growth of about to 2.0%.
The response of the Fed has been to reduce liquidity in the system which is now contracting with the monetary base down -17.6% y/y and M2 down -2.2% y/y (see above chart). The decline of liquidity is the major cause of the weak performance of the stock market since 2021.
The rise in inflation is creating important disruptions in the credit market. Housing is crumbling as affordability sinks due to high prices, declining real income, and soaring mortgage rates.
St. Louis Fed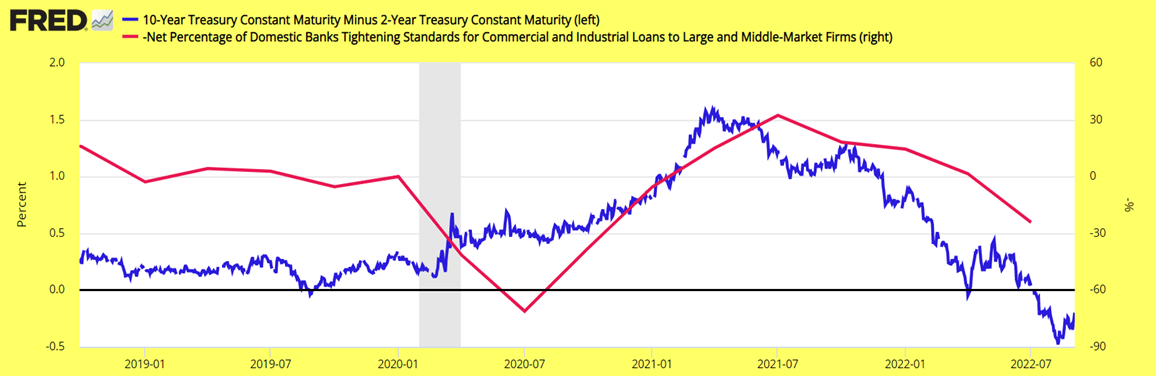
Short-term interest rates rising faster than long-term interest rates – due to the Fed’s tightening cycle – have caused the yield curve to invert (blue line, left scale). The inversion of the yield curve has triggered banks to tighten lending standards (red, inverted, right). Banks are seeing credit issues not yet reflected by AAA and BAA bond yield spreads which remain still comfortably low.
The point is the inversion of the yield curve is signaling caution. But there is more to it.
St. Louis Fed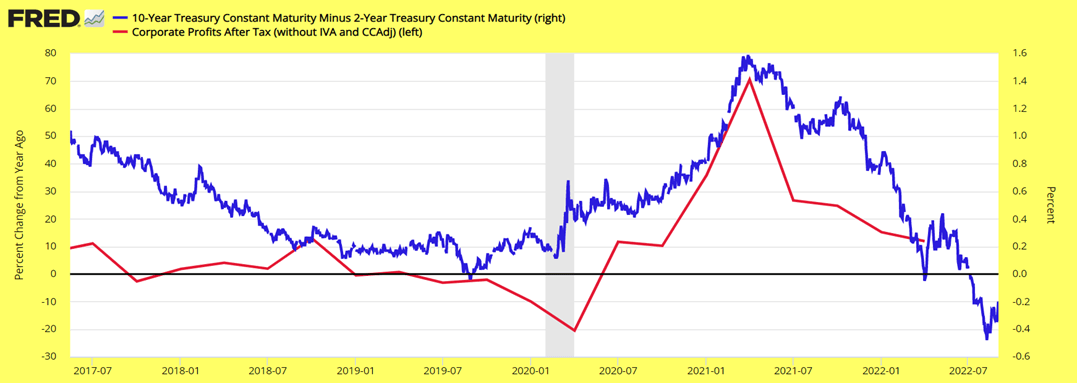
The inversion of the yield curve (blue, right scale) also points to weaker profits (red, left scale) as shown in the above chart. It should come as no surprise, therefore, to see the yield curve pointing to weaker economic growth. Note how the yield curve started steepening in 2009 and profits improved in 2020 with the yield curve leading profits by about a year.
St. Louis Fed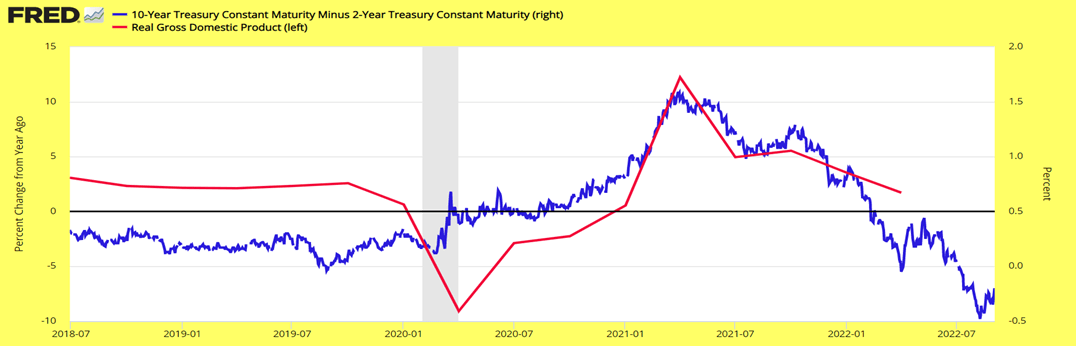
The above chart shows the yield curve (blue, right scale) and real GDP growth (red, left scale) declining at the same time. The relationship is like that of the yield curve and profits.
But the yield curve has also another important feature supported by these graphs and historical data. The yield curve leads improvement in profits and overall economic growth by about one to two years. Note how the yield curve started steepening in 2019 and profits and GDP growth bottomed in 2020. More complete historical evidence suggests even if the yield curve starts to steepen now, growth in profits and the economy should take place no sooner than late in 2023.
St. Louis Fed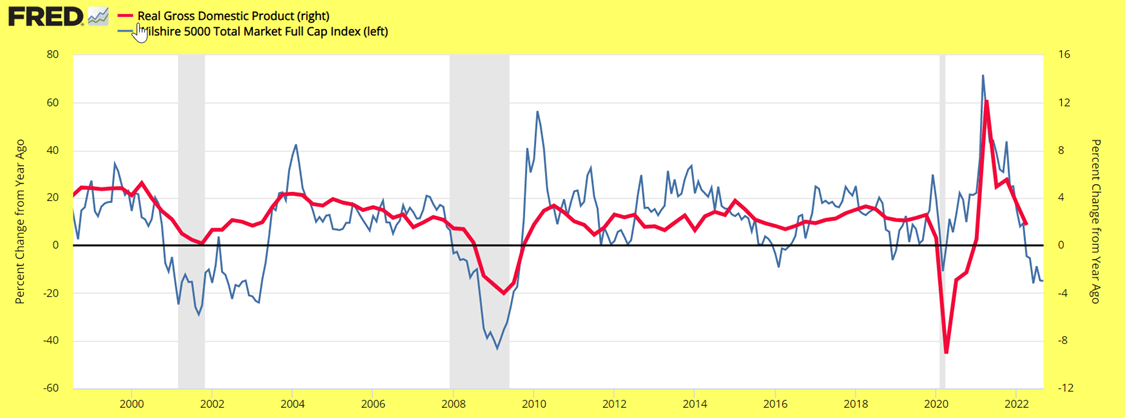
The above chart shows the growth of real GDP (red, right scale) and stock prices (blue, left scale) (shaded areas represent recessions) bottom at about the same time. The recent growth pattern of the stock market suggests the economy is likely to contract as it has happened in previous episodes (2001 and 2009).
Since bottoms in profits and equity prices take place at the same time and due to the lead-lag relationship between yield curve and economic growth (see previous three charts), it seems reasonable to expect the bear market to last well into 2023.
The yield curve provides further information about the timing of the next bull market.
St. Louis Fed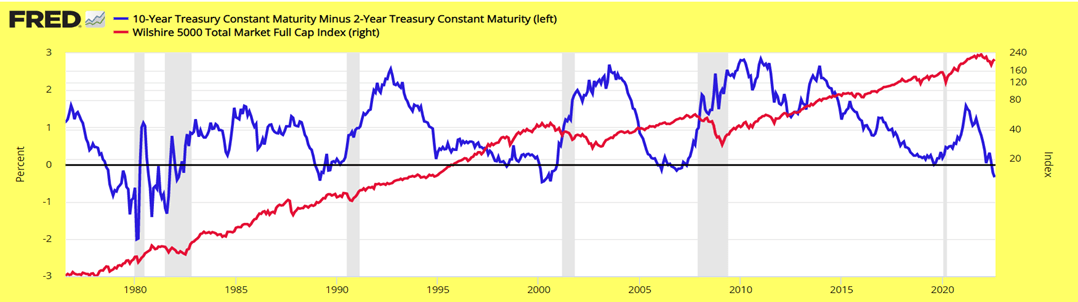
The above chart shows the stock market – Wilshire 5000 (red, right scale) – and the yield curve (blue, left scale). The data going back to the 1980s suggest the next bull market will start when the spread between the yields on 10-year Treasury bond and the 2-year Treasury note is positive and at least close to one-half or 1.0 percentage point.
Another important feature of the above chart is the bottom of the yield curve – the beginning of the steepening of the yield curve – leads by about one to two years the bottom of a bear market. The next bear market bottom should take place at least toward the end of 2023, possibly in 2024.
The Peter Dag Portfolio Strategy and Management
One more factor supports the conclusion the bear market has at least another 12 months of life. The conclusions of the article mentioned at the beginning of this article were based on the length of the business cycle shown above. The Peter Dag Portfolio Strategy and Management computes it in real time and reviews this business cycle indicator in each issue. It correctly predicted in January 2021 the beginning of an economic slowdown in 2022.
Since the typical length of the business cycle is about 4 years (bottom to bottom) we should expect the next bottom of the business cycle sometime toward the end of 2023 and the beginning of 2024 (the latest bottom of the business cycle took place in 2020). This is the time growth in GDP and profits rise again, supporting the new bull market. In the meantime, we should expect what typically happens during the declining phase of the business cycle: lower commodities, lower inflation, and, eventually, lower yields.
Key takeaways
- The business cycle will continue to decline, reflecting slower economic growth.
- Slower economic growth will cause commodities, inflation and, eventually, bond yields to decline.
- Slower economic growth will continue to cause slower growth in profits and lower stock prices.
- Defensive sectors such as utilities, staples, healthcare, and REITs are likely to outperform the S&P 500 as they usually do in the declining phase of the business cycle.
- Bond prices will eventually outperform the S&P 500 as the economy continues to weaken and liquidity is withdrawn from the system.
Be the first to comment