

Jay Yuno/E+ via Getty Images
New beginnings
After a couple of months hiatus since my last backtesting article, I have decided to reinvent the major rules of using my strategies as well as sharing them with you. Learning from the experience that I can make things look as complicated or as simple as I wish, I have come to the conclusion that I prefer simplicity. Thus, I will skip some of the gymnastics that I entangled myself in in the past and just stick to what is in front of me.
First and foremost, I will from now on distinguish my strategies created in Equities Lab from those in Market Inside Out. The fundamental mechanisms of these programs are not comparable and I use them differently. I will, consequently, write separate articles dedicated to the backtesting I perform on them. Remember, those are exercises on past data, without ways of taking into account all the decision making factors that we deal with in daily investing life.
Principles of my strategies on Equities Lab
-
Good to Great Contrarian Quarterly: focuses on stocks with increasing revenues numbers, with a quarterly rebalancing rule.
-
Good to Great Contrarian Churn: fundamental tilt as above, but the holdings are rebalanced monthly.
-
Monthly AO: it screens stocks by the changes in the monthly period Awesome Indicator, but also follows on money flow. It rebalances quarterly and has a stop-gain rule at 25%.
-
Millionaire Health Care Plans: this is a sector strategy, it buys only health care plans management companies. It rebalances monthly.
-
Wyckoff-O’Neil-Minervini: it is a purely technical screener that combs each month through companies starting from mid-caps and with stock prices below $100.
Statistics of the strategies
Find below the major statistics from the backtesting from January 1, 2000, till March 25, 2022. The benchmark is the S&P 500 (SPY) which for the same period returned 369%, which is equivalent to a CAGR of 7.2%.
|
Strategy Name |
Total return, |
Avg Annual Return, % (CAGR) |
Profit Trades, % |
Avg number of holdings |
Max Drawdown, % |
Avg Profit per trade, % |
|
Millionaire Health Care Plans |
37670 |
30.6 |
63 |
1 |
84.6 |
4.2 |
|
Good to Great Contrarian Churn |
11601 |
23.9 |
61 |
2 |
76 |
3.2 |
|
Good to Great Contrarian Quarterly |
8920 |
22.5 |
64 |
1 |
67.6 |
5.2 |
|
Wyckoff-O’Neil-Minervini |
3232 |
17.1 |
59 |
1 |
78.2 |
2.1 |
|
Monthly AO |
1544 |
13.4 |
60 |
1 |
71.8 |
4.5 |
Source: Author’s own table based on Equities Lab results.
The “Millionaire Health Care Plans” strategy has resulted in the highest CAGR of all the backtested strategies – 30.6% vs. the next best of 23.9% from the second-best Good to Great Contrarian Churn. Both strategies are rebalanced monthly. “Millionaire Health Care Plans” has also one of the highest percentages of profitable trades, only beaten by 1 percentage point of the “Good to Great Contrarian Quarterly” which has a 64% profitable trades rate.
However, the highest CAGR does not spare you in the moment of market crashes – “Millionaire Health Care Plans” has a huge drawdown of 84.6%, compared to “Good to Great Contrarian Quarterly’s” 67.6%. The latter strategy enjoys the highest average profit per trade with 5.2%, followed by another quarterly rebalanced strategy “Monthly AO” which has averaged 4.5% per trade. What all of these strategies have in common is that they focus on one, maximum two, positions at a time, hence they allow investors to react quickly if the trade goes south for any reason. Practically, I put all the suggested buys in a dedicated watchlist and I set up alerts on them to monitor a technical trigger for buying only when there is a high probability of a swing upwards.
Fundamental and technical analysis of the last buys
-
“Good to Great Contrarian Quarterly”: M/I Homes (MHO) was purchased on January 3, 2022, at the price of $60.71. Until the week ending March 25, the position returned a loss of 24.4 %, closing at $45.91 on March 25. M/I Homes is a residential construction company with nearly 18% revenues growth over the last 3 years. Their EPS grew 40% for 2021 in comparison to 2020. They trade at a cheap valuation as estimated by the Price/Sales, Price/Earnings, Price/Cash Flow, and Price/Book ratios not only lower than historical 5-year averages but also lower than the same ratios for 2021. In fact, Price/Sales and Price/Book are below 1.
TradingView chart of MHO (TradingView.com)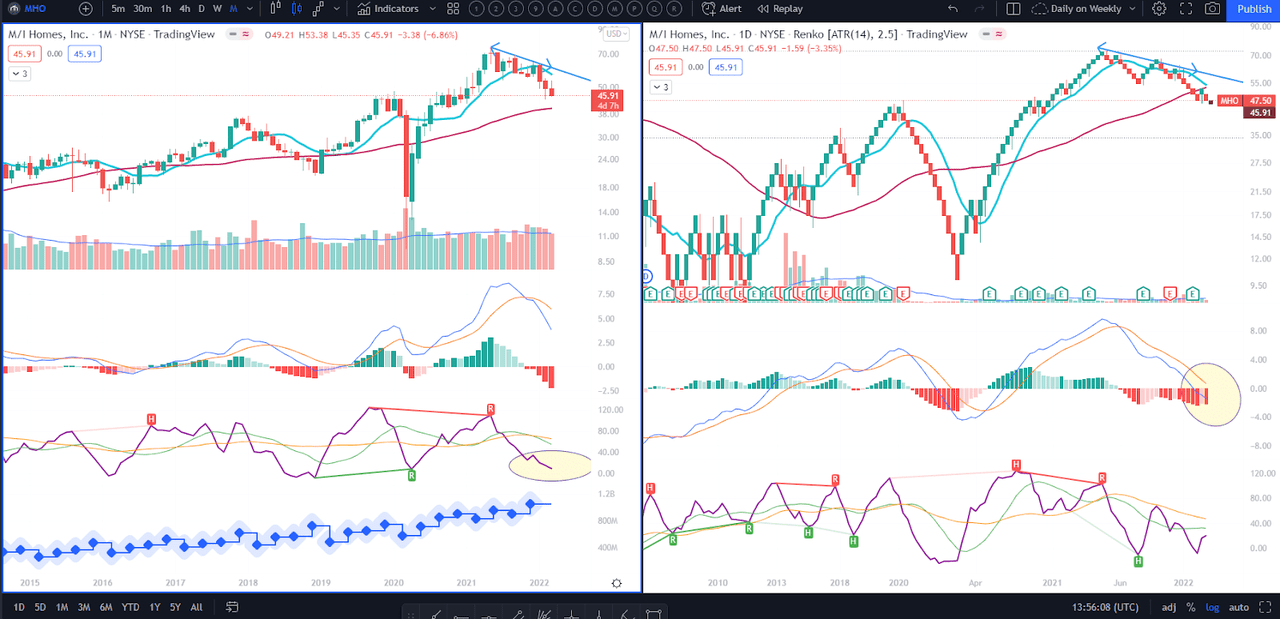
The technical situation of MHO is conducive to seeking a bottom of the recent correction. The left pane is the monthly chart, the right pane is the daily Renko. Technical indicators are 10-periods and 50-periods Moving Averages, MACD, and Composite Index Divergence Indicator (an indicator rarely seen in other technical analyses but one of my personal favorites). I usually check for indicators on both timeframes to confirm each other, although I might put an alert on a weekly chart to prepare me before the monthly chart starts indicating long-term changes. The confirmation will usually look like this: the CIDI line (a purple line in a yellow eclipse on the monthly chart) ticks up after bouncing off its lowest level and the MACD on the daily Renko (in a yellow eclipse on the right pane) ticks up as well towards its signal, indicating an imminent crossing above the signal line.
-
“Good to Great Contrarian Churn”: Gravity Co. (GRVY), purchased on March 8, 2022, at the price of $45.04. Until the week ending March 25, the position returned 11%. GRAVITY Co Ltd is an online and mobile games developer from South Korea, principally known for the Ragnarok Online product. The shares are ADR on Nasdaq as Gravity is a foreign issuer. Their sales annual growth rate is 42% for the last 3 years (as reported for 2020 by Morningstar) and their EPS grew 57% as reported for the end of 2020. MarketWatch reports that their annual sales for 2021 were $361.47M, growing only 5% in comparison to 2020. For all the valuation ratios (Price/Sales, Price/Earnings, Price/Cash Flow, and Price/Book ratios), Gravity trades very much below its 5-year averages. The company more than doubled its Operating Cash Flow and Free Cash Flow between 2019 and 2020, apparently monetizing the pandemic shift to gaming. However, it remains to be seen how it will perform now post-pandemic.
TradingView chart of GRVY (TradingView.com)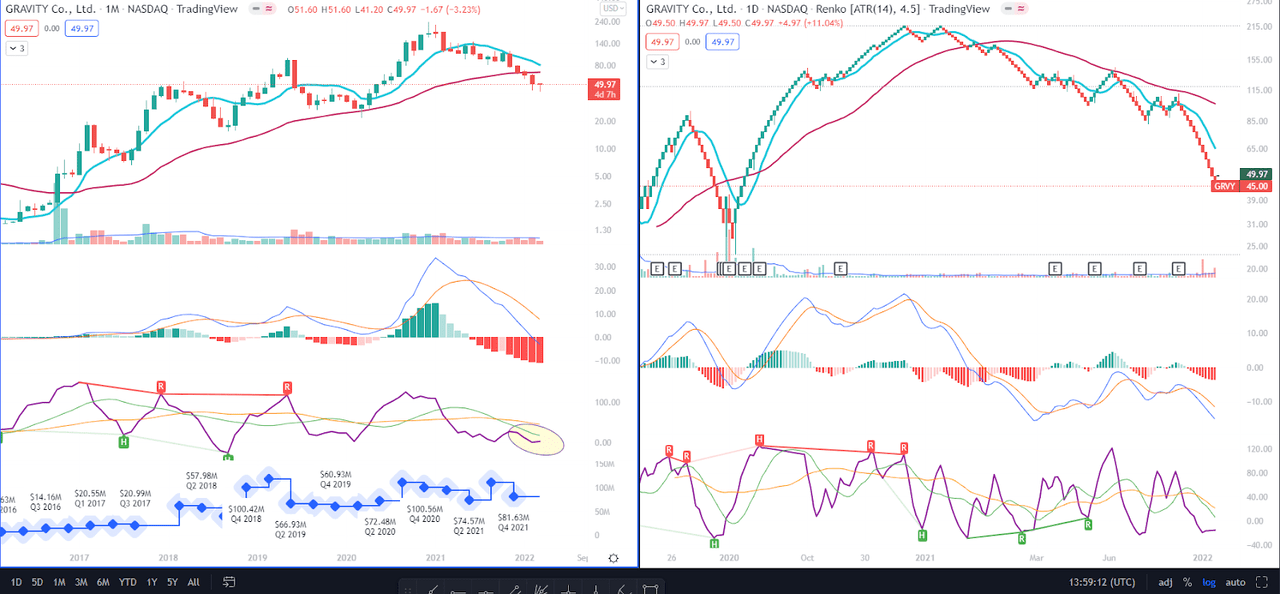
The current technical setup of Gravity is downwards. The change of trend, in my opinion, will be marked by the cross of monthly MACD above its signal, which should normally be preceded by the cross of CIDI above its fast-moving average (green line in the yellow eclipse on the left pane). However, due to the strong downtrend, I would also like to see a reversal on the Renko chart, that is to say, the move of MACD above zero as well as the blue 10-day average crossing above the red 50-day average. The last time the reversal took place was in August 2020 when the shares traded in the range between $50-$60, which is where the stock traded last week, finishing the week at $49.97.
-
“Monthly AO”: SSR Mining (SSRM) was purchased on March 1, 2022, at the price of $20.72. Until the week ending March 25, the position returned 6.6%. SSR Mining Inc is a gold and silver mining company with a 52% growth rate of sales over the last 3 years, and with EPS growth of 87% for 2021 in comparison to 2020. SSR Mining shares trade at discount to the 5-year averages for Price/Earnings, Price/Cash Flow and Price/Book ratios – only Price/Sales is slightly higher than the average. The company started paying dividends last year, yielding 1% at a very comfortable payout ratio of 12%. In 2021, the company nearly doubled its Operating Cash Flow ($609M vs. $349M) and its Free Cash Flow grew by 150% ($444M vs. $179M) in comparison to 2020.20
TradingView chart of SSRM (TradingView.com)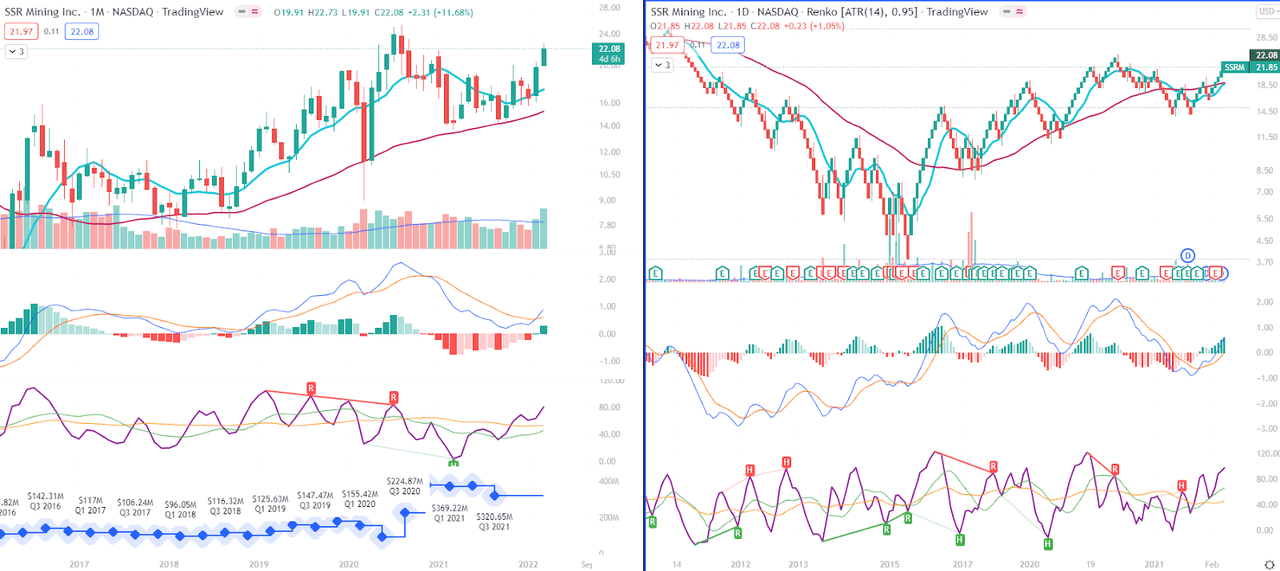
Just like the rest of gold mining companies, the technical set-up of SSRM indicates an imminent breakout. Monthly MACD crossed above the signal, monthly CIDI crossed above the slow (orange line) average while also the CIDI fast average ticked up to cross the slow average from below. On the Renko chart, MACD crossed above zero and CIDI has long ago broken above the averages. The stock is yet to reach the 5-year high of $25.43 though, which could become a resistance level. Stopping at $25.40 would possibly result in a 22.6% profit from the back-tested purchase level.
-
“Millionaire Health Care Plans”: Clover Health Investments (CLOV) was purchased on March 1, 2022, at the price of $2.71. Until the week ending March 25, the position returned 30%. Clover operates as a Medicare insurer. Their flagship product, Clover Assistant, provides individuals with access to affordable health plans, while it also supports doctors as a data-driven decision-making tool. Clover had traded on NASDAQ since June 2020. It still has a limited financial history since becoming public. Last revenues (for 2021) were $1.47B and Clover was not profitable (a loss of $588M). Valuation-wise, Price/Sales is just below 1. Clover does have a very low debt but fundamentally speaking, this stock is a gamble for a regular individual investor until there is a visible trend in the financial results. Current institutional ownership is still very low at the 34%
TradingView chart of CLOV. (TradingView.com)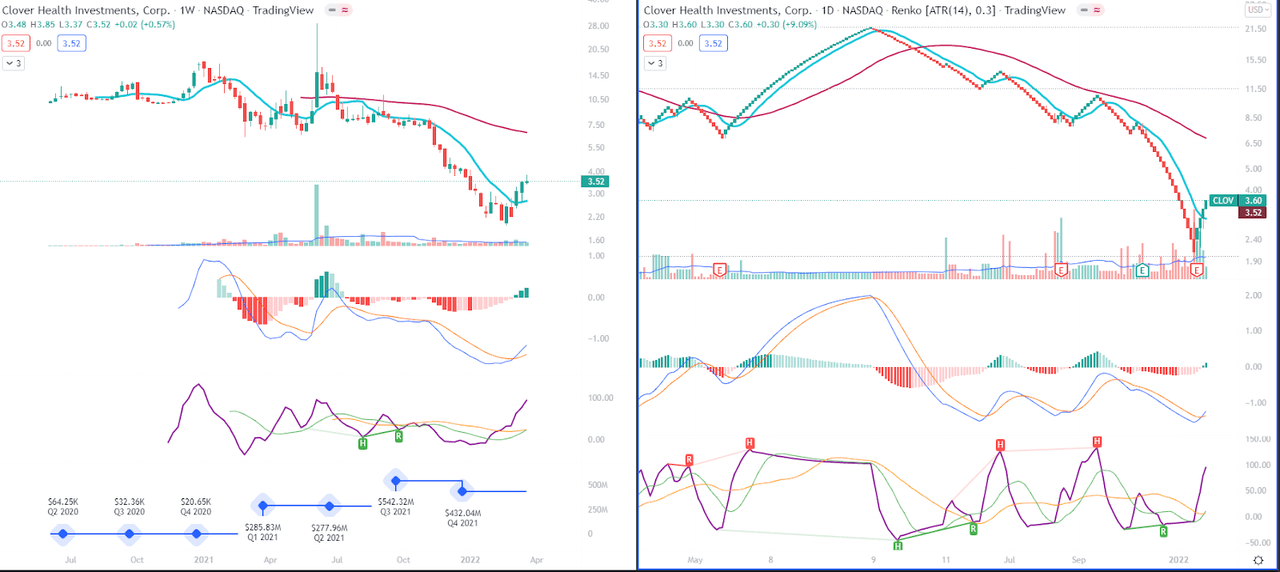
For technical analysis purposes, I had to lower the frame from monthly to weekly because there was not enough data to start the indicators on the monthly basis. After a skydive of the price in 2021, it seems like the stock has bounced off the bottom. I would wait until the weekly MACD first crosses zero to have any reliable indicators that the sell-off is finished and the price will go anywhere upwards. Of course, if you don’t need cash, you can park it there and possibly reap the benefits of buying it at a very low price.
-
“Wyckoff-O’Neil-Minervini”: Calumet Specialty (CLMT), purchased on March 8, 2022, at the price of $16.02. Until the week ending March 25, the position brought a loss of 15.4%. Calumet produces solvents, waxes, customized lubricating oils, white oils, petrolatum’s, gels, esters, they also blend and package these high-performance products, and do not shy from renewable diesel and specialty asphalt. As the only company in this selection, Calumet actually has a negative growth rate for the last 3 and 5 years, but it has grown its sales from 2020 to 2021 by nearly 39%. Unfortunately, it has not been profitable since 2013. I just want to remind you here that this screener is not really looking at the fundamental strength of a company, it selects by the price action and volume.
TradingView chart of CLMT (TradingView.com)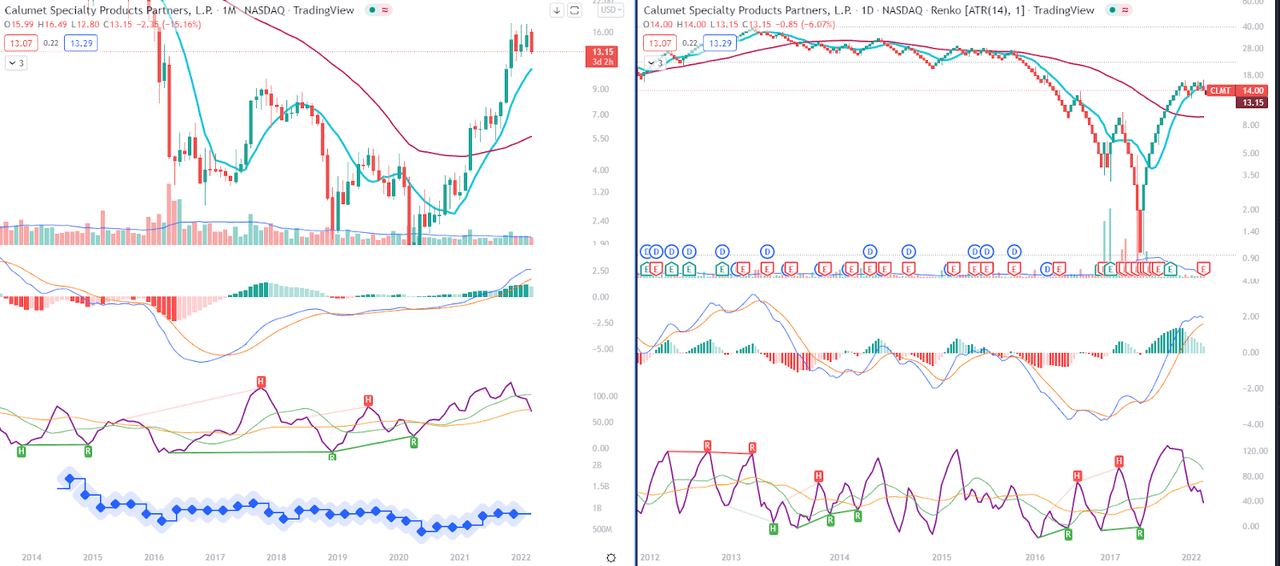
The technical picture of Calumet is not encouraging. MACD on both the monthly chart and on the daily Renko seems to be making a horseshoe-turn at the top and slowly dropping in the direction of the signal. As well, CIDI on both panes is clearly dropping. If not for my wish to be coherent and not practice cherry-picking when a screener turns to work on its weaker side, I would have not included Calumet in this article.
Conclusions
From the abovementioned selection, M/I Homes and SSR Mining are my favorites, mainly because I already own the former and the latter is backed by the price action of gold.
I hope you enjoyed reading about my quest and love for backtesting. It’s always an exciting moment to open my screeners and see what they have in store for me. Once you craft a system, you may choose: to either trust and follow it, or get inspired by it but still tinker. I must admit, for the last 5 years I have designed quite a number of strategies, and those that have performed the best for the last 2-3 years keep on giving. It’s just my nature that I don’t always keep my discipline. I am but a weak human. Nonetheless, I like to think that I am improving.
Be the first to comment