

Andrew Burton/Getty Images News
Investment Thesis
The market narrative goes something like this – The Fed will soon have to stop rate increases and start easing because the economy will slow and it will be a soft landing; The so-called ‘Fed pivot’. But the market narrative has been saying the same thing for about 6 months and keeps getting disappointed. I believe we will see new bear market lows in 2023 because the market is not pricing in a bad recession and hard landing. That is what we are going to get.
A Hard Landing is in the Cards
For about two decades I have been using a chart of LIBOR rates to make a point. Each time Central Banks embark on a rising interest rate cycle, a recession develops at lower rates in each new cycle. LIBOR rates are no longer used because they were plagued with scandals so now the benchmark is the Secured Overnight Financing Rate (SOFR). I could not find a chart that combined the two rates so I made my own.
Macrotrends &Self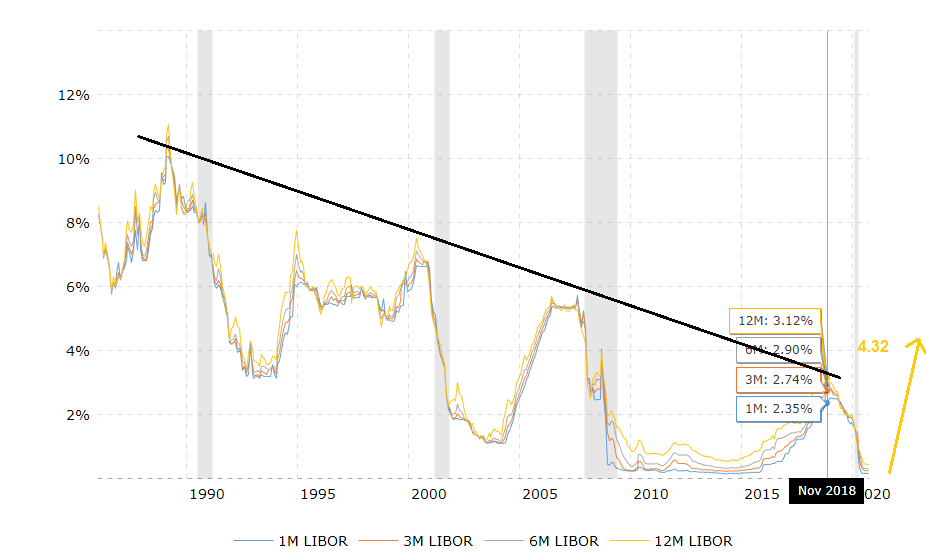
The grey areas mark US recessions and those preceding 2018 were quite severe. After the peak with rates in 2018 , there was small recession or more of an economic slowdown in late 2018 and into 2019. This article highlights the fundamentals back then. Interesting that the 2018 peak also preceded the brief but severe 2020 Covid-19 recession. My point is, that with each increasing rate cycle, it negatively effects the economy with lower peak rates. I believe this is a simple function of a continued increase in private and public sector debt as time marches on. More so in the past 3 years with zero interest rates and Covid-19 money printing. I highlighted the SOFR increase with the yellow arrow. These rates increased from near 0% in March 2022 to 4.32% on December 15th with the last Fed increase.
The big problem the Fed faces is they can only affect the demand side of the inflation story when the current inflation is caused by the supply side, meaning supply shortages and supply chain disruptions from government Covid-19 policies. I have no doubt that the Fed wants to see a recession and especially a slowdown in jobs growth. No doubt you have heard numerous stories of strikes and higher wage settlements. There were 374 worker strikes started in 2022 – a 39%increase over 2021, according to a database run by Cornell. A cycle of higher wages is causing the current inflation to become entrenched in the economy and this is something the Fed fears.
While the current 4.32% is well above the 2018 peak, the Fed plans to go much higher still. This chart is from Chatham Financial and shows the current rate and the projected forward curve to lower rates. The Fed Dot Plots show where the Fed thinks rates will go. I don’t put much faith in these because they are really just guesses by Fed governors. My guesses are in red and purple. Fed Chairman Powell has made it clear that rates are going much higher. Though financial conditions have tightened “significantly” in the past year, Federal Reserve policy isn’t “sufficiently restrictive” yet, Powell said.
“I would say it’s our judgment today that we’re not in a sufficiently restrictive policy stance yet, which is why we say that we would expect that ongoing hikes will be appropriate,” he said. “I would point you to the SEP again for our current assessment of what that peak level will be.”
Chatham Financial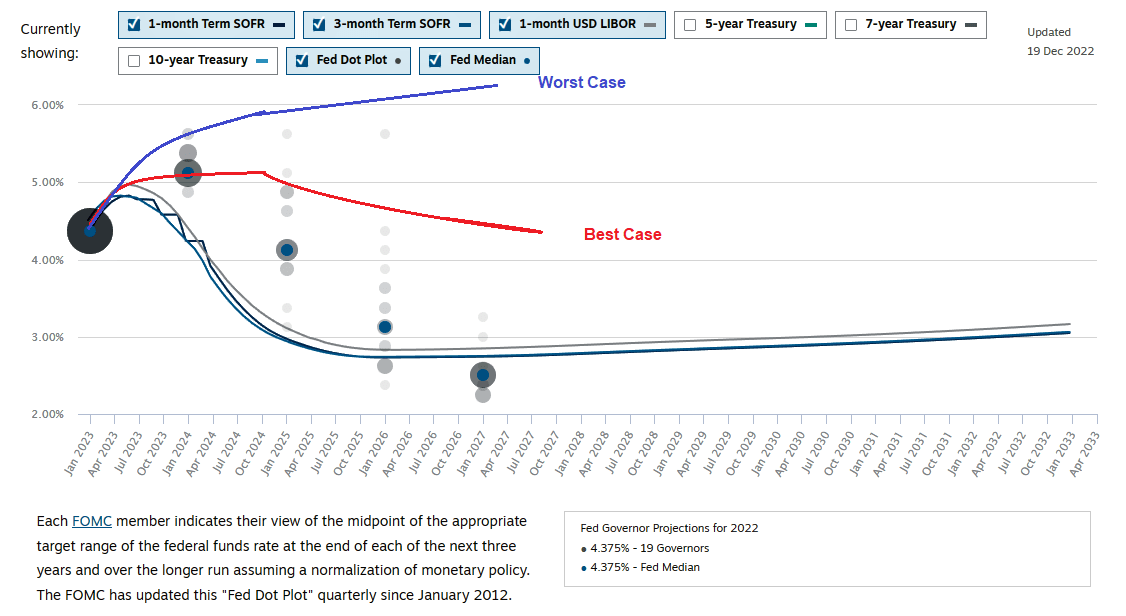
As you can see, the Forward curve that looks at SOFR futures and swap rates is predicting rates to peak in the first half of 2023 and start to decline. The Fed’s dots are predicting a slower decline but from a higher level. All the predictions here are based on declining inflation. What if inflation soon stops to decline or forbid heads back up? I believe we are in for a prolonged period of stagflation, like the 1970s and early 80s. My best case is inflation is more stubborn so rates don’t start to come down until late 2024. The worst case is if inflation heads back up and goes higher.
Markets can turn at anytime and these days trade more on the narrative, so reality can set in at anytime. I also believe the market might be betting on a dovish FOMC next year. In 2023 the Fed is losing 3 hawks from the FOMC – James Bullard, Loretta Mester and Ester George. Mester and Bullard are in the media often so some recent hawkish press examples:
-
Loretta Mester, Bank of Cleveland “We need to continue to bring up interest rates into a restrictive stance,” Mester said. “We did a lot of work this year” moving rates up aggressively, she said, adding once the Fed finishes raising rates, it will need to hold them there for “quite a while in order to get inflation on a sustainable downward path.”
-
James Bullard, Bank of St Louis said November 29th, financial markets are underestimating the chances that policymakers will need to be more aggressive next year in raising interest rates to curb inflation. “There is still a heavy degree” of expectations that inflation will go away naturally, Bullard said in a webcast interview with MarketWatch and Barron’s.
These hawks will be replaced by FOMC members who are believed to be more dovish. In general the FOMC usually goes along with the chair, in this case Powell. Powell’s hero appears to be past Chairman Paul Volcker, who is widely accredited to wrestling inflation down in 1979 to early 80s. However, Volcker made a huge mistake by easing interest rates too soon in 1980 as the US went into a recession. Inflation surged back up and Volcker had to push rates higher still. Powell is dead fast on not making that mistake and has stated numerous times that once a restrictive interest rate level is reached, it will stay that way for quite some time.
Even with a dovish FOMC, Powell can veto their vote and keep his hawkish stance underway. In fact Volcker was basically under mutiny from the FOMC when he was so restrictive in 1979 and 1980, but somehow he got them on board with his direction.
I believe with Powell’s current stance, a significant recession will be the outcome, not the soft landing the market is pricing in. The Fed practically never achieves this soft landing or Goldilocks economy. Nine times since 1961, the central bank has embarked on a series of interest rate increases to rein in inflation. Eight times a recession followed. The only true “soft landing” – as significant rate hikes with no subsequent slumps are called – occurred in 1994, according to a March 25 report by investment bank Piper Sandler. Not a very good track record. And remember early in the year, the Fed said inflation would be transitory. I guess we are still in transit?
If the Fed’s plan of action is not bearish enough for the economy, check the yield curve.
guruforces.com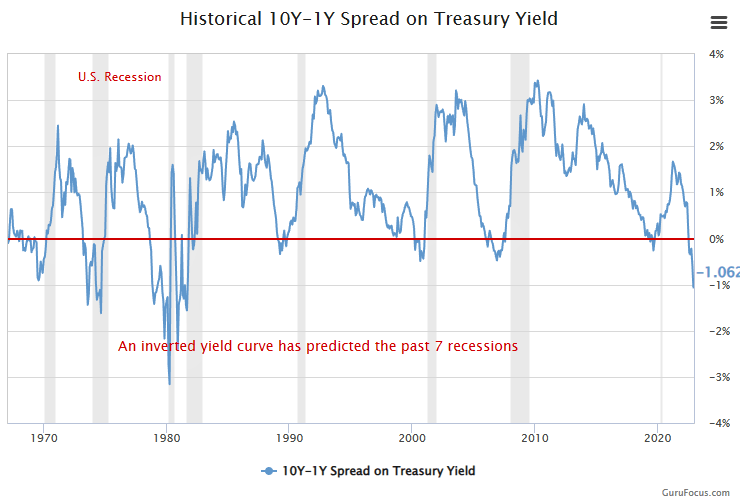
An inverted yield curve has a strong track record of predicting recessions and the current inversion has not been this severe since the 1970s, early 80s period of stagflation. History does not repeat but usually rhymes and this yield curve is shouting a bad recession.
Current Economic Status
The monthly data published by the US Census Bureau revealed on December 20th that Housing Starts declined by 0.5% on a monthly basis in November following October’s 2.1% contraction. In the same period, Building Permits fell by 11.2%, compared to a 3.3% drop recorded in October. Nothing drastic in housing so far but the decline is continuing and remember that rate increases take time to show effects. It is near impossible for first time buyers to get into this market with the high prices from the past up cycle and now much higher mortgage costs. This will eventually bleed through the whole housing market in a negative fashion.
CNN reports that US retail sales fell sharply at the start of the holiday shopping season, dropping by 0.6% during the month of November, according to data released last week by the Commerce Department. Pullbacks in auto sales helped drive the decline – the largest monthly decrease seen all year – but even excluding autos, monthly sales declined by 0.2%, despite cooling inflation. It was much worse than market forecasts of a 0.1% decline. Very few analysts have experience with inflation these days and these retail sales numbers ignore it. Retail sales would be a lot lower if the prices of the sales were not inflated. If inflation is 7%, than the decline adjusted for inflation is -7.6%.
The Michigan Consumer Sentiment survey looks very bad. It rebounded a bit in December to 59.1 and has already hit the lowest level in 30 years. The US economy is about 70% consumer spending so this number is screaming recession. And take notice, this index bottoms during a recession so is probably headed lower.
University of Michigan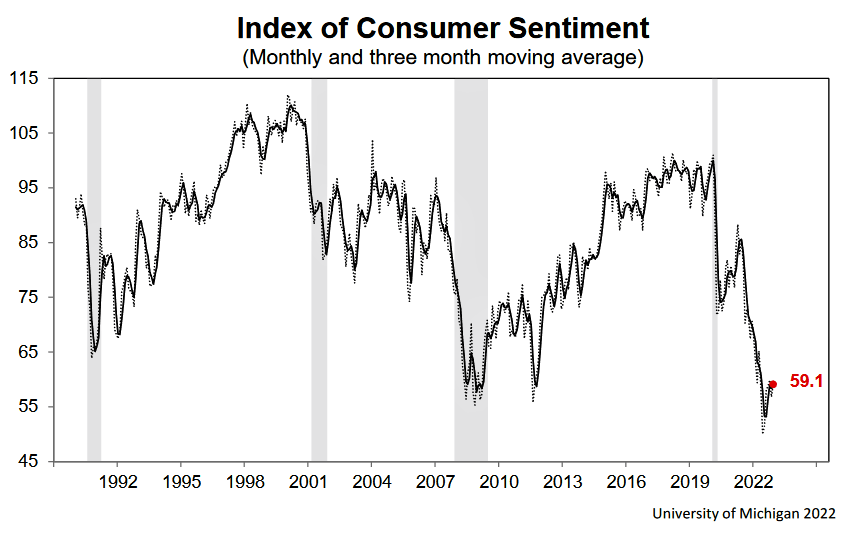
The November ISM manufacturing index registered 49.0, falling short of expectations for a 49.8 print. The index fell 1.2 percentage points ((pp)) from the October’s reading of 50.2. A number below 50 is a signal of contraction, so just another indicator suggesting a recession.
I could probably dig up more negative indicators pointing to a recession other than US job numbers that remain robust in this environment. The November jobs report from the Bureau of Labor Statistics showed 263,000 nonfarm payroll jobs were added to the economy, continuing a trend of modest job gains. People who stayed in their current jobs saw a 7.6% change in their wages, while those who changed jobs saw a 15.1% increase in their pay. As I mentioned above, these high wage increases will entrench inflation into the economy. Powell wants to see the job market soften so in his view more rate increases will be required.
The main reason inflation is down is falling energy prices that have specifically lowered gasoline prices. A political move by the Biden administration releasing oil from the Strategic Reserves ahead of the mid term elections takes a lot of credit, but this has now ended.
Lower gasoline prices are good for the consumers and headline inflation numbers but it is diesel fuel that drives the economy. Diesel is used in mining, forestry and most important in construction and transportation. In October, the EIA reported that diesel fuel was $5.21 per gallon vs $3.82 for gasoline.
This chart from Ycharts.com shows prices have declined from their peak but still very high. I believe this will continue to exert inflation pressure in the economy.
Ycharts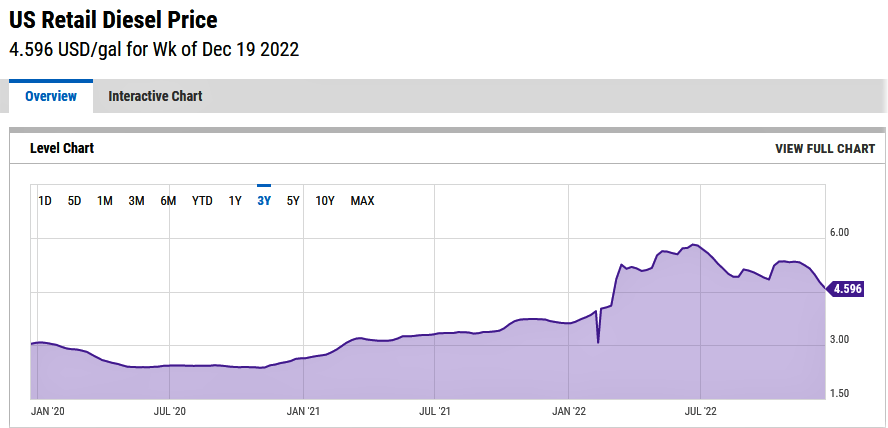
Oilprice.com warned on November 17th that U.S. distillate stocks, which include diesel and heating oil, have slumped to their lowest level for this time of the year since 1951, just as the heating season starts and the EU embargo on Russian oil product imports kicks in this coming February. The total distillate inventory figure for the U.S., which is 85% to 90% diesel with other distillates such as heating oil in the mix, showed a slight increase to 106.78 million barrels, up from 106.357 million. That puts inventories at 81.8% of the five-year average for the final weekly report of October, excluding data from 2020 skewed because of the pandemic. The last weekly report from the EIA shows inventories at 120,171 million so some improvement from lows.
I have been warning of a perfect storm for energy prices this winter with my last analysis here on November 22nd. I believe we are at a bottom with energy prices and shortages this winter could cause significant price increases. This seems likely to happen and would support my worst case scenario on inflation.
The Financial Post reported in last Saturday’s edition that a group of fixed-income investors overseen by the Bank of Canada is livid over Finance Minister Chrystia Freeland’s decision to cancel a series of inflation-protected bonds. The group said, “Some members enunciated that the decision may create a perception that the government may not have full confidence in containing inflation.” While this relates to just Canada, who is tied very closely to the US economically and higher inflation in Canada would probably go along with higher US levels.
This is probably the easiest forecast and obvious recession in history, yet I believe markets are only pricing in a soft landing. Now with a hard landing, where would the S&P 500 (SP500) go in 2023 and where will it be at year end?
I believe it is easy to predict significant new lows in 2023, the level at year end is anybody’s guess. Never the less here is mine. I expect the market will unwind all its excess since at least 2020 going down to 3,000 or less. This would be a further -14% drop from the October 2022 lows, not that drastic. However a drop to test 2019 and 2020 lows around 2400 would not surprise me and that would be -31% below the 3500 low. I expect these lows in the September to October 2023 time frame that are historically bad months for the market. Markets always look ahead so we will see a rebound form the bear market lows, anticipating a recovery.
Yardeni research provides great charts and insights on SP500 earnings so below is their historical chart and forecast. The consensus forecast for 2023 is 230.63 and Yardeni is projecting a lower number for 2023 of 225. Inflation has a positive impact on a lot of company revenues and earnings because they will be reporting higher inflated numbers. However a bad recession would be a negative influence on many companies as well, note the declines in the 2008 and 2020 recessions. I am thinking there will be a modest decline in 2023 that could worsen in 2024, so I will pick an even 220 for end of 2023.
Yardeni Research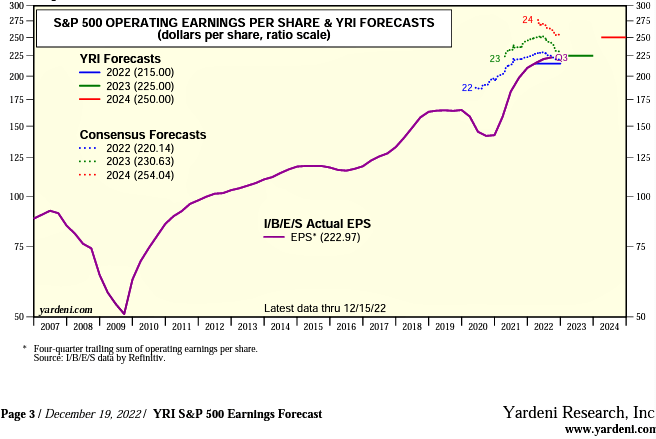
Most of the decline in the market will evolve from a decline in the p/e ratio as investors in a bear market should put a lower ratio on the future earnings outlook. The historic chart here is from macrotrends.net and you can see that the ratio has been above 20 for the better part of the last 3 decades. The 2009 high was a freak because the market fell much quicker than earnings. The earnings decline played catch up. I believe we will at least see a test of the 2011 low around 13.00.
MacroTrends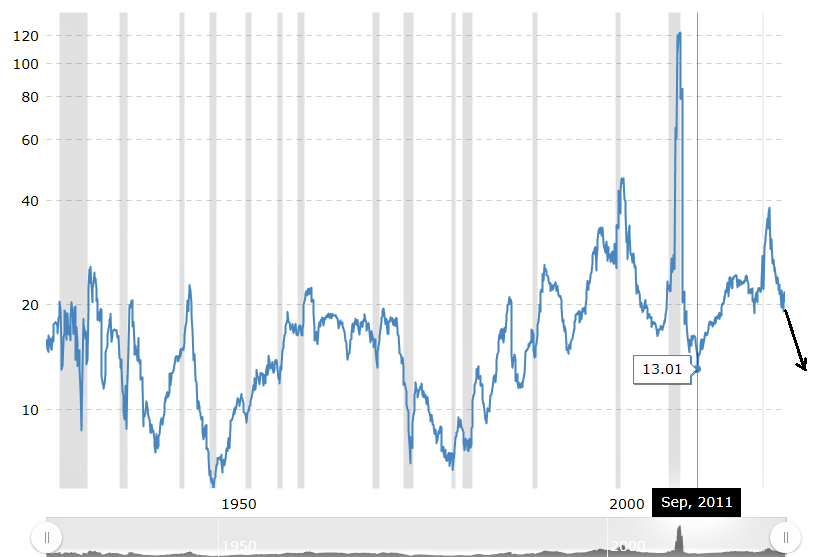
In conclusion with earnings of 220 and a ratio of lucky 13, I am predicting the SP500 at end of 2023 at 2860. The main risk to the downside is that a recession develops quicker and is even more severe in 2023. My forecast is quite bearish so I hope that does not happen. With such a bearish forecast, there is probably more risk to the upside. Perhaps the Fed gets it right and tames inflation with a soft landing and market consensus is right with higher earnings and rates starting to come down in mid 2023. This would likely mean a bear market low around 3300 to 3400, well above my forecast close for 2023. In this regard, I hope my forecast is wrong but I am more of a realist and I don’t think Goldilocks will be anywhere to be found in 2023.
bigcharts.com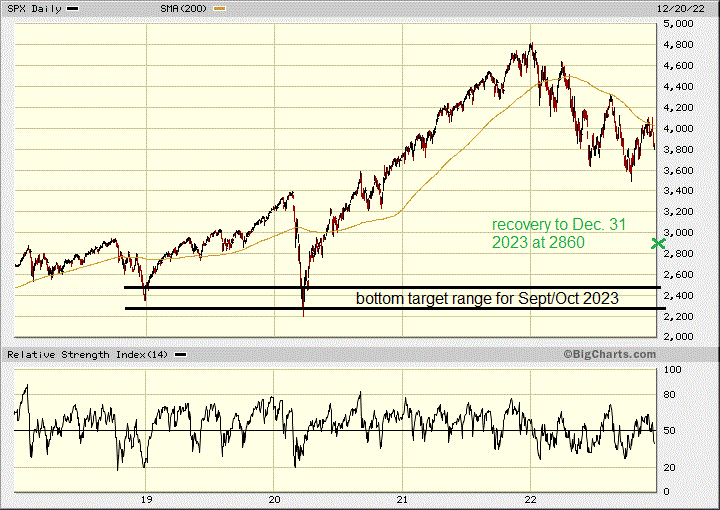
Be the first to comment