

gradyreese
To understand the 2022 bear market, we must understand the various phases that have already happened and are still likely to happen.
Phase One: inflation shock (likely ended with peak inflation of 9.1% in June). Peak Decline -24% From All-Time Highs
This was when inflation was running riot, juiced by soaring commodity prices (nickel prices tripled in a single day). The market was gripped by the uncertainty about how high US inflation might eventually reach.
Phase Two: The Fed Goes On The Inflation-Fighting War Path (Current Phase): Peak Decline So Far -26% From All-Time Highs
The Fed responded to the highest inflation in 41 years with unprecedented rate hikes, now expected to be at least four (and a 36% chance of five) consecutive 0.75% hikes (the previous record was two).
Short-term treasury yields, like the 3-month and 2-year US bonds, track the Fed Funds rate closely and have been soaring all year.
CME Group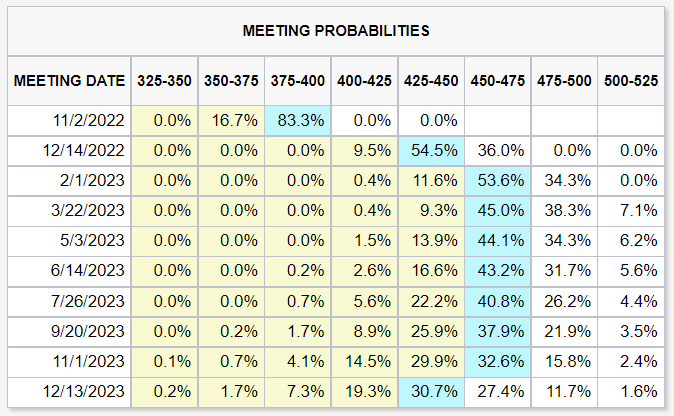
Long bonds have also been tracking the Fed rate, mostly because the economy is still too strong to make investors really worried about recession.
- the 2023 recession that 80% of CEOs expect is expected to start between Q1 and Q3 2023
You can think of phase two as this bear market’s interest rate shock phase.
It looks like long bond yields might have peaked at 4% because a slowing economy and falling long-term inflation expectations naturally place a cap to how high long-term rates can go.
It also looks like a 26% peak decline in the S&P is as bad as phase 2’s pain might get.
But that doesn’t mean the bear market is over. Phase three hasn’t even begun yet.
Phase 3 Slowing Earnings Growth Expectations: Peak Decline Potentially -30% From All-Time Highs
Morgan Stanley’s Chief Investment Officer Mike Wilson has been beating this drum for six months as the next big leg lower for stocks.
Phases one and two brought the market’s forward PE down to 15.1, 10% historically undervalued. If nothing else bad were to happen, stocks would be no reason to fall any lower than they already have.
But that forward PE is based on 8% EPS growth in 2023 (10% back in June).
With a slowing economy (1% to 1.4% 2023 growth according to Morgan Stanley and Moody’s), we’re unlikely to see earnings grow anywhere close to that.
This is why falling earnings estimates for 2023, which could begin with the Q3 earnings season, is why Morgan Stanley’s base case for the final S&P bottom is 3,400, about a 30% peak decline.
This base case assumes no recession in 2023, just slower growth.
Mike Wilson expects this potential bottom to likely occur by the end of Q1 2023.
Phase 4 Recessionary Earnings Decline: Peak Decline Potentially -35% to -40% From All-Time Highs
In the event of a recession in 2023 (which Goldman, Bank of America, Toronto-Dominion, and Deutsche Bank expect), earnings are likely to fall 11% to 20%.
Daily Shot 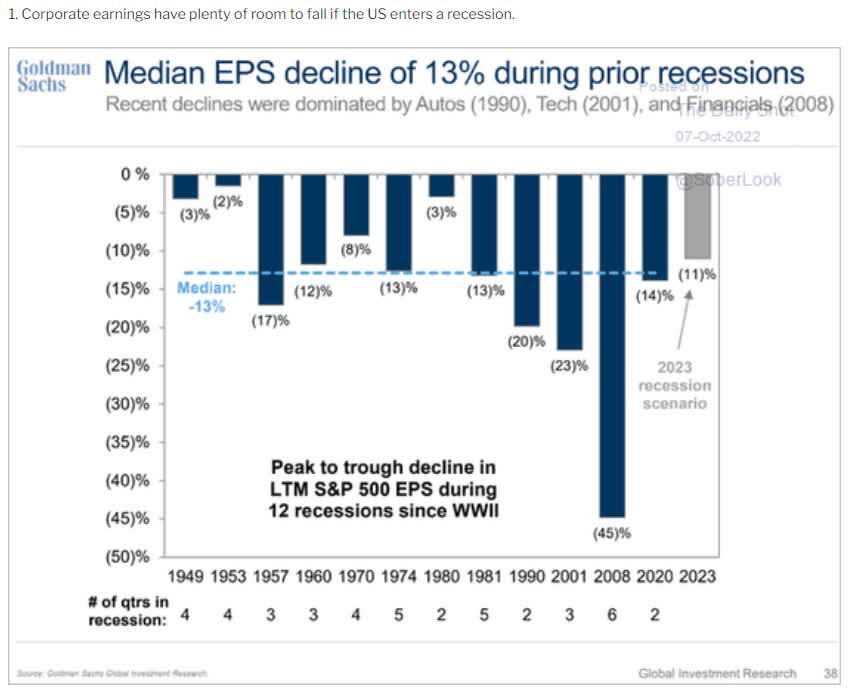
Since WWII, the median EPS decline in recessions is 13%. Goldman expects a mild recession with an 11% EPS decline creating a 35% peak decline by the time we bottom.
Daily Shot 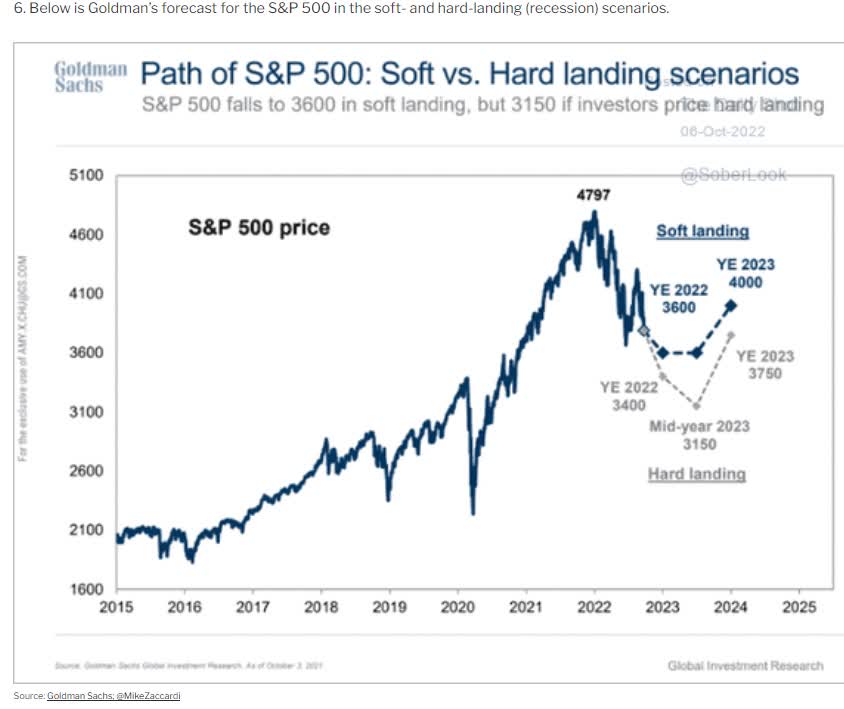
Goldman’s base case for a recession in 2023 is stocks bottoming by mid-2023 at 3,150, a 35% peak decline.
Morgan Stanley thinks that if we get a recession next year, stocks most likely bottom around 3,000 or a 38% peak decline.
- around the end of Q3 2023
Bank of America also expects a 38% potential peak decline if we get a recession (their base case).
That’s phase four, the end of this bear market… unless we get a phase five.
Phase Five Financial Crisis/Stagflation Hell Potential Peak Decline -48% to -53% From All-Time Highs
Investors think they want the Fed to pivot, but they are wrong.
This Is What Might Happen If The Fed Blinks
Ritholtz Wealth Management 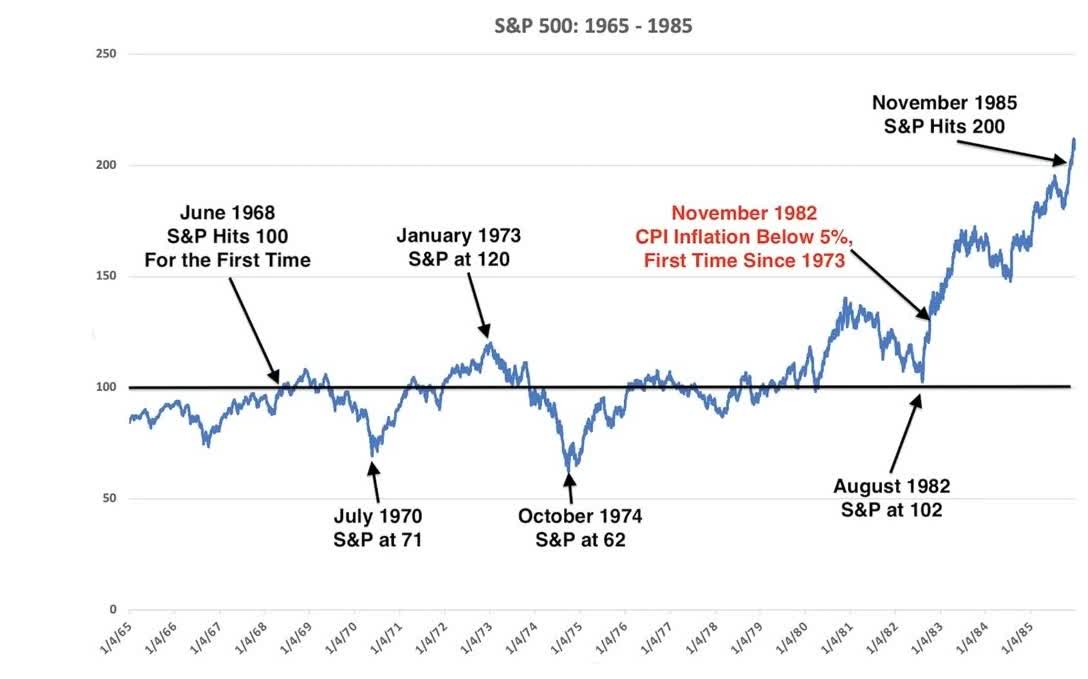
Societe Generale and UBS both fear that if the Fed doesn’t “finish the job” with inflation soon, we could be in for a long stagflationary hell period.
- multiple severe recessions
- a 48% to 53% market crash
- unemployment rising to double-digits
- a potential lost decade for stocks
If you think 2022 has been hell, it will look like a picnic compared to the true hell that could happen if inflation expectations start rising because the Fed loses its nerve.
The Fed in the 70s blinked several times. The end result was such misery and market despair that the misery index was invented, and the Dow went nowhere for 16 years.
Imagine what significantly elevated inflation and a flat market for 10+ years for retirees and pension funds would mean. It would make us beg for a return to the good old days of 2022.
The other potential catalyst for phase five of this bear market is a financial crisis, which is a low-probability risk.
NY Fed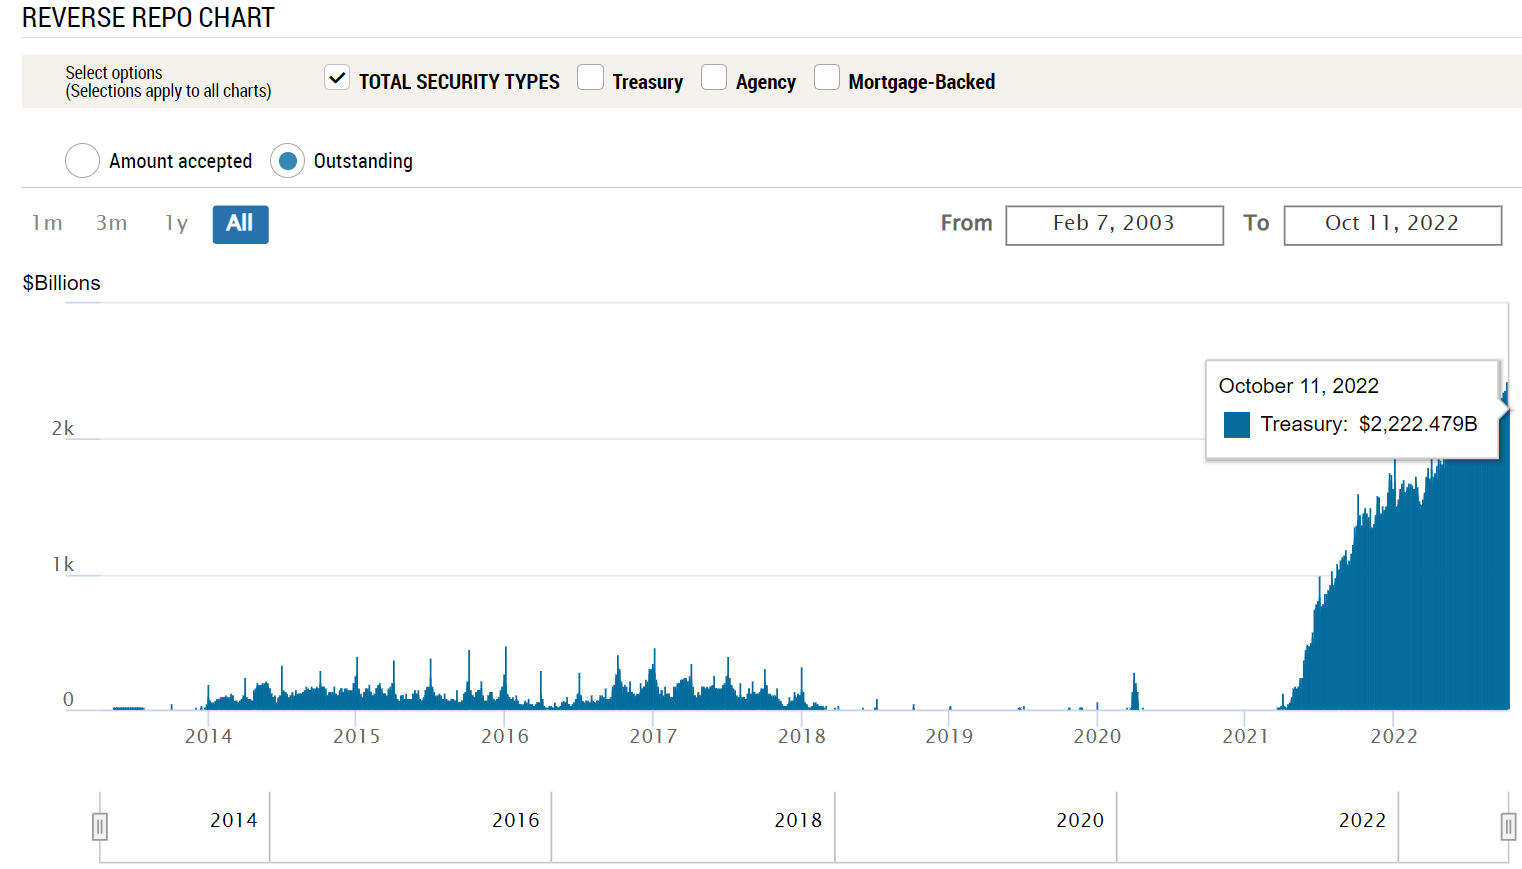
The reverse repurchase facility at the NY Fed exists precisely to provide unlimited liquidity to short-term lending markets.
NY Fed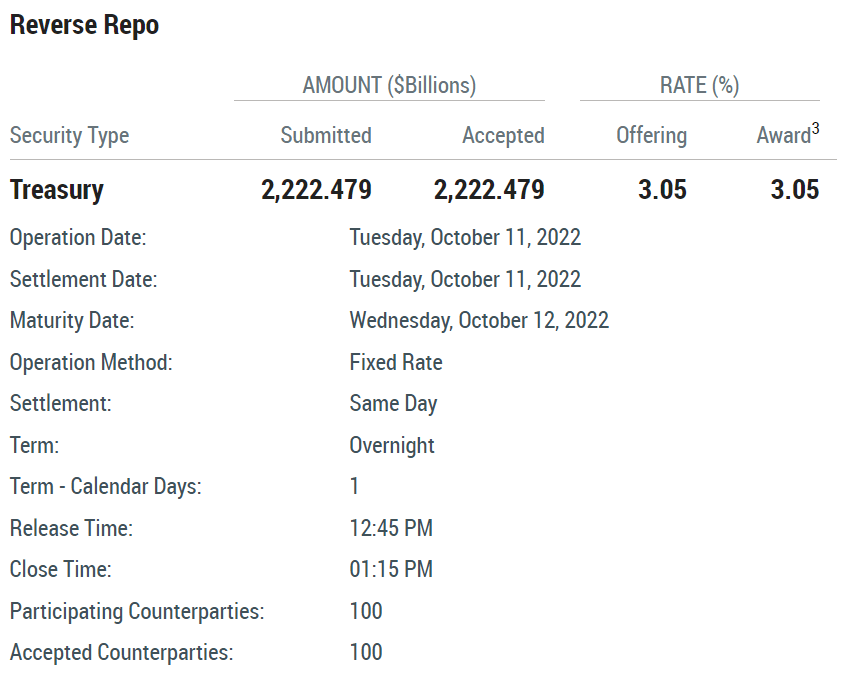
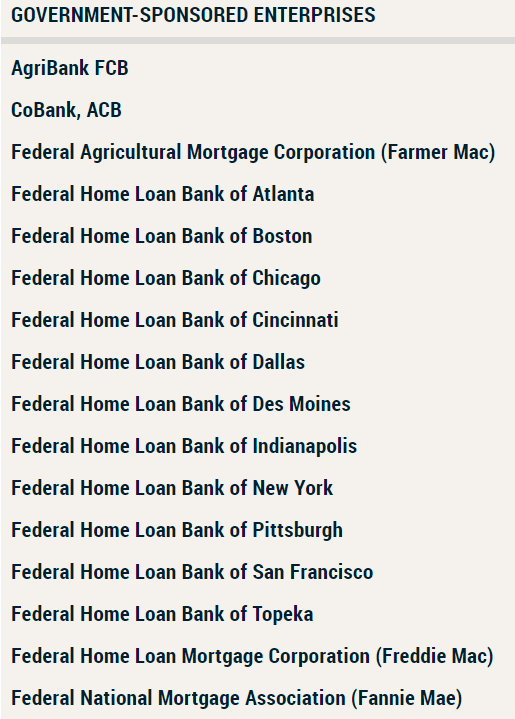
The 100 largest financial institutions in the world have the ability to temporarily sell their US treasuries to the Fed for cash at an annual interest rate of 3.05%. Who is the NY Fed supporting with its reverse repo facility?
NY Fed NY Fed NY Fed NY Fed NY Fed NY Fed NY Fed NY Fed NY Fed NY Fed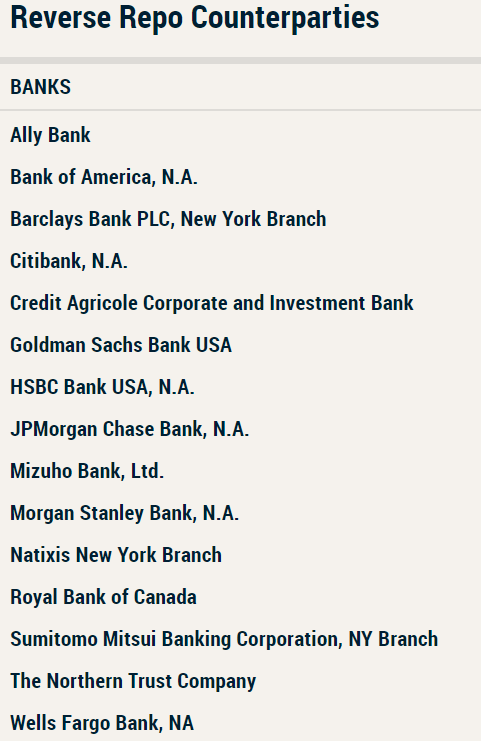
These reverse repurchase agreements last a few days, and the Fed then buys them back at a slight profit.
This is how the Fed can provide infinite cash to the financial market, trillions worth, with the push of a button.
- the big banks are safe
- your deposits at the banks are insured by the US government
- mortgages are safe
- money market funds are safe
If the Fed “hikes until something breaks,” the NY Fed’s RRP facility stands ready to give the world’s biggest financial institutions all the money they need if the bond market pukes.
But the point is that the bear market is likely not over yet. We have to be financially and emotionally prepared for stocks to possibly not bottom until mid to late 2023.
Daily Shot 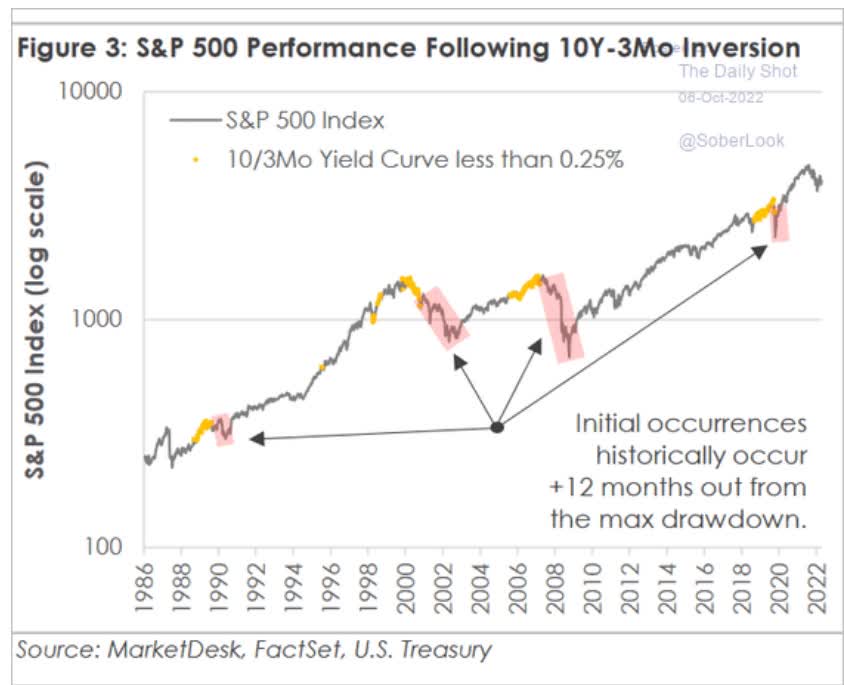
Heck, the most important yield curve of all hasn’t even inverted yet. And historically, stocks tend to bottom around 12 months after this inversion.
Dividend Kings Research Terminal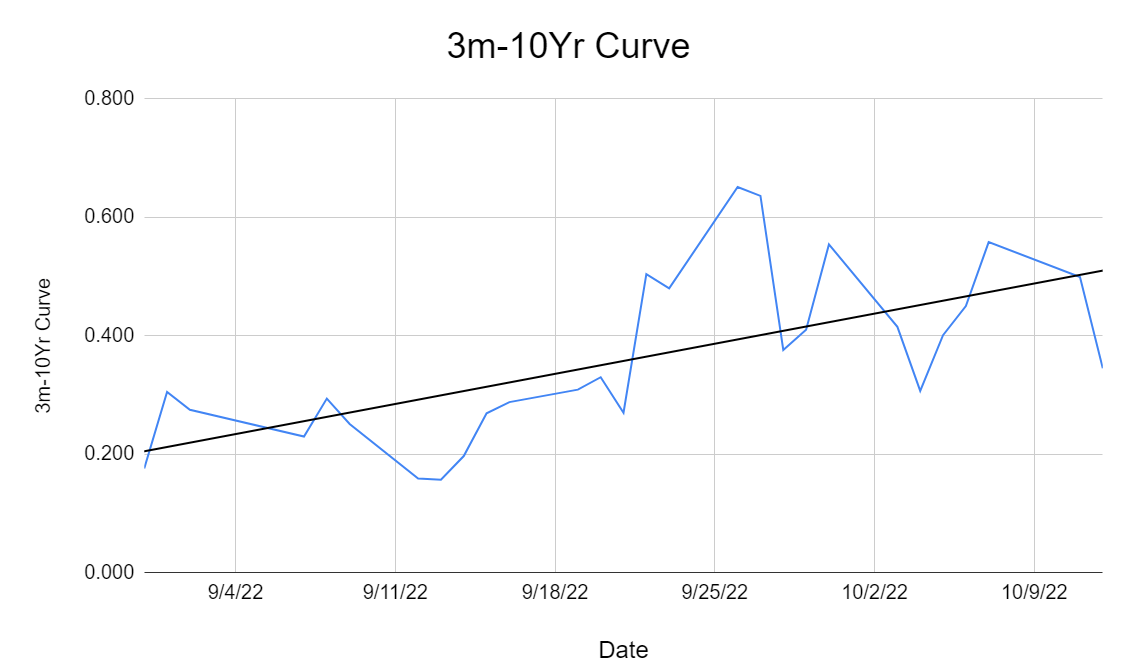
In fact, the yield curve is moving in the opposite direction you’d expect.
Dividend Kings S&P Valuation Tool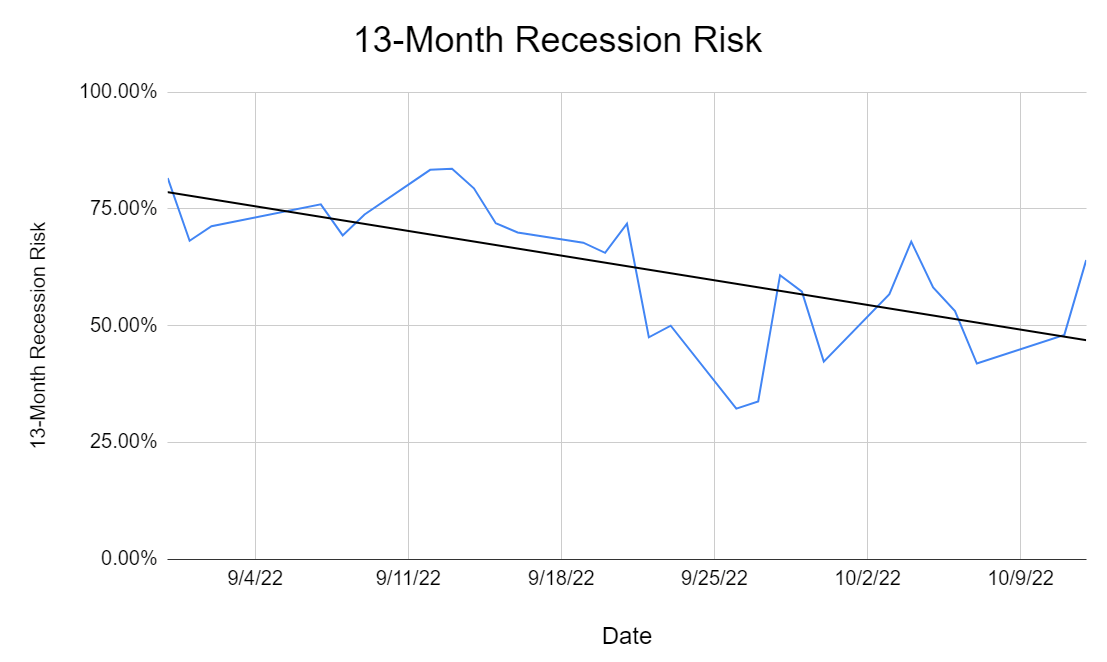
Recession risk has been falling in recent months, at least according to the bond market.
Does that mean we might actually avoid one? If the Fed weren’t so committed to hiking rates above the inflation rate, we just might. But since no less than the NY Fed president and Jerome Powell have said the Fed will hike above the inflation rate, the 3-month yield will likely rise above 10-year yields by the end of this year.
And that means the recession and likely market bottom clock will start ticking in late 2022, and a market bottom in Q4 2023 becomes even more likely.
Why is this important for you to know?
So that you can understand what’s happening and what’s likely to happen, so you can prepare yourself for what’s likely to be a pretty miserable 2023 for investors.
Does that mean you should sell stocks now?
Charlie Bilello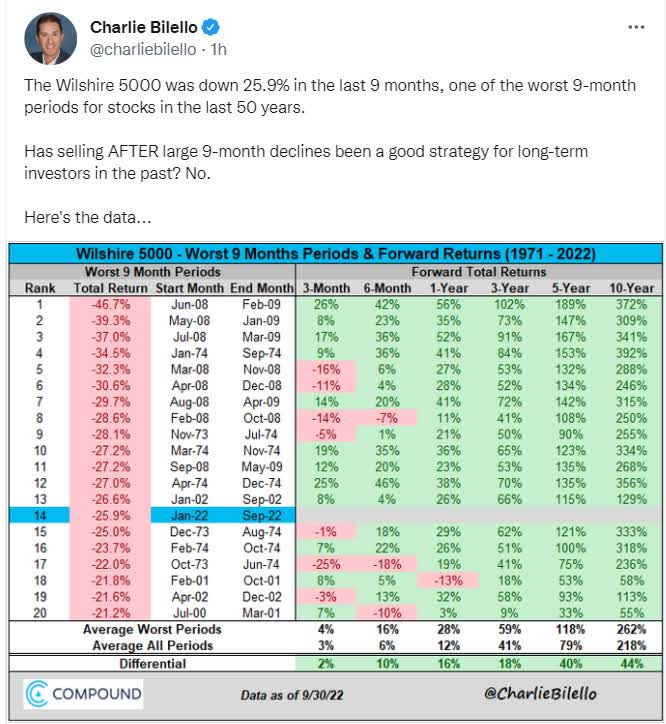
No investor in history has ever likely regretted buying and holding when stocks are down as much as they are now.
In contrast, 98% of market timers lose money.
I have over $2 million invested in stocks and am not selling a single share.
I am telling you all this so that if the likeliest outcome happens, more market pain for 6 to 12 months, you won’t be shocked into panic selling at an even worse time (very close to the likely bottom).
Nobody can predict interest rates, the future direction of the economy or the stock market. Dismiss all such forecasts and concentrate on what’s actually happening to the companies in which you’ve invested.”— Peter Lynch
These are all probabilities, not certainties. But do you know what is real, tangible, and something that can ground you in sanity during insane times?
DIVIDENDS!
Short-term gains are vanity, cash flow is sanity, and dividends are reality.” – Paraphrase of Dragon’s Den UK
Do you know what true financial freedom is? It’s living entirely off dividends alone and not ever having to sell a single share of stock to pay the bills.
When you can live off safe and growing dividends alone, stock prices are almost 100% irrelevant to your standard of living, no matter how extreme.
Dividends are the bridge between the market chaos of today and the glorious bull market that could start sooner than you think.
Dividends aren’t just for helping retirees live and sleep well during recessions and bear markets. They are an emotional puppy dog for all investors, regardless of age.
So that’s why I wanted to highlight 9 high-yield blue-chips that all retirees should consider owning. Not just in this bear market but all future bear markets.
They can help you stay safe and sane during turbulent economic times and market mayhem. And that’s just what you need if you want your golden years to remain golden.
How To Find The Best High-Yield Retirement Dream Stocks… In 2 Minutes
Let me show you how to screen the Dividend Kings Zen Research Terminal, which runs of the DK 500 Master List, to easily find the best high-yield Ultra SWANs (sleep well at night) blue-chips for retirees.
The Dividend Kings 500 Master List includes some of the world’s best companies, including:
- every dividend champion (25+ year dividend growth streaks, including foreign aristocrats)
- every dividend aristocat
- every dividend king (50+ year dividend growth streaks)
- every Ultra SWAN (as close to perfect quality companies as exist)
- the 20% highest quality REITs according to iREIT
- 40 of the world’s best growth blue-chips
| Step | Screening Criteria | Companies Remaining | % Of Master List |
| 1 | Reasonable Buy, Good Buy, Strong Buy, Very Strong Buy, Ultra Value Buy (Never Overpay For Stocks) | 412 | 81.75% |
| 2 | Quality 13 (Ultra SWAN, sleep well at night) | 112 | 22.22% |
| 3 | Total Return 10+% | 91 | 18.06% |
| 4 | Investment Grade Credit Rating (BBB- Or Higher) | 77 | 15.28% |
| 5 | 3+% yield (Vanguard’s definition of high-yield) | 34 | 6.75% |
| 6 | Sort By Yield | ||
| 7 | Use “Build Your Watchlist” To Select The Highest Yielding Companies in Each Sector | 9 | 1.98% |
| Total Time | 2 minutes |
In just two minutes, we can put together a completely diversified ultra-high-yield Ultra SWAN portfolio with fundamentals to make grown men weep with joy.
The 9 Best High-Yield Blue-Chips All Retirees Should Consider Owning
I’ve linked to articles about each company for further research purposes.
(Source: Dividend Kings Zen Research Terminal)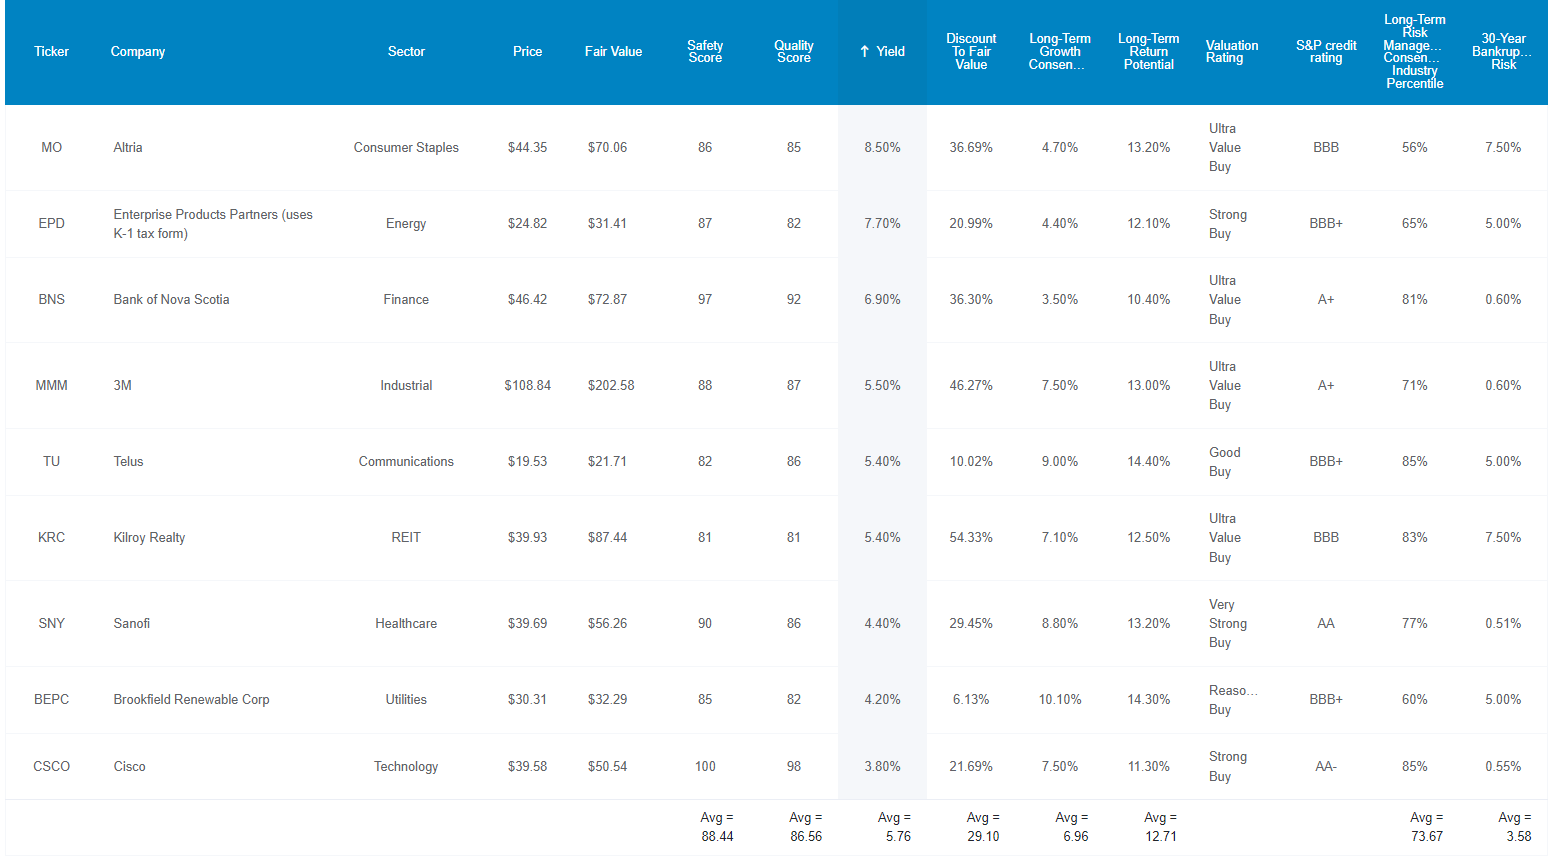
Here they are in order of highest to lowest yield.
Tax Implications
- TU and BNS are Canadian companies.
- 15% dividend tax withholding IN TAXABLE ACCOUNTS ONLY.
- none in tax-deferred retirement accounts
- tax credit available for non-taxable accounts to recoup the withholding
- SNY is a French company
- 15% withholding for US investors
- own TU and BNS in retirement accounts to avoid the withholding
- own SNY in a taxable account to get the tax credit
Why are these 9 high-yield Ultra SWANs every retire should consider owning? Let’s find out.
9 Of The Safest High-Yield Blue-Chips On Earth
(Source: Dividend Kings Zen Research Terminal)
These aren’t just the highest-yielding blue-chips in each sector; they are the highest-yielding Ultra SWAN quality blue-chips in each sector. That means as close to perfect quality dividend stocks as exist in a highly diversified portfolio in my opinion.
To see just why these are the most dependable ultra-yielding choices for retirees, let’s see how they compare to the bluest of blue-chips, the dividend aristocrats.
Exceptional Quality On Par With The Dividend Aristocrats
| Metric | Dividend Aristocrats | 9 High-Yield Ultra SWANs |
Compared To Aristocrats |
| Quality | 87% | 87% | 100% |
| Safety | 90% | 88% | 98% |
| Average Recession Dividend Cut Risk | 0.5% | 0.5% | 100% |
| Severe Recession Dividend Cut Risk | 1.50% | 1.60% | 107% |
| Dependability | 84% | 85% | 101% |
| Dividend Growth Streak (Years) | 44.8 | 23.2 | 52% |
| Long-Term Risk Management Industry Percentile | 67% Low Risk, Above-Average | 74% Low Risk, Good | 110% |
| Average Credit Rating | A- Stable | A- Stable | NA |
| Average Bankruptcy Risk | 3.04% | 3.58% | 118% |
| Average Return On Capital | 105% | 261% | 249% |
| Average ROC Industry Percentile | 83% | 84% | 101% |
| 13-Year Median ROC | 89% | 187% | 210% |
| Forward PE | 18.1 | 10.1 | 56% |
| Discount To Fair Value | 11% | 29% | 264% |
| DK Rating | Good Buy | Very Strong Buy | NA |
| Yield | 2.8% | 5.8% | 206% |
| LT Growth Consensus | 8.6% | 7.0% | 81% |
| Total Return Potential | 11.4% | 12.7% | 112% |
| Risk-Adjusted Expected Return | 7.7% | 8.5% | 110% |
| Inflation & Risk-Adjusted Expected Return | 5.5% | 6.3% | 114% |
| Conservative Years To Double | 13.0 | 11.5 | 88% |
| Average | 125% |
(Source: Dividend Kings Zen Research Terminal)
The average risk of a dividend cut from these Ultra SWANs is:
- 0.5% in a historically average recession
- 1.6% in a severe Pandemic or Great Recession downturn
Ben Graham considered 20+ year dividend growth streaks an important sign of excellent quality. These Ultra SWANs have an average dividend growth streak of 23.2 years, almost an aristocrat portfolio.
Joel Greenblatt considers return on capital, or ROC, to be his gold standard proxy for quality and moatiness. Using valuation and ROC, Greenblatt earned 40% annual returns for investors over 21 years.
- ROC = annual pre-tax profit/the cost of running the business
- 14.6% was the S&P 500’s ROC in 2021
The aristocrats have generated 105% ROC in the last year, but these Ultra SWANs delivered ROC of 261%.
- 2.5X more than the aristocrats
- 18X more than the S&P 500
Their 13-year median ROC is 187%, far above the aristocrat’s 89%.
Their ROC is in the 84th industry percentile, signifying a wide and stable moat.
S&P estimates their average 30-year bankruptcy risk at 3.58%, an A- stable credit rating, the same as the dividend aristocrats.
Seven risk-rating agencies estimate their long-term risk management in the 74th industry percentile.
- low risk
- good risk management
- based on over 1,000 metrics ranging from moat and brand stability, R&D efficiency, supply chain management, labor relations, and even climate change adaptability
Long-Term Risk Management Is The 127th Best In The Master List (75th Percentile)
| Classification | Average Consensus LT Risk-Management Industry Percentile |
Risk-Management Rating |
| S&P Global (SPGI) #1 Risk Management In The Master List | 94 | Exceptional |
| Foreign Dividend Stocks | 76 |
Good |
| 9 High-Yield Ultra SWANs | 74 |
Good |
| Strong ESG Stocks | 73 |
Good |
| Ultra SWANs | 70 | Good |
| Low Volatility Stocks | 68 | Above-Average |
| Dividend Aristocrats | 67 | Above-Average |
| Dividend Kings | 63 | Above-Average |
| Master List average | 62 | Above-Average |
| Hyper-Growth stocks | 61 | Above-Average |
| Monthly Dividend Stocks | 60 | Above-Average |
| Dividend Champions | 57 | Average bordering on above-average |
(Source: DK Research Terminal)
These Ultra SWAN’s risk-management consensus is in the top 25% of the world’s highest quality companies and similar to that of such other blue-chips as
- Johnson & Johnson (JNJ) Ultra SWAN dividend king
- T. Rowe Price (TROW): Ultra SWAN dividend aristocrat
- Novo Nordisk (NVO): Ultra SWAN global aristocrat
- Home Depot (HD): Ultra SWAN
- Texas Instruments (TXN): Ultra SWAN
The bottom line is that all companies have risks, and these Ultra SWANs are good at managing theirs.
How We Monitor These Ultra SWAN’s Risk Profile
- 166 analysts
- 4 credit rating agencies
- 8 total risk rating agencies
- 174 experts who collectively know this business better than anyone other than management
- and the bond market for real-time fundamental risk assessment
When the facts change, I change my mind. What do you do, sir?” – John Maynard Keynes
There are no sacred cows at iREIT or Dividend Kings. Wherever the fundamentals lead, we always follow. That’s the essence of disciplined financial science, the math behind retiring rich and staying rich in retirement.
Now that you know why these are 9 of the safest high-yield blue-chips on earth, let’s take a look at why you might want to buy some today.
Wonderful Companies At Wonderful Prices
(Source: Dividend Kings Zen Research Terminal)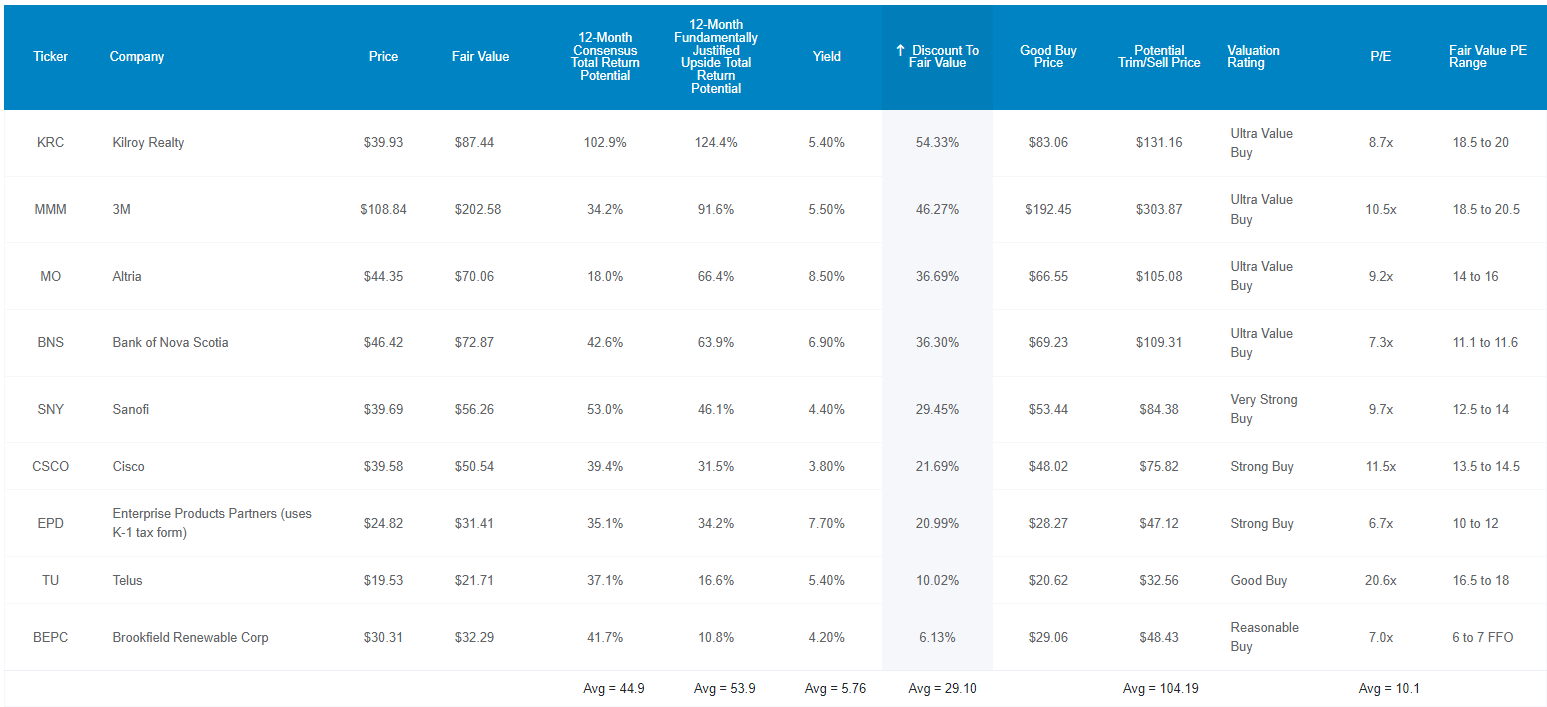
For context, the dividend aristocrats are 11% historically undervalued at 18.1X forward earnings, while the S&P 500 is 10% historically undervalued at 15.1X earnings.
These high-yield Ultra SWANs are 29% historically undervalued at a PE of 10.1X.
The last time the S&P 500 was 10X earnings was in the mid 1980s.
- 11.6 PE bottom in March 2009
These Ultra SWANs are trading at a PE the market hasn’t seen in almost 40 years and likely never will again.
Except that these Ultra SWANs are 18X higher quality than the average S&P company, according to Joel Greenblatt’s ROC.
That’s why analysts expect them to deliver 45% total returns over the next year. But they are so undervalued that they could deliver 54% total returns within 12 months by simply growing as expected and returning to historical mid-range market-determined fair value.
But my goal isn’t to help you make a quick 45% return or even 54% within a year.
Here’s how these high-yield Ultra SWANs can potentially earn you 36X returns in the coming decades.
How These Ultra SWANs Can Help You Retire In Safety And Splendor
(Source: Dividend Kings Zen Research Terminal)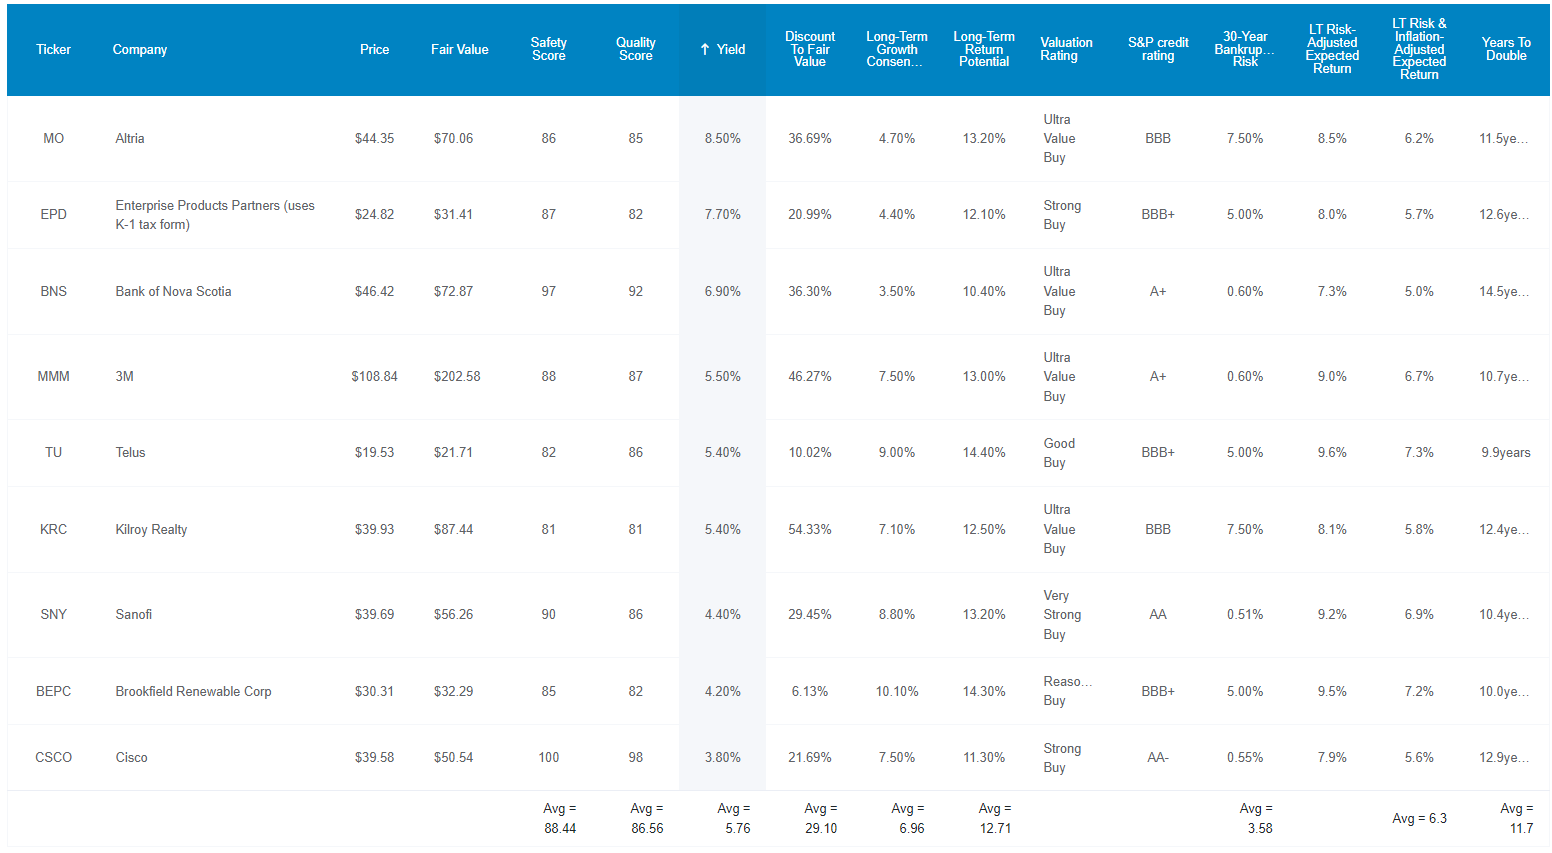
These Ultra SWANs don’t just offer one of the world’s safest 5.8% yields on earth, but they are also going 7% per year.
- 12.8% CAGR consensus long-term return potential
How impressive is that?
| Investment Strategy | Yield | LT Consensus Growth | LT Consensus Total Return Potential | Long-Term Risk-Adjusted Expected Return | Long-Term Inflation And Risk-Adjusted Expected Returns | Years To Double Your Inflation & Risk-Adjusted Wealth |
10-Year Inflation And Risk-Adjusted Expected Return |
| 9 High-Yield Ultra SWANs | 5.8% | 7.0% | 12.8% | 9.0% | 6.7% | 10.7 | 1.92 |
| REITs | 3.9% | 6.1% | 10.0% | 7.0% | 4.8% | 15.1 | 1.60 |
| Schwab US Dividend Equity ETF | 3.8% | 8.50% | 12.3% | 8.6% | 6.4% | 11.3 | 1.86 |
| Dividend Aristocrats | 2.8% | 8.7% | 11.5% | 8.1% | 5.8% | 12.3 | 1.76 |
| S&P 500 | 1.8% | 8.5% | 10.3% | 7.2% | 5.0% | 14.4 | 1.63 |
| Nasdaq | 0.8% | 11.5% | 12.3% | 8.6% | 6.4% | 11.3 | 1.86 |
(Sources: DK Research Terminal, FactSet, Morningstar, Ycharts)
Higher yield than almost any high-yield blue-chip strategy and higher long-term return potential than the Nasdaq.
Now we’re cooking with gas.
Inflation-Adjusted Consensus Total Return Potential: $1,000 Initial Investment
| Time Frame (Years) | 8.1% CAGR Inflation-Adjusted S&P 500 Consensus | 9.3% Inflation-Adjusted Aristocrat Consensus | 10.6% CAGR Inflation-Adjusted 9 High-Yield Ultra SWAN Consensus | Difference Between Inflation-Adjusted 9 High-Yield Ultra SWAN Consensus And S&P Consensus |
| 5 | $1,474.78 | $1,558.49 | $1,653.42 | $178.64 |
| 10 | $2,174.97 | $2,428.88 | $2,733.79 | $558.82 |
| 15 | $3,207.60 | $3,785.39 | $4,520.11 | $1,312.51 |
| 20 | $4,730.50 | $5,899.48 | $7,473.63 | $2,743.14 |
| 25 | $6,976.43 | $9,194.27 | $12,357.05 | $5,380.61 |
| 30 (retirement time frame) | $10,288.69 | $14,329.16 | $20,431.37 | $10,142.68 |
| 35 | $15,173.53 | $22,331.82 | $33,781.62 | $18,608.09 |
| 40 | $22,377.60 | $34,803.86 | $55,855.18 | $33,477.58 |
| 45 | $33,001.99 | $54,241.40 | $92,352.01 | $59,350.02 |
| 50 | $48,670.61 | $84,534.56 | $152,696.57 | $104,025.96 |
| 55 | $71,778.35 | $131,746.09 | $252,471.41 | $180,693.06 |
| 60 (investing lifetime) | $105,857.14 | $205,324.69 | $417,441.03 | $311,583.89 |
| 100 (institutional time frame, multi-generational wealth) | $2,368,828.40 | $7,146,092.50 | $23,316,242.32 | $20,947,413.92 |
(Source: DK Research Terminal, FactSet)
Analysts think these Ultra SWANs could potentially deliver 20X inflation-adjusted returns over the next 30 years.
- 36X not adjusted for inflation
And over an investing lifetime, they could potentially deliver 417X real returns.
| Time Frame (Years) | Ratio Inflation-Adjusted 9 High-Yield Ultra SWAN Consensus/Aristocrat Consensus | Ratio Inflation-Adjusted 9 High-Yield Ultra SWAN Consensus vs. S&P consensus |
| 5 | 1.06 | 1.12 |
| 10 | 1.13 | 1.26 |
| 15 | 1.19 | 1.41 |
| 20 | 1.27 | 1.58 |
| 25 | 1.34 | 1.77 |
| 30 | 1.43 | 1.99 |
| 35 | 1.51 | 2.23 |
| 40 | 1.60 | 2.50 |
| 45 | 1.70 | 2.80 |
| 50 | 1.81 | 3.14 |
| 55 | 1.92 | 3.52 |
| 60 | 2.03 | 3.94 |
| 100 | 3.26 | 9.84 |
(Source: DK Research Terminal, FactSet)
3X the yield of the market today, and potentially 2X more wealth over 30 years, and 4X more over an investing lifetime.
Sounds wonderful, but what evidence is there that these Ultra SWANs can deliver 12% to 13% long-term returns?
Historical Returns Since 1998 (Equal Weight, Annual Rebalancing)
The future doesn’t repeat, but it often rhymes. – Mark Twain
In our case, “past performance is no guarantee of future results.”
Still, studies show that blue chips with relatively stable fundamentals offer predictable returns based on yield, growth, and valuation mean reversion over time.
Bank of America 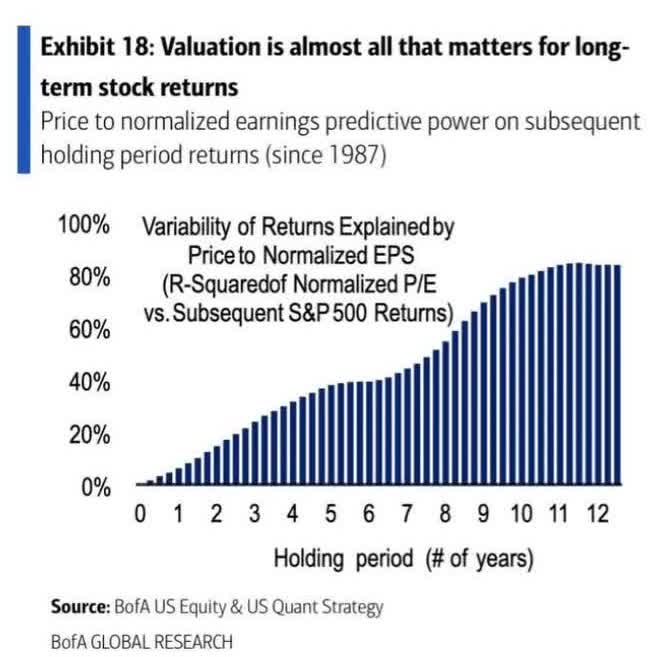
24 years is a time frame in which 95% of total returns are due to fundamentals, not luck.
(Source: Portfolio Visualizer Premium)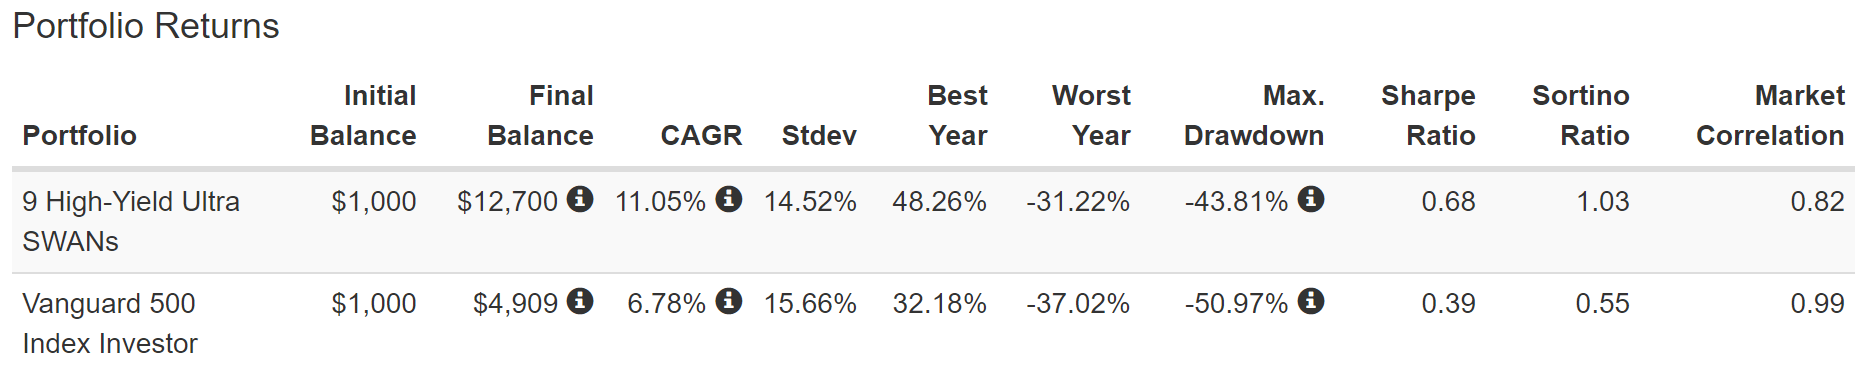
Measured from before a 50% market crash to another bear market, these Ultra SWANs delivered 11% annual returns, almost doubling the S&P 500.
The market has weighed the substance of these companies and determined with 95% statistical confidence that they are far superior to the S&P 500.
- final confirmation of all the evidence I’ve shown you today
(Source: Portfolio Visualizer Premium)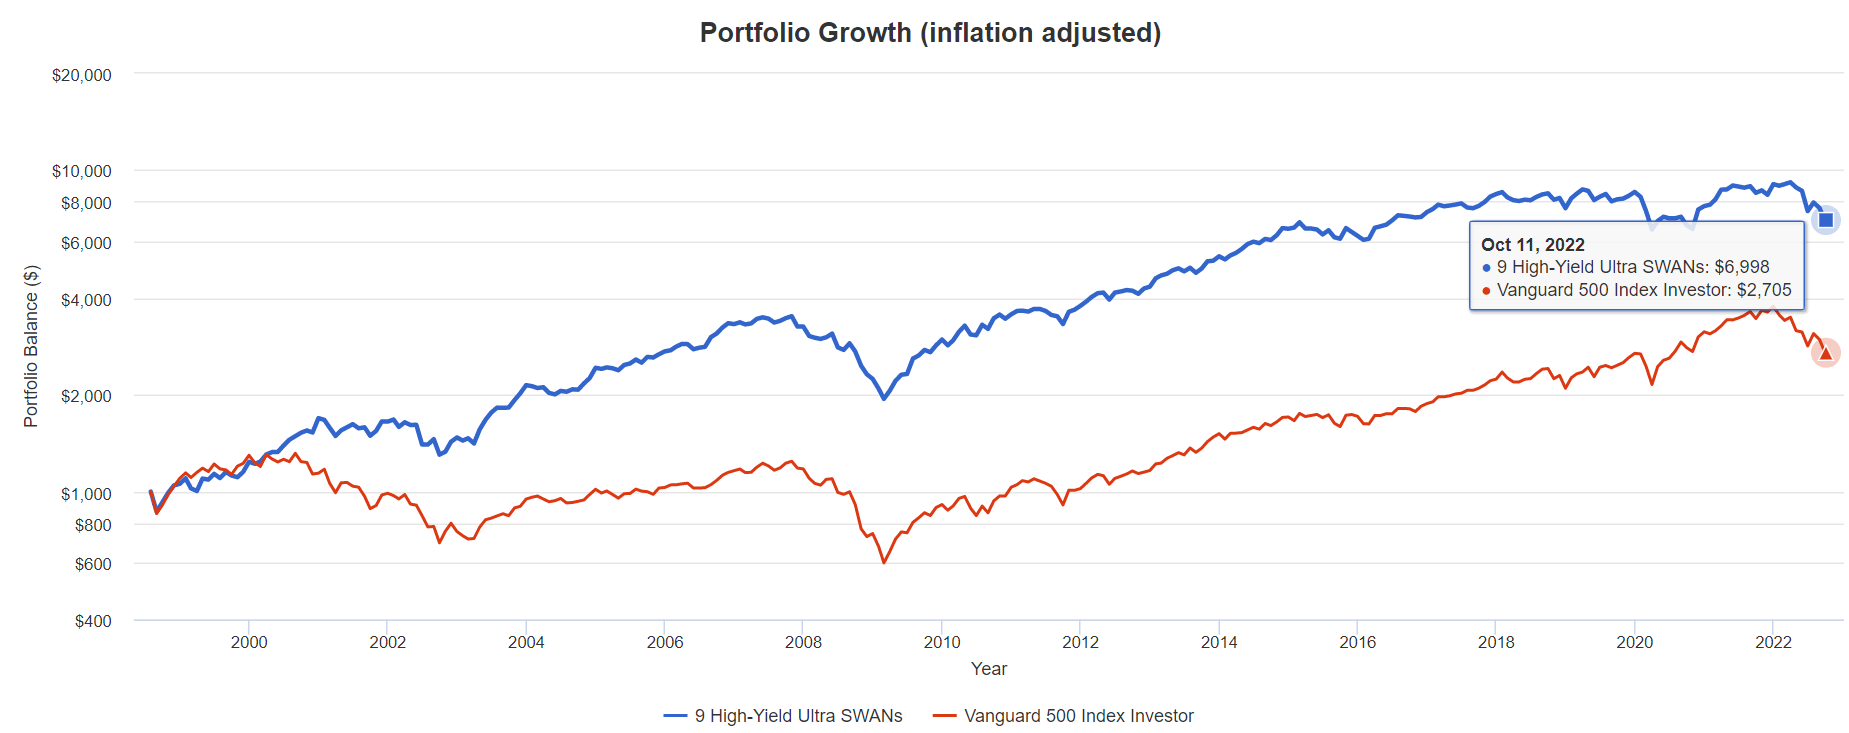
They delivered 7X inflation-adjusted returns, more than 2X better than the S&P 500.
(Source: Portfolio Visualizer Premium)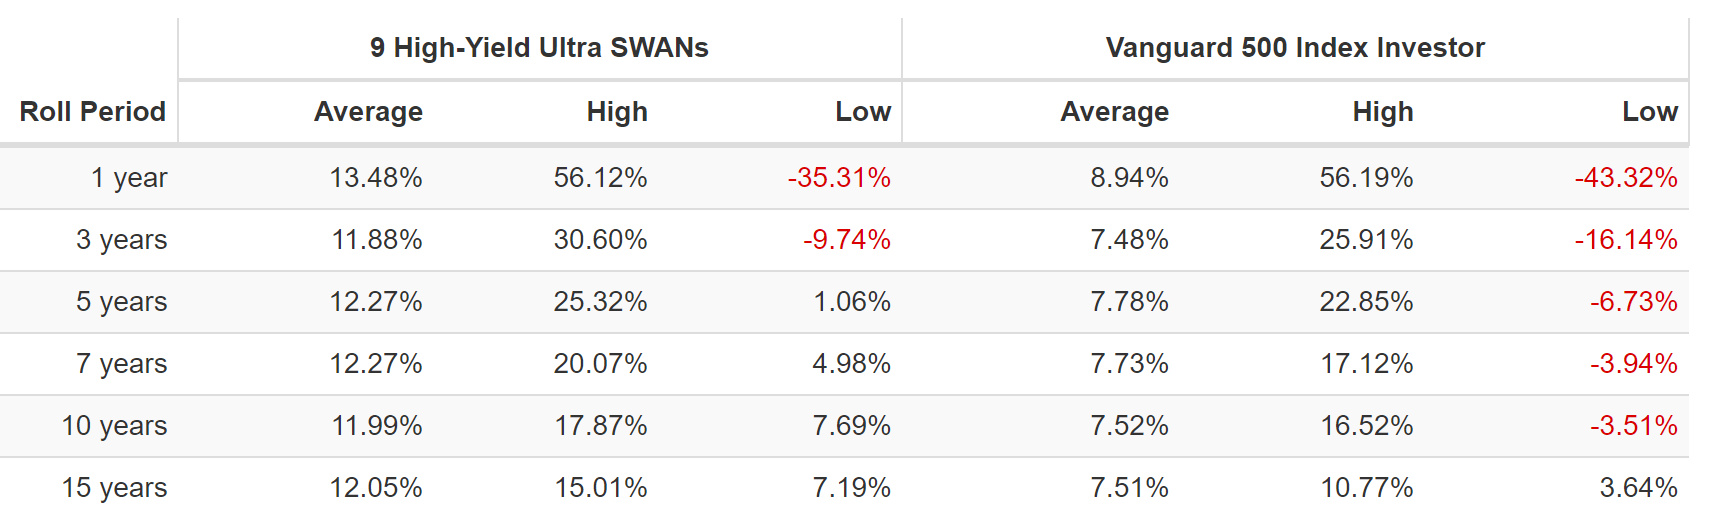
Outside of bear markets, they usually deliver 12% to 13.5% annual returns, just as analysts expect in the future.
How realistic is it for stable, mature blue-chip businesses that have delivered 13% annual returns for 24 years to keep doing so in the future? Analysts think they will, and based on the evidence and each company’s growth runway, I believe them.
Income You Can Trust In Even The Most Extreme Economic And Market Conditions
MO Spun-Off 3 companies in 2008 and 2009 ((Source: Portfolio Visualizer Premium))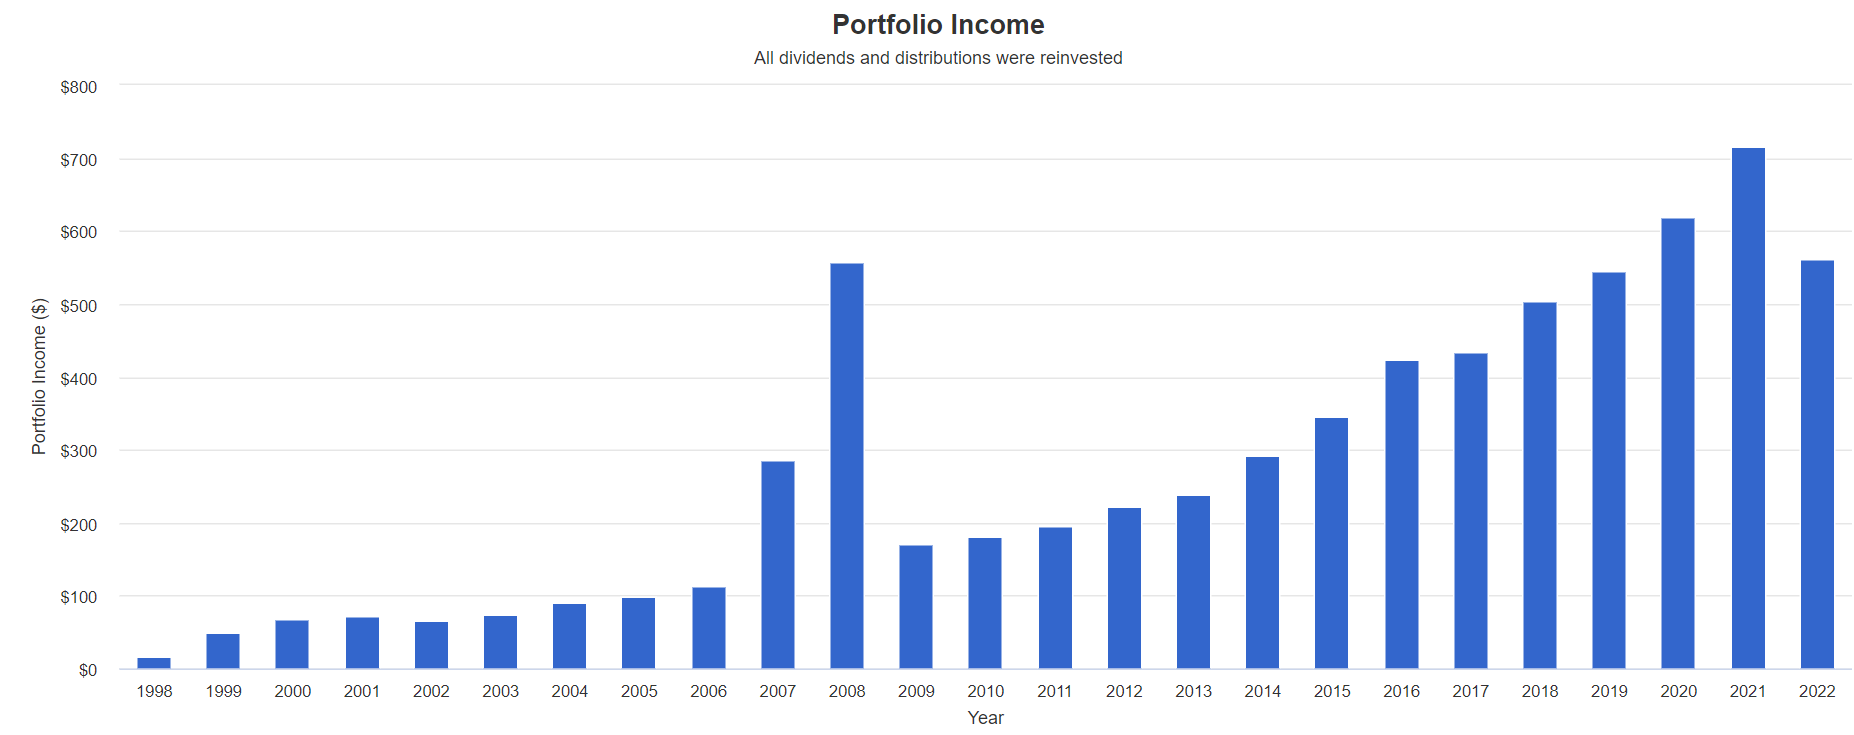
These Ultra SWANs have been delivering dependable, double-digit income growth for a quarter century through:
- four recessions
- three market crashes
- five bear markets
Cumulative Dividends Since 1999: $1,000 Initial Investment
| Metric | S&P 500 | 9 High-Yield Ultra SWANs |
| Total Dividends | $934 | $7,111 |
| Total Inflation-Adjusted Dividends | $518.89 | $3,950.56 |
| Annualized Income Growth Rate | 8.4% | 12.5% |
| Total Income/Initial Investment % | 0.93 | 7.11 |
| Inflation-Adjusted Income/Initial Investment % | 0.52 | 3.95 |
| More Inflation-Adjusted Income Than S&P | NA | 7.61 |
| Starting Yield | 1.3% | 5.0% |
| Today’s Annual Dividend Return On Your Starting Investment (Yield On Cost) | 8.3% | 74.8% |
| 2022 Inflation-Adjusted Annual Dividend Return On Your Starting Investment (Inflation-Adjusted Yield On Cost) | 4.6% | 41.6% |
(Source: Portfolio Visualizer Premium)
The S&P has delivered solid 8.4% annual income growth for the last 23 years, but these Ultra SWANs have grown their dividends by 50% faster, almost 13% annually.
They’ve repaid your original investment 4X over in inflation-adjusted dividends and paid 8X more income than the S&P 500.
Their 5% starting yield has grown into an inflation-adjusted 42% yield on cost.
- every $1 invested in 1998 is now paying $0.42 in inflation-adjusted dividends
- and that’s growing exponentially, doubling every 7 years (adjusted for inflation)
In 2030 the inflation-adjusted yield on cost is likely to be 83% and in 2037 166%, and 332% in 2044.
Behold the power of blue-chip dividend compounding!
Turning These 9 High-Yield Ultra SWANs Into A Zen Extraordinary Ultra SWAN (ZEUS) Retirement Portfolio
This portfolio is already complete from the perspective that it’s 11% invested into 9 of the world’s best companies, each representing a different sector.
But remember that sleep well at night quality has nothing to do with volatility; it’s a measure of quality and safety.
(Source: Portfolio Visualizer Premium)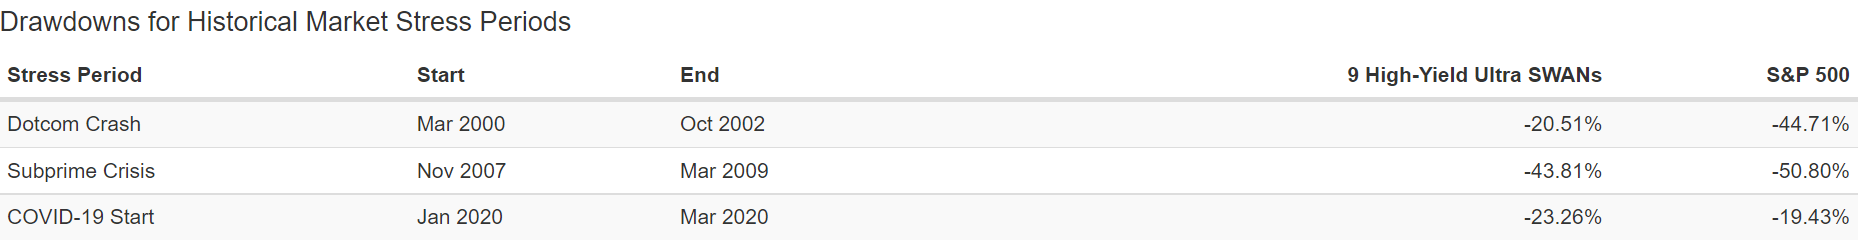
While these Ultra SWANs tend to fall less than the market during crashes, their volatility is still higher than many investors might be comfortable with.
(Source: Portfolio Visualizer Premium)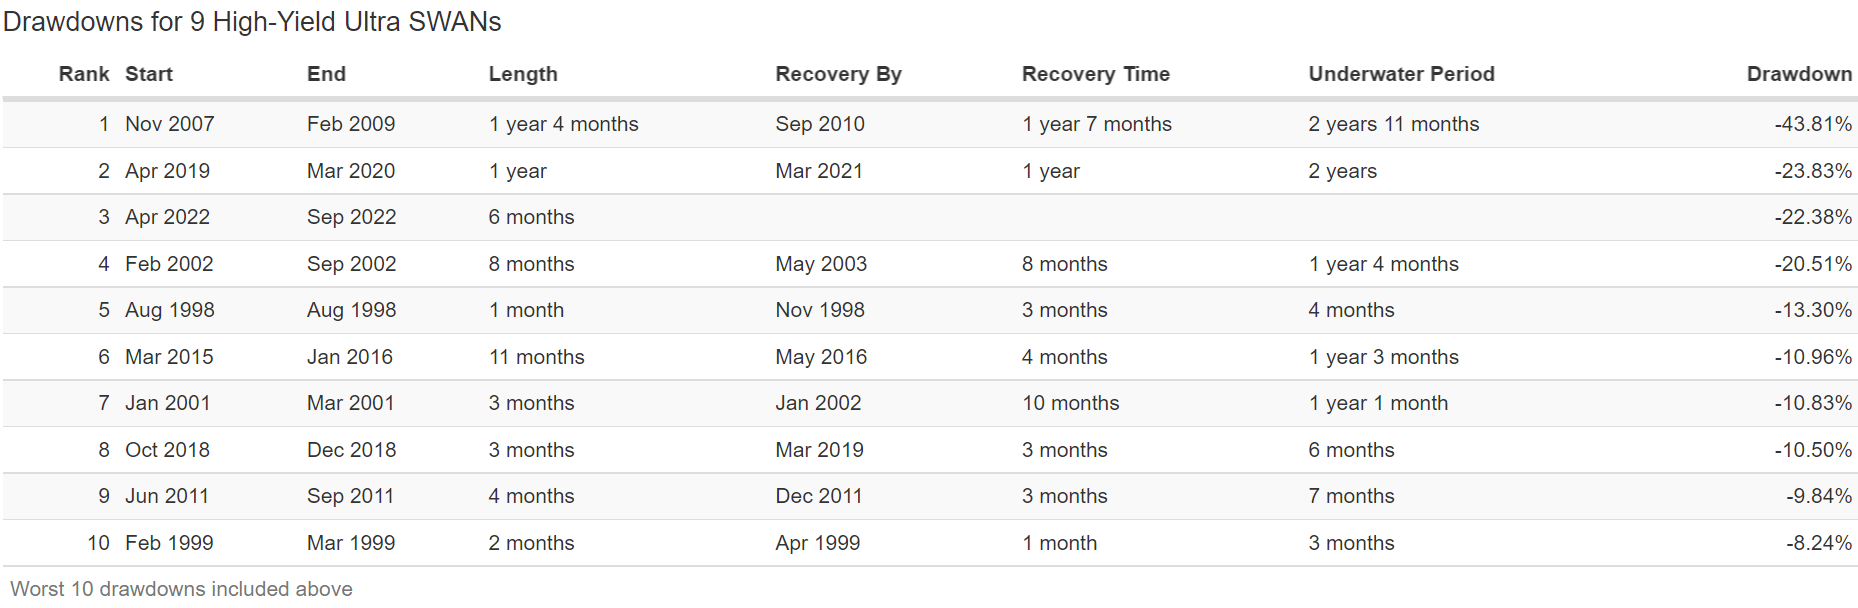
They are down a peak of 22% so far in this bear market, while the S&P is down 26%.
But those overall declines include some truly gutwrenching monthly declines.
(Source: Portfolio Visualizer Premium)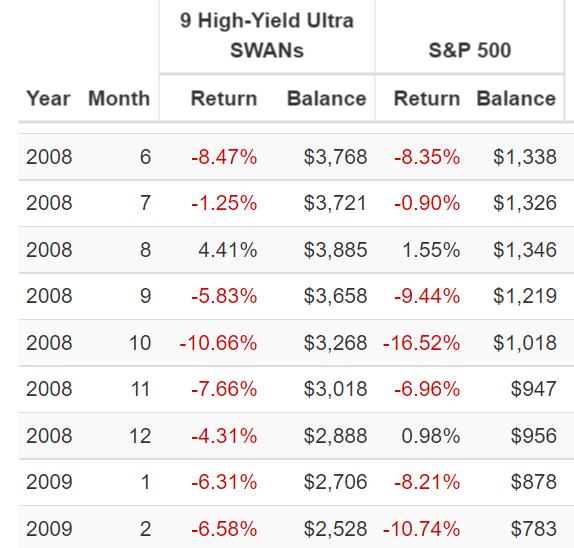
The dividends were safe and growing, but that didn’t stop these Ultra SWANs from falling off a cliff during the Great Recession.
So here’s a way to enjoy generous safe yield, Ultra SWAN quality, and strong returns in a recession-optimized ZEUS portfolio.
- 33% SCHD or VYM (gold-standard high-yield blue-chip ETFs)
- 16.7% EDV or TLT (long-duration US treasuries)
- 16.7% DBMF, PQTAX, or AMFAX (managed futures = hedge funds)
- 33% these Ultra SWANs (3.7% each)
ZEUS High-Yield Ultra SWAN Fundamentals
| Metric | 60/40 | ZEUS High-Yield Ultra SWAN | X Better Than 60/40 |
| Yield | 2.3% | 5.5% | 2.36 |
| Growth Consensus | 5.1% | 5.2% | 1.02 |
| LT Consensus Total Return Potential | 7.4% | 10.7% | 1.44 |
| Risk-Adjusted Expected Return | 5.2% | 7.5% | 1.44 |
| Safe Withdrawal Rate (Risk And Inflation-Adjusted Expected Returns) | 2.9% | 5.2% | 1.79 |
| Conservative Time To Double (Years) | 24.7 | 13.8 | 1.79 |
(Source: DK Research Terminal, FactSet)
ZEUS High-Yield Ultra SWAN offers a safe 5.5% yield and long-term returns that should not just crush a 60/40 but even outperform the market over the long-term.
It has 44% higher expected returns and almost 2X the safe withdrawal rate.
Inflation-Adjusted Consensus Total Return Potential: $510K Initial Investment (Average Retired Couple’s Savings At Retirement)
| Time Frame (Years) | 5.2% CAGR Inflation-Adjusted 60/40 | 8.5% Inflation-Adjusted ZEUS High-Yield Ultra SWAN Consensus | Difference Between Fortress 10 Consensus and 60/40 Consensus |
| 5 | $656,501.93 | $766,158.38 | $109,656.45 |
| 10 | $845,087.82 | $1,150,977.78 | $305,889.97 |
| 15 | $1,087,846.64 | $1,729,080.94 | $641,234.31 |
| 20 | $1,400,340.04 | $2,597,548.75 | $1,197,208.71 |
| 25 | $1,802,599.88 | $3,902,223.04 | $2,099,623.16 |
| 30 | $2,320,412.36 | $5,862,197.85 | $3,541,785.49 |
| 35 | $2,986,970.98 | $8,806,611.83 | $5,819,640.85 |
| 40 | $3,845,004.35 | $13,229,920.58 | $9,384,916.23 |
| 45 | $4,949,515.26 | $19,874,930.54 | $14,925,415.28 |
| 50 | $6,371,306.53 | $29,857,538.59 | $23,486,232.06 |
| 55 | $8,201,519.70 | $44,854,124.57 | $36,652,604.87 |
| 60 | $10,557,477.51 | $67,383,065.93 | $56,825,588.42 |
| 100 | $79,595,190.01 | $1,747,985,510.75 | $1,668,390,320.74 |
(Source: DK Research Terminal, FactSet)
This ZEUS High-Yield Ultra SWAN Portfolio has the potential to deliver an extra $3.5 million in inflation-adjusted wealth over a 30-year retirement.
| Time Frame (Years) |
Ratio ZEUS High-Yield Ultra SWAN Consensus Vs. 60/40 Consensus |
| 5 | 1.17 |
| 10 | 1.36 |
| 15 | 1.59 |
| 20 | 1.85 |
| 25 | 2.16 |
| 30 | 2.53 |
| 35 | 2.95 |
| 40 | 3.44 |
| 45 | 4.02 |
| 50 | 4.69 |
| 55 | 5.47 |
| 60 | 6.38 |
| 100 | 21.96 |
(Source: DK Research Terminal, FactSet)
That’s 2.5X more than a 60/40, which yields just 2.3% compared to ZEUS’s 5.5%.
Historical Returns Since June 2019 (SCHD, DBMF, EDV, And 9 High-Yield Ultra SWANs)
(Source: Portfolio Visualizer Premium)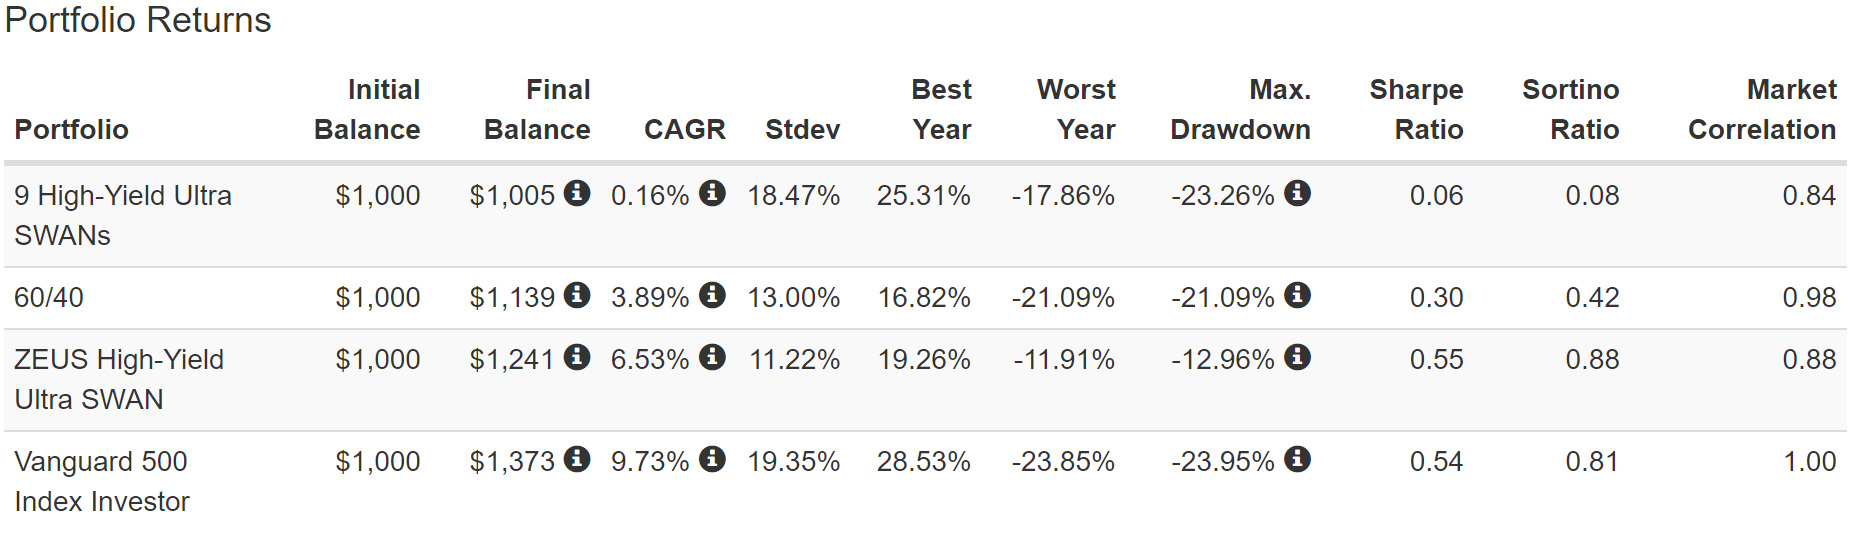
This is the combo of blue-chip assets that I would personally use if I were investing my savings into this ZEUS High-Yield Ultra SWAN portfolio.
- the gold standard of everything
- SCHD is the best high-yield ETF
- DBMF is the best hedge fund
- EDV is the best long-duration US treasury ETF
Thanks to the bear market that has made these Ultra SWANs such incredible bargains, they have been flat for the last few years. That would be frustrating for anyone who was only invested in the 9 Ultra SWANs, BUT if you were diversified into other blue-chip assets?
Then you doubled the returns of a 60/40 while experiencing 2% less annual volatility and a peak decline of just 13%.
In fact, the negative-volatility-adjusted returns (Sortino ratio) is not just 2X higher than a 60/40 but higher than the S&P 500.
(Source: Portfolio Visualizer Premium)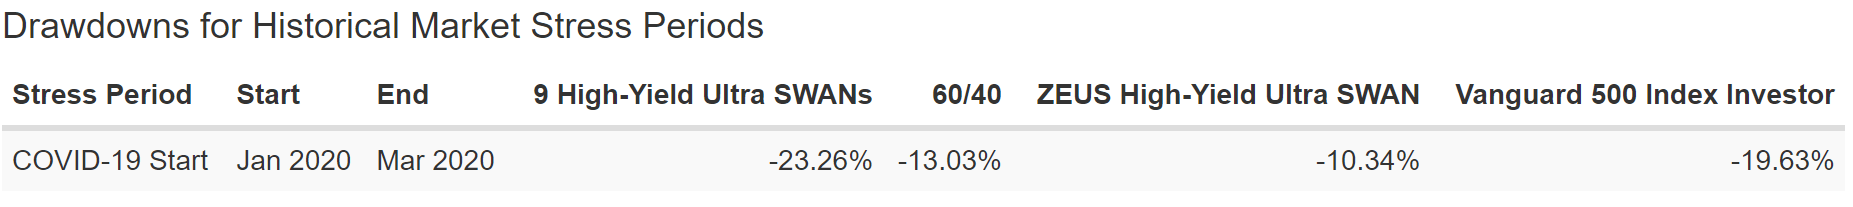
Half the decline of the S&P in the Pandemic crash, and a 30% smaller decline than a 60/40.
(Source: Portfolio Visualizer Premium)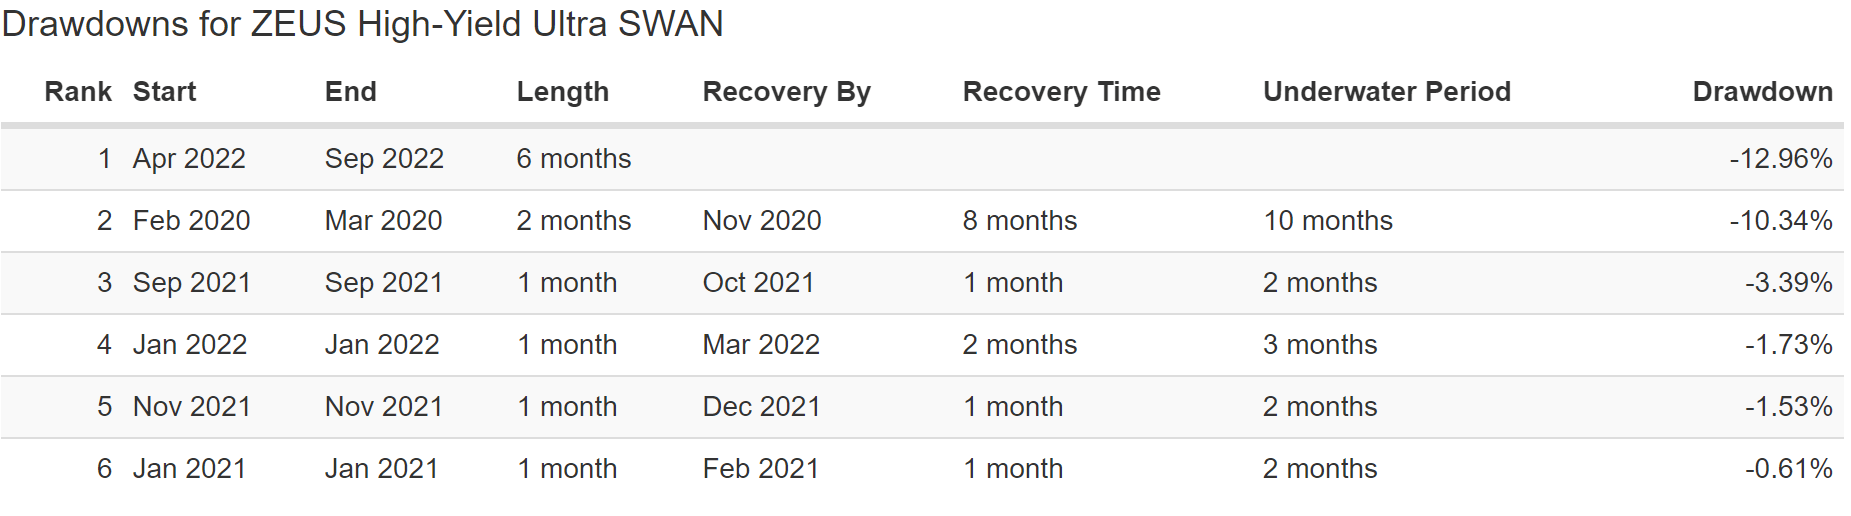
In this bear market, ZEUS is down 13% at its peak:
- Nasdaq -33%
- S&P -26%
- 60/40 -21%
ZEUS fell 50% as much as the market in the Pandemic, 50% less in the 2022 bear market, and also about 50% less during the worst monthly crashes of this year.
(Source: Portfolio Visualizer Premium)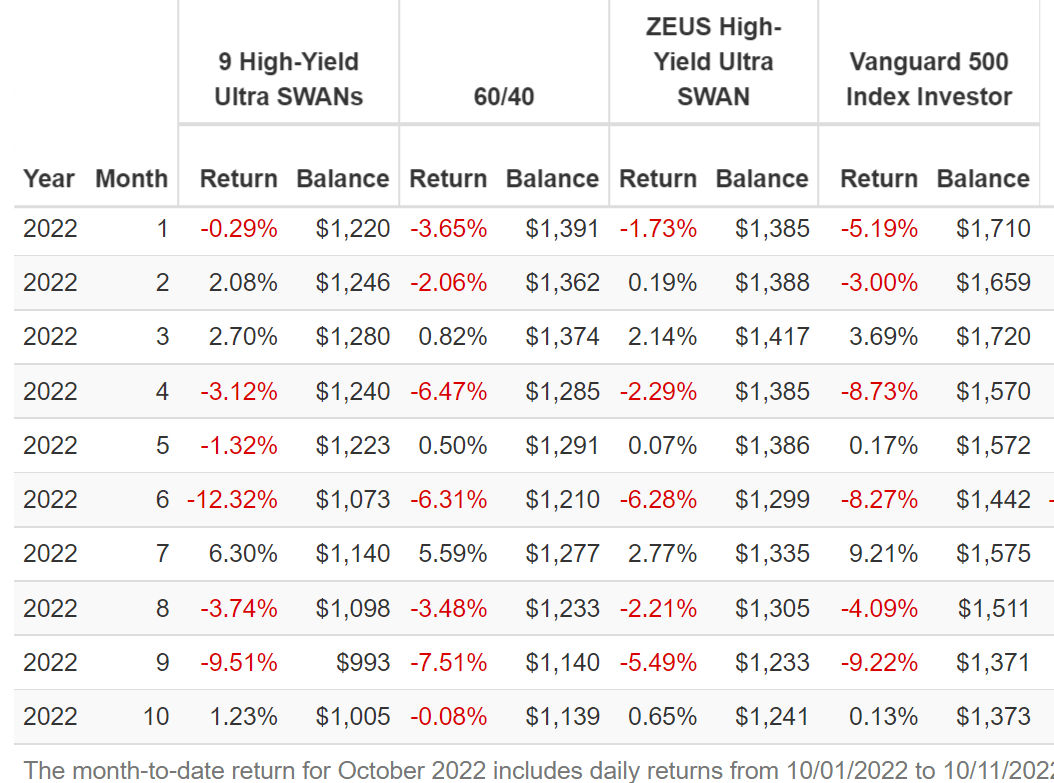
How does a 2% decline when the market crashed by 9% in April sound? Like the king of sleep well at night portfolios. That’s the power of ZEUS.
Historical Returns Since January 2014 (SCHD, PQTAX, EDV, And 9 High-Yield Ultra SWANs)
(Source: Portfolio Visualizer Premium)
2X the 60/40’s returns just as it was designed to do. But with 9% annual volatility, about 10% less than a 60/40.
And a peak decline of 14%, 1/3rd less than a 60/40, and nearly 50% less than the S&P 500.
A negative-volatility-adjusted total return that’s 2.5X better than a 60/40 and 30% better than the S&P 500, and 2X better than the Ultra SWANs alone.
(Source: Portfolio Visualizer Premium)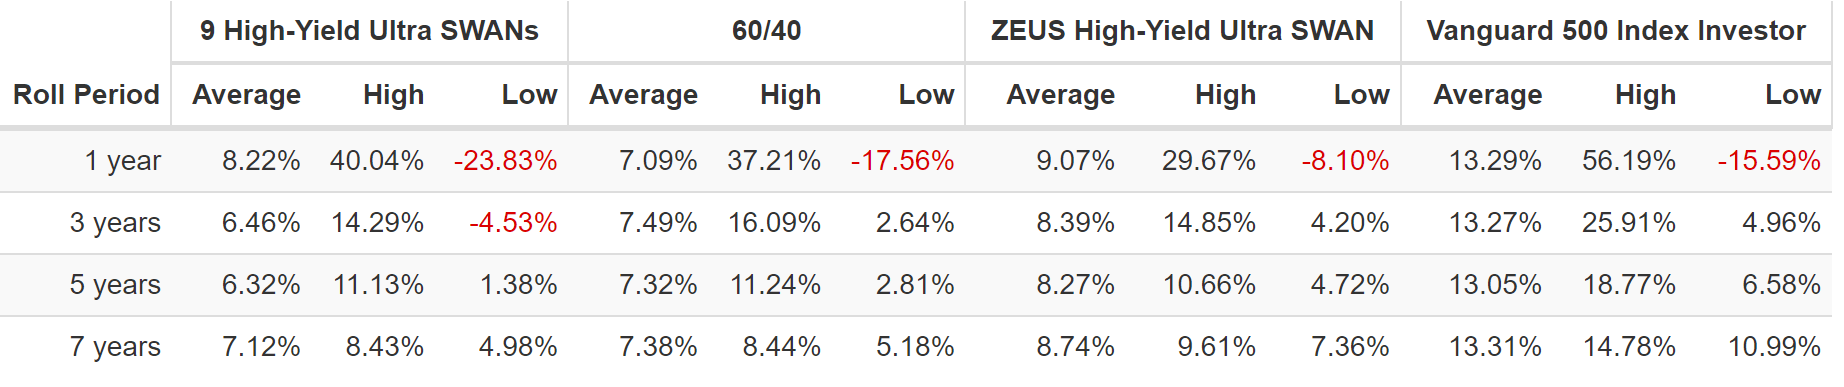
Very consistent returns of 8% to 9% CAGR over the last eight years.
(Source: Portfolio Visualizer Premium)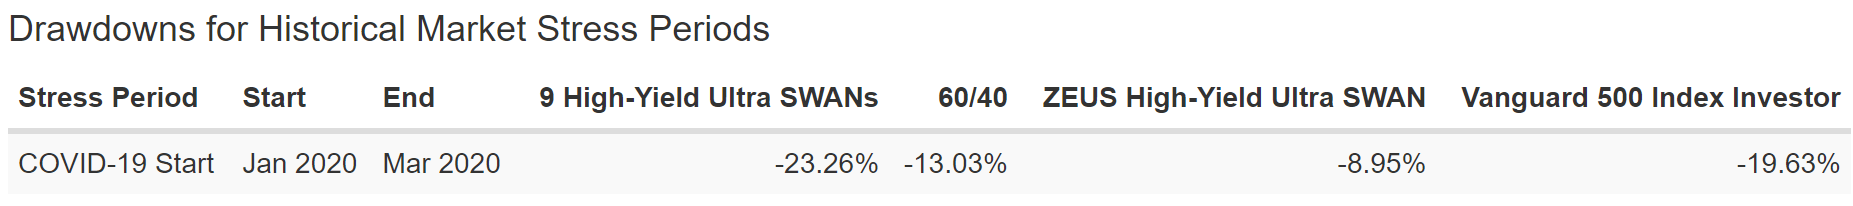
Again, half the peak decline of the market in the Pandemic, and 33% less than a 60/40.
(Source: Portfolio Visualizer Premium)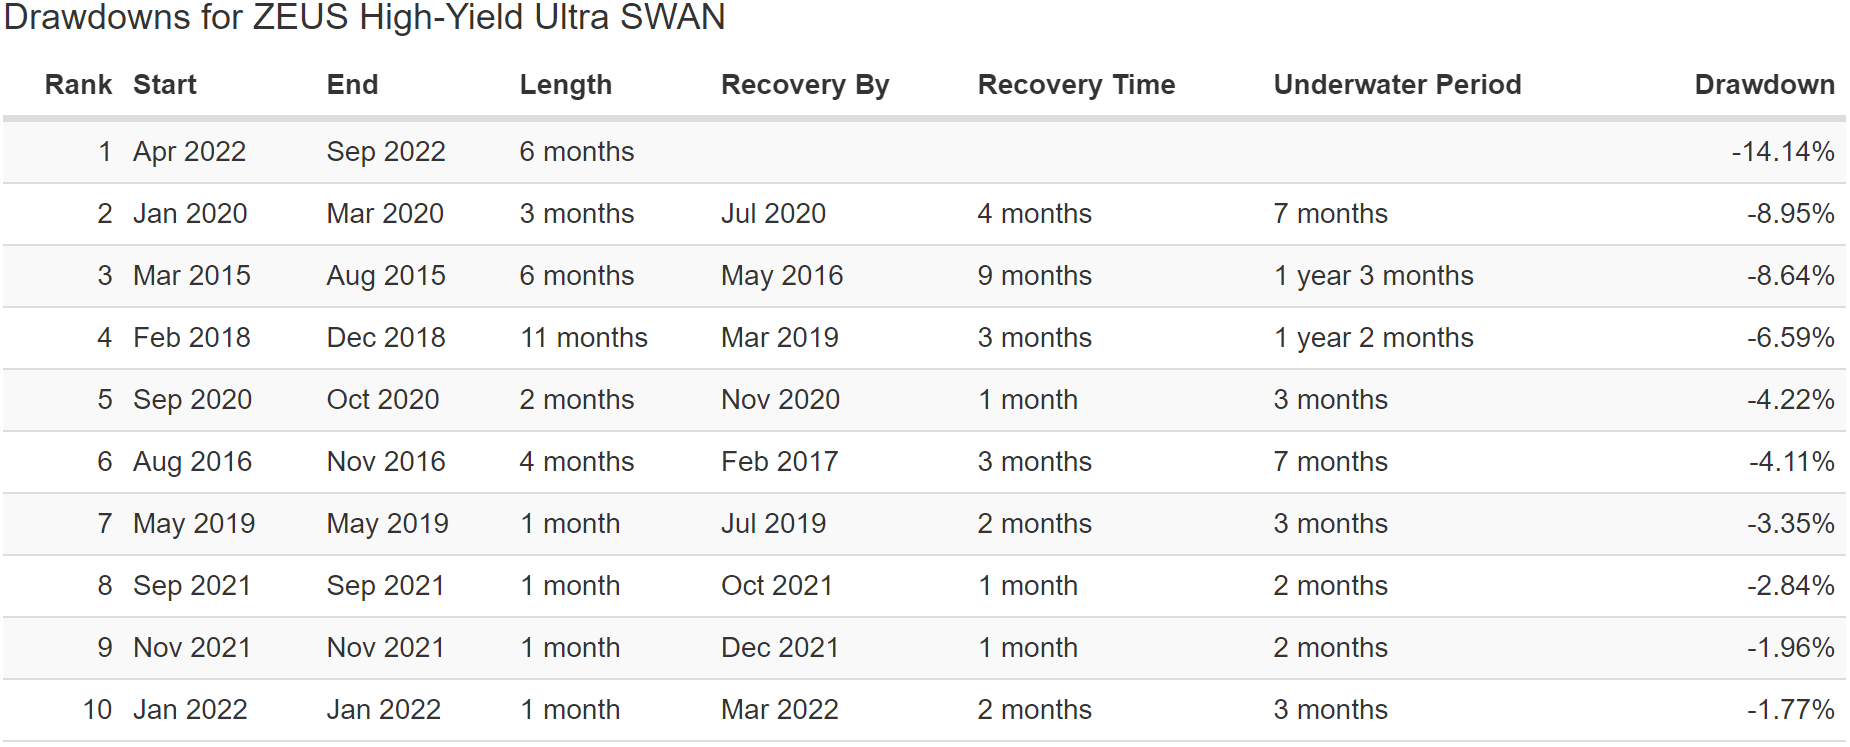
In eight years, across two recessions, one market crash, and three bear markets, ZEUS has experienced a single correction and no bear markets.
The S&P? 3 bear markets and three corrections.
ZEUS In The 2018 Bear Market
(Source: Portfolio Visualizer Premium)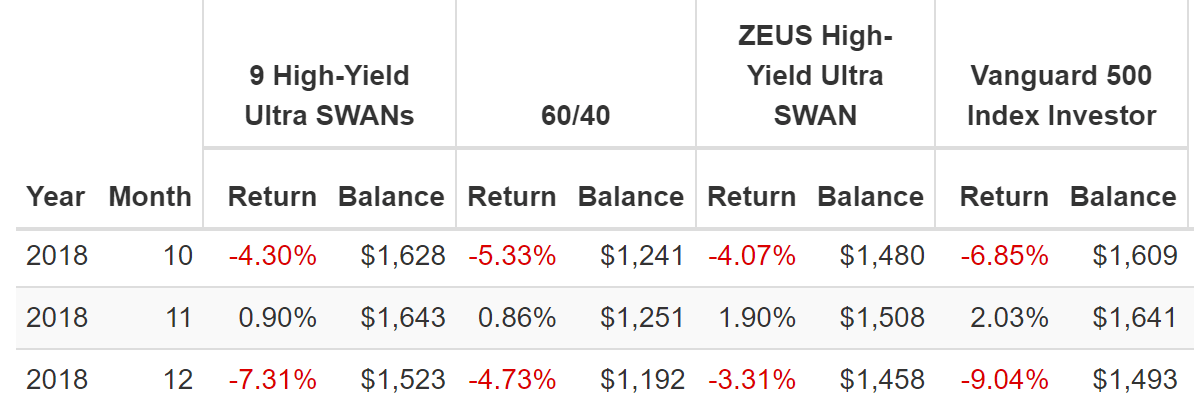
During the 2018 bear market, when the S&P hit an intra-day low of -21% on December 24th, ZEUS fell just 6.6%, 1/3rd as much.
That includes a 3% decline in December, also 1/3rd of the market’s decline.
Historical Returns Since August 2010 (VYM, AMFAX, EDV, And 9 High-Yield Ultra SWANs)
(Source: Portfolio Visualizer Premium)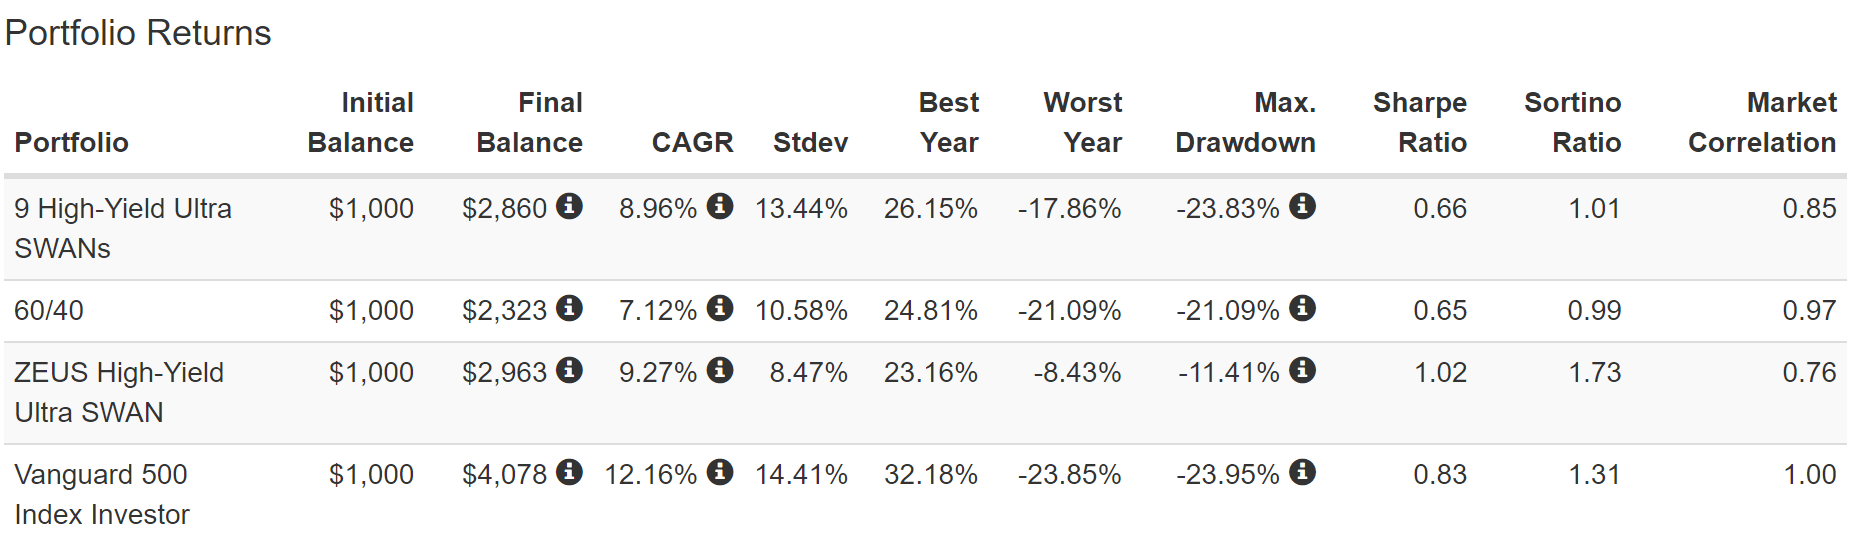
Now we have 12 years of data showing 60/40 crushing returns with even lower volatility of just 8.5% per year. Again, half the peak decline of the S&P, thanks to the bonds and managed futures.
Once again, the negative-volatility-adjusted returns are superior to a 60/40, the Ultra SWANs alone, and even the red-hot S&P during one of the strongest rallies in US market history.
(Source: Portfolio Visualizer Premium)
Returns that are consistently better than a 60/40 and silky smooth.
(Source: Portfolio Visualizer Premium)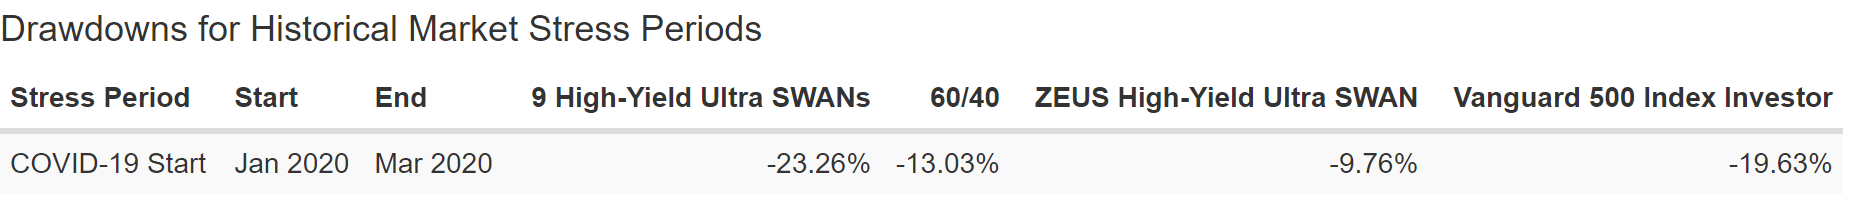
Notice how even with SCHD replaced with VYM and DBMF replaced with AMFAX, the total returns and peak declines are very similar.
Yet again, 50% of the market’s peak decline and 33% less than a 60/40.
- 90% of returns and volatility are a function of asset class, not individual stocks
- get your asset allocation right, and you’ve won the game
(Source: Portfolio Visualizer Premium)
The market is down as much as 26% this year, and this version of ZEUS just 11%.
- a 58% smaller decline
- one correction in 12 years vs. four for the S&P 500
ZEUS In The 2011 Bear Market
(Source: Portfolio Visualizer Premium)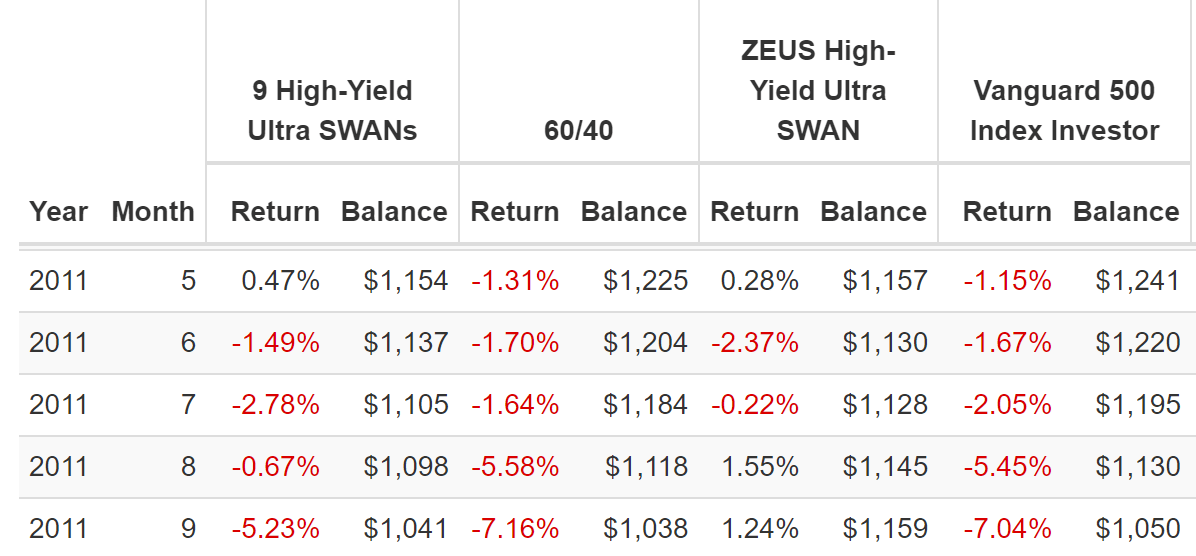
During the 2011 bear market, when the S&P hit -21% intra-day, ZEUS fell just 2.6% and even went up 3% during the final two months.
- Rising 3% while the market falls 11% = riding over a market pothole on a hovercraft
Behold the power of diversification and non-correlated hedging assets. Behold the power of ZEUS.
Historical Returns Since March 2007 (VYM, RYMTX, TLT, And 9 High-Yield Ultra SWANs)
(Source: Portfolio Visualizer Premium)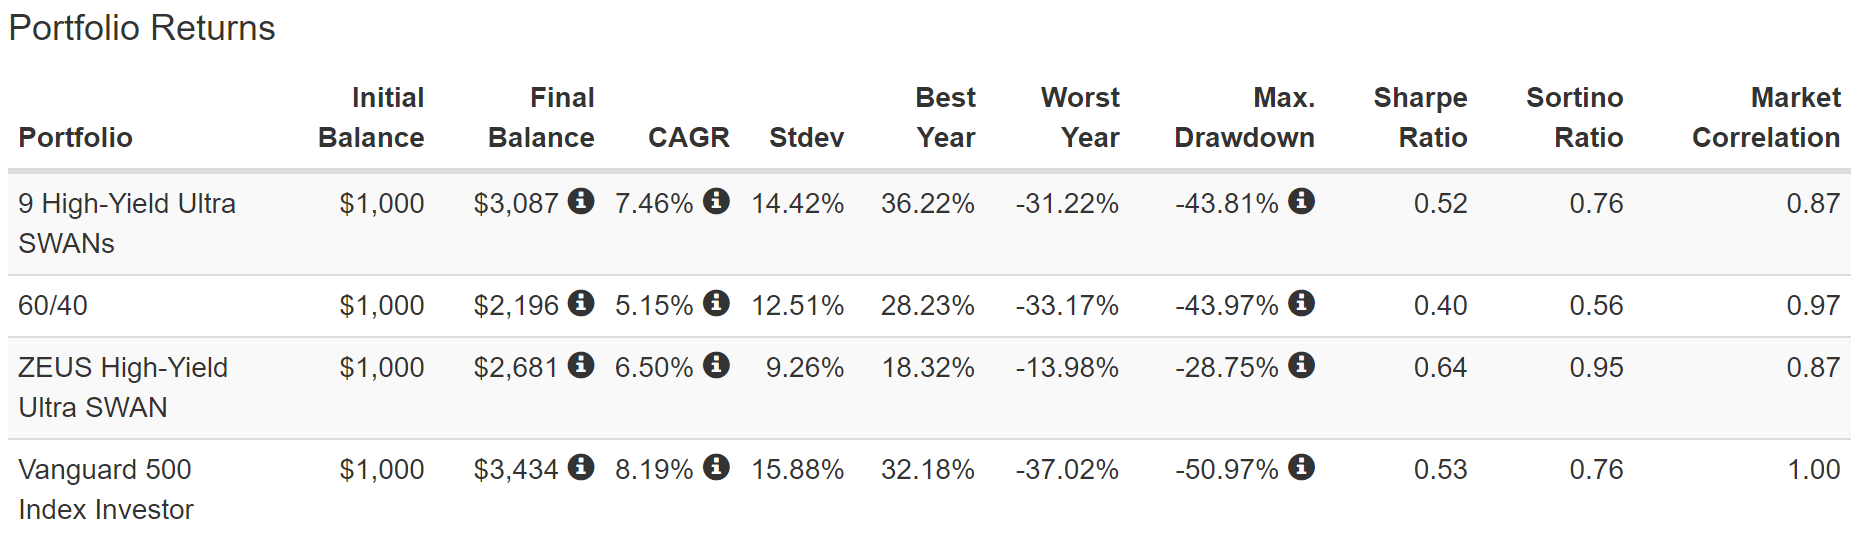
RYMTX is a 2-star rated managed futures fund that I think NO ONE SHOULD EVER BUY. RYMTX is the oldest managed futures fund, and I am using it here to show the returns of the overall ZEUS strategy during the Great Recession.
- the 2nd biggest market crash in US history
- the ultimate trial-by-fire for any sleep-well-at-night portfolio
Superior returns to the 60/40, with 25% less annual volatility, just 9.3% per year. And a peak decline of 29% compared to a 44% crash in the 60/40 and the market getting cut in half.
- and that’s with a 2-star hedge fund instead of a 4 or 5-star funds like DBMF, PQTAX, and AMFAX, respectively.
(Source: Portfolio Visualizer Premium)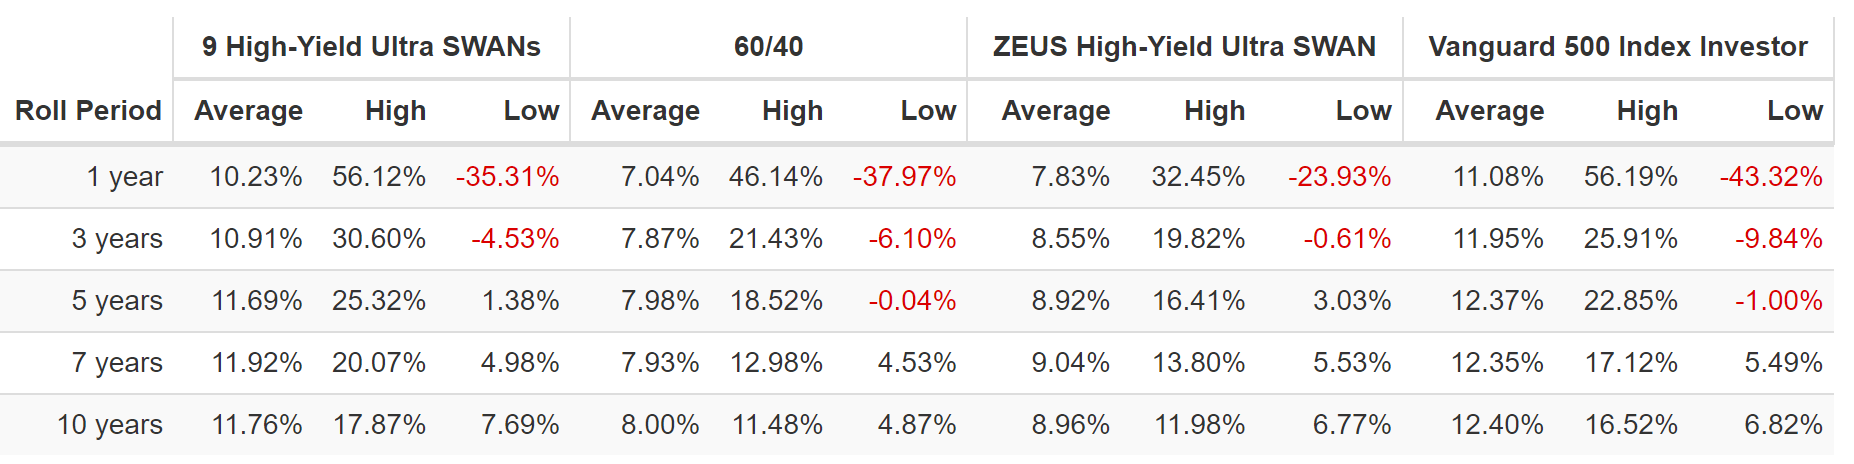
Silky smooth returns and never a five-year period of negative returns.
(Source: Portfolio Visualizer Premium)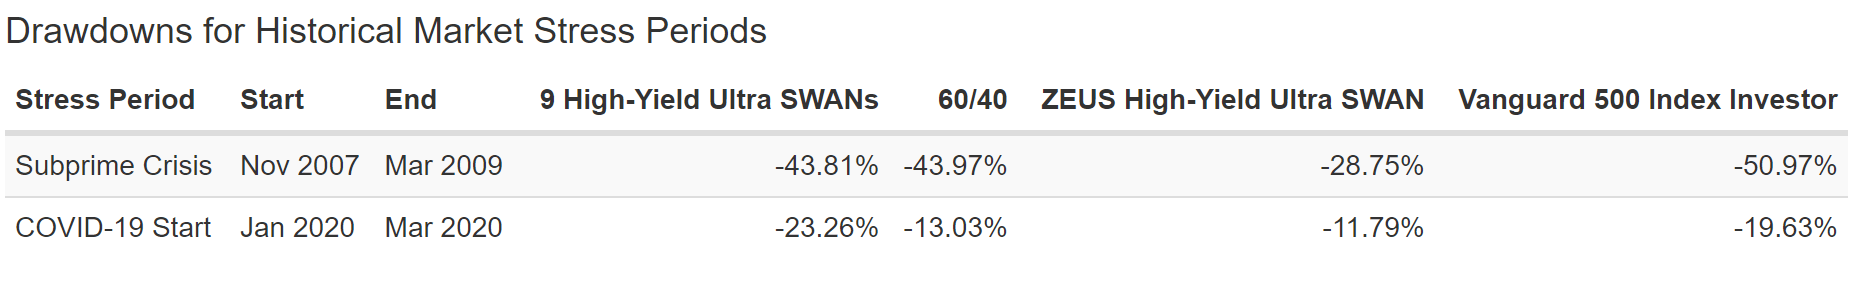
The S&P’s peak intra-day decline in the Great Recession was actually -56%.
- ZEUS fell 50% as much as the market during the Great Recession
- and the Pandemic
- and the 2022 bear market
- and the 2018 bear market
- 1/8th as much during the 2011 bear market
(Source: Portfolio Visualizer Premium)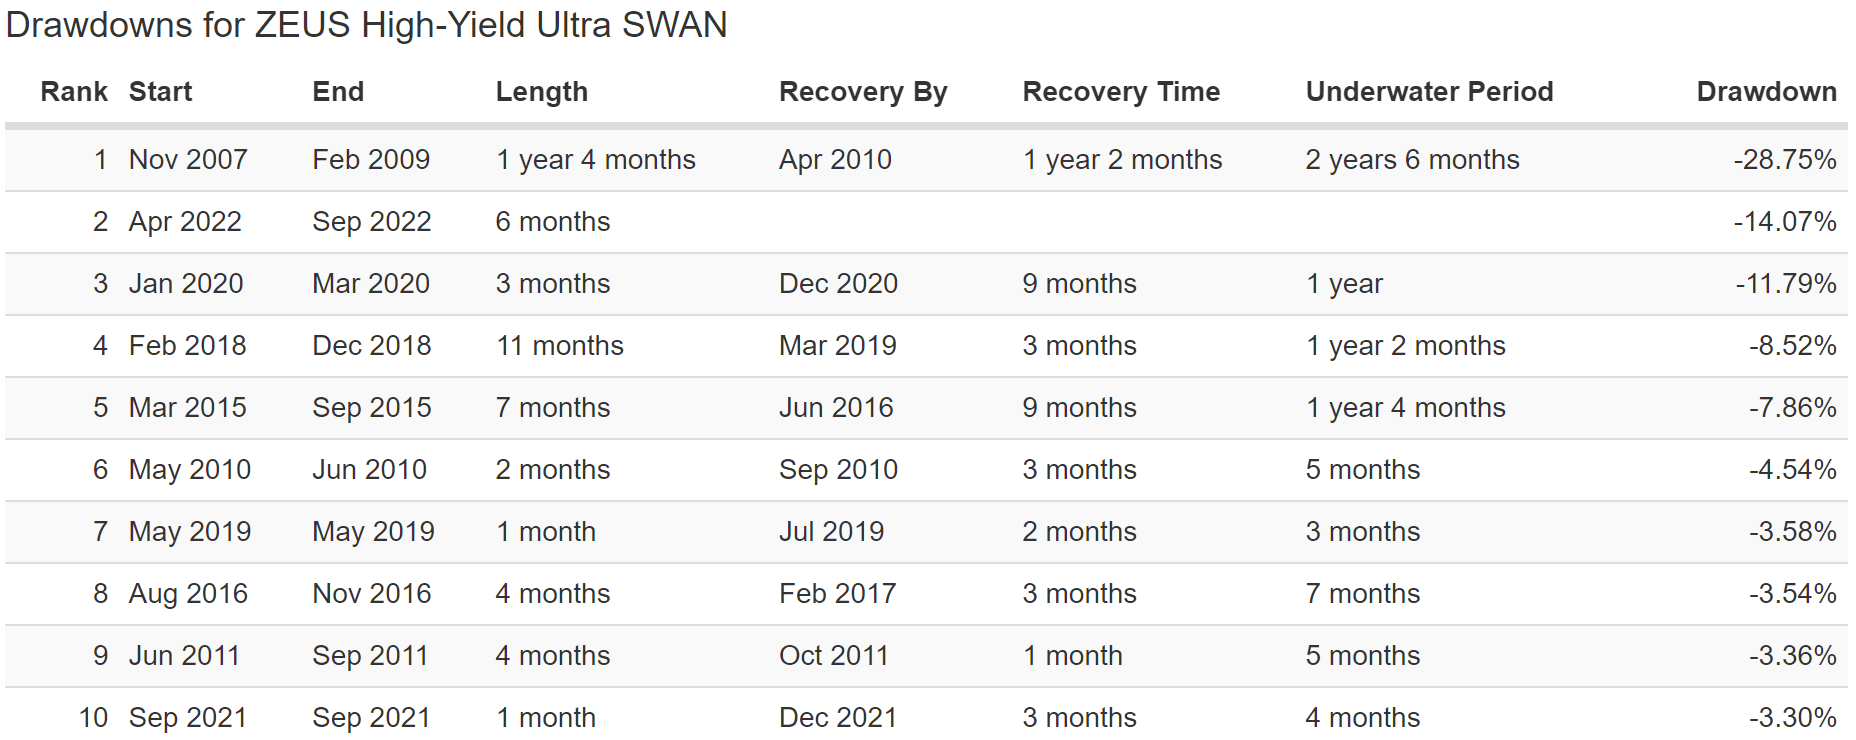
This is the power of a prudently hedged and diversified blue-chip portfolio. This is the power of ZEUS. And so is this.
ZEUS In The Great Recession Crash
(Source: Portfolio Visualizer Premium)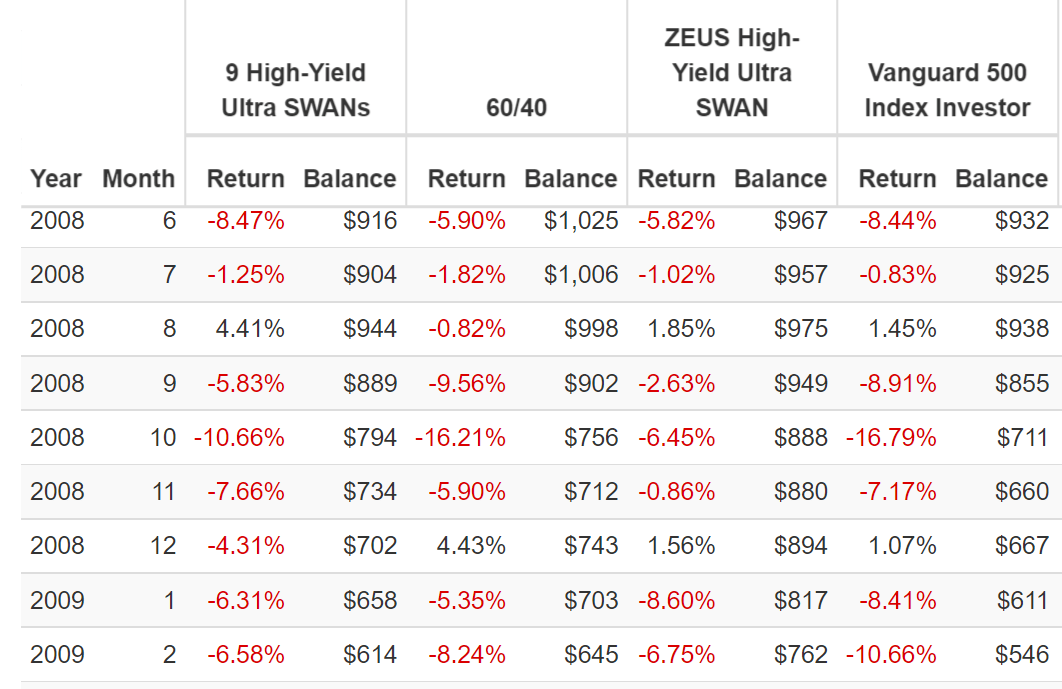
In October 2008, the market fell 17%, and so did a 60/40. There was nowhere to hide… except ZEUS, which fell 66% less than the market, just 6.5%.
You can never eliminate volatility, but you can manage it while still enjoying strong returns… and a safe 5.5% yield that blows away a 60/40 and every other high-yield blue-chip mutual fund or ETF.
Bottom Line: These Are The 9 Best High-Yield Blue-Chips All Retirees Should Consider Owning
Bear markets can be terrifying, especially during the 8% of times when bonds don’t hedge stocks, as we’re experiencing in 2022.
But during turbulent times like these, especially when facing a recession in 2023 that 80% of CEOs expect, safety and quality are more important than ever.
And very safe high-yield is one of the best ways to sleep well at night in crashing markets and shrinking economies. When you don’t have to sell any shares, even the most ferocious drawdowns won’t hurt your standard of living.
And that’s where these 9 high-yield Ultra SWANs can be your port in the storm.
Today MO, EPD, KRC, BNS, MMM, TU, SNY, BEPC, and CSCO represent nine high-yield Ultra SWANs in nine sectors that you can depend on for whatever is coming next.
- 5.8% very safe yield
- average A- stable credit rating
- 23-year dividend growth streak (since 1999)
- 7% long-term growth consensus
- 12.8% CAGR long-term return (just as they’ve delivered for 24 years)
Add the world’s best blue-chip high-yield, bond, and managed future ETFs, and you can create a Zen Extraordinary Ultra SWAN portfolio that falls 33% to 66% less than the market during even the most extreme market panics and crashes.
- and that still yields a safe 5.5%
- more than 2X more than a 60/40
- and 3X more than the S&P 500
Ultra SWAN portfolios like this are how you stay sane in a bear market.
Ultra SWAN portfolios like this are how you keep your money safe in recessions.
Ultra SWAN portfolios like this are how you make your own luck on Wall Street and retire in safety and splendor.
Be the first to comment