

PonyWang/E+ via Getty Images
Investment Thesis
Texas Instruments (NASDAQ:TXN) is a well-run company with a strong competitive advantage and industry tailwinds and should be able to achieve 10-15% total annual returns for investors over the next decade.
The company is the market leader in analog semiconductors and a market leader in the embedded semiconductor market. Both segments are overlooked with most eyes on digital chips and players like Intel (INTC), Nvidia (NVDA) and Taiwan Semiconductor Manufacturing Company (TSM). I believe Texas Instruments is a buy right now and here’s why it represents my second largest position (8% allocation) in my portfolio.
In the following article, I will mainly refer to Texas Instruments as TI.
An Overlooked Growth Market In A Digital world
“The world is going digital” is something we hear almost every day. So why invest in analog chips, when that clearly is going out of fashion? That’s where many people get the market wrong. Digital chips are highly complex Chips that are very efficient at processing data, but they cannot collect data. That is where analog and embedded processors take the stage. These chips have use cases like changes in power, chips that measure signal changes, sensors that convert real-life signals into digital signals like the temperature or basically every time a button is pushed. These processes can’t be digitalized away and the products have long lifespans. Furthermore, they often cost a fraction of the production cost of the good but are needed in large quantities. This is especially a large differentiator to digital chips like the newest Advanced Micro Devices (AMD) Ryzen CPUs or Nvidia GeForce GPU which cost hundreds if not thousands of dollars.
Most emerging technology trends require semiconductors and all of them need to collect data. A great example is the switch from Internal Combustion Engine (ICE) Vehicles to Electric Vehicles (EV). An EV requires around 5 times as many chips as an ICE. Due to the longevity of the products and their need in all products, there is no arms race to adhere to Moore’s Law like there is with Digital Chips. I recommend reading this article by semiconductor engineerings if you want to dive deeper into this comparison. The longevity of these chips results in a much smaller need for Capital expenditures to maintain and build new fabs. This can be seen if we compare CapEx spending for Digital chip manufacturers (Intel and TSMC) and analog chip manufacturers (Texas Instruments and Analog Devices) in the graphic below. This trend will continue. Even though TI announced an accelerated CapEx plan (expecting up to 20% of revenue this year), Capex as a percentage of revenue will not come close to the CapEx requirement in digital chip manufacturing (52% of revenue for TSMC).
Capex spending comparison (koyfin)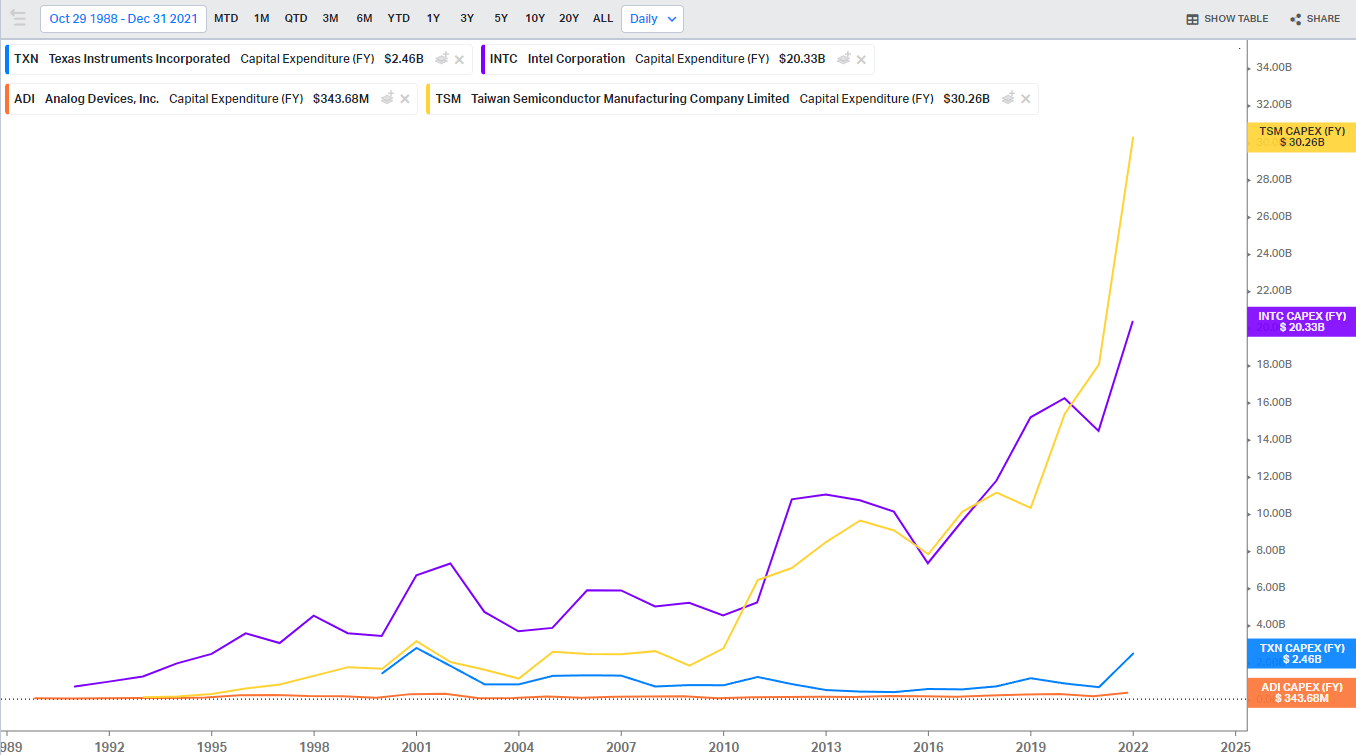
A Wide And Durable Moat
TIs strategy is simple, in the words of CEO Rich Templeton:
The best measure to judge a company’s performance over time is the growth of free cash flow per share, and we believe that’s what drives long-term value for our owners.
If you ever heard Rich Templeton speak then you’ll know that he loves to talk about Free cash flow per share, but most importantly, the long-term growth of this metric. I believe that TI has several durable and widening competitive advantages:
- Cost advantage through vertical integration
- Large product portfolio
- Great capital allocation track record
Cost advantage through vertical integration
TI is one of the few companies building up production capacity, instead of outsourcing it to contract manufacturers like TSMC. They continue to increase their vertical integration of all processes to continuously reduce costs and increase margins. In the graphic below we can see that over the last two decades TI managed grow margins by multiples.
TI margin expansion (koyfin)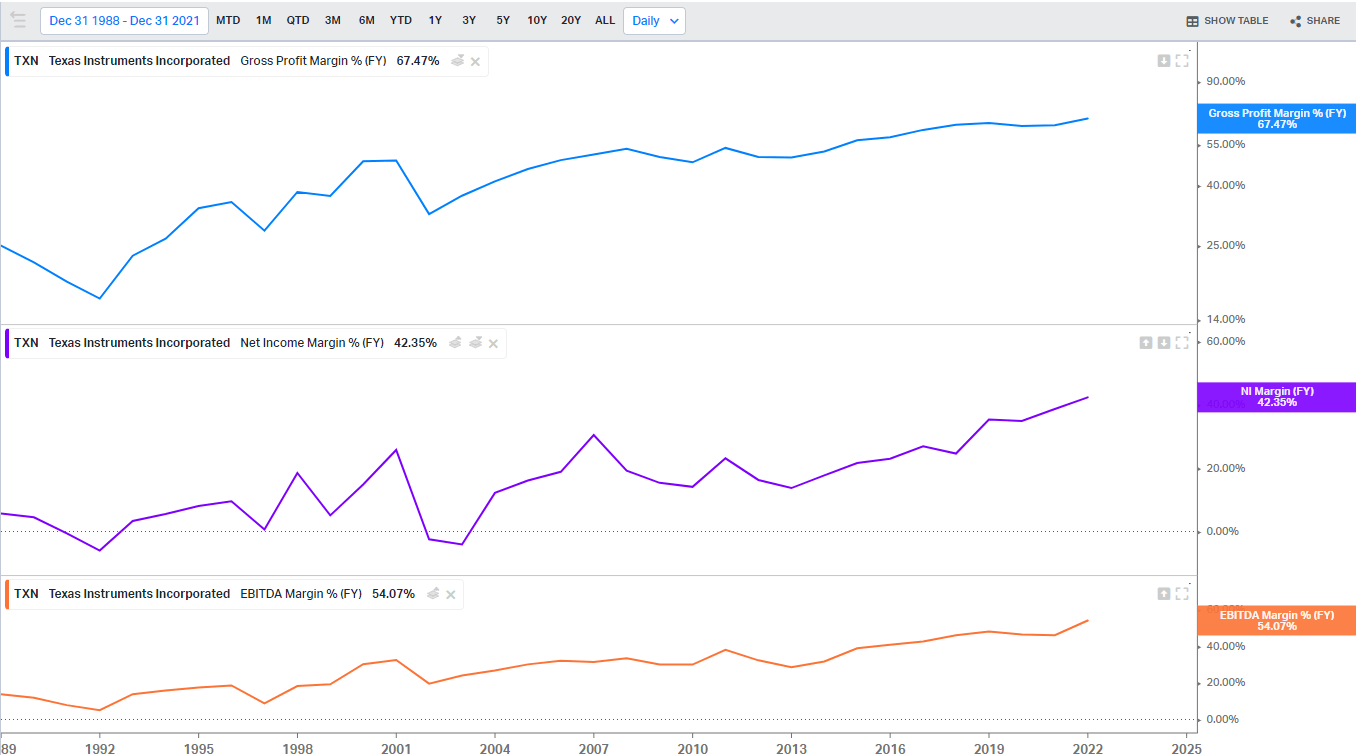
These impressive increases won’t stop going forward. TI has made investments in its own Direct to consumer (D2C) sales channel in recent years. This will lower lead times, which is a competitive advantage over competitors with longer lead times, and reduce costs, resulting in further margin increases. D2C climbed from 35% in 2019 to 64% of revenue in 2021 and will continue to rise with the adoption of the Ti.com sales channel, which already accounts for about 10% of revenue.
D2C as percentage of revenue (TI capital management presentation 22)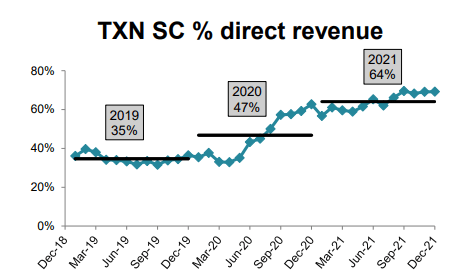
Investment in the future
TI recently started to enter a big investment cycle. In the graphic below we can see that they are massively ramping up Capital Expenditures. CapEx has been between 3-8% of revenues for TI in the last decade roughly, up until 2021 when it spiked to 13%. 2022-2025 will see an even bigger CapEx of ~15-20%, leveling out around 10% of revenues for the rest of the decade.
Capex expectation (TI capital management presentation 22)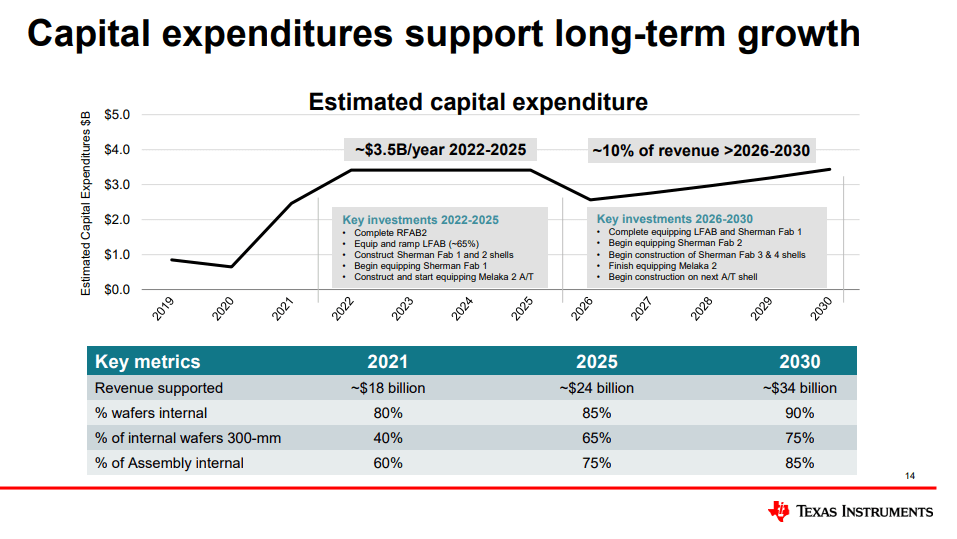
Earlier I said that the main focus of TI is free cash flow per share growth. Attentive readers will have noticed that these investments will decrease FCF/share in the short term because
Free Cash Flow = Operating Cash Flow – Capital Expenditures
An increase in Capital Expenditures thus results in a lower Free Cash Flow. Texas Instruments management thinks for the long term, the company’s motto is to run the company with the mindset of being a long-term owner. They are not looking to optimize FCF in the short term, but rather invest for the 2025 FCF and onwards.
TI is building out two new 300-mm wafer fabs in the next 2 years and a gigantic 300-mm wafer fab with the capacity of four normal ones by 2025. Their focus on 300-mm production is a competitive advantage, because most of the competition is largely producing 200-mm wafers or outsourcing the production. The math is pretty simple, 300-mm wafers are much larger than 200-mm wafers and thus the yield is higher per wafer. TI expects this to increase gross margins in the future from the current 60% gross margins to 68% gross margins for the production. As you can see in the graphic I shared above, currently, around 80% of wafers are produced internally and only 40% of those are 300-mm. With the new fabs, TI expects this to increase to 90% internal and 75% 300-mm wafers. This added production will roughly double revenues for the company while further decreasing costs per wafer and increasing the already excellent profitability (42% net income margin last 12 trailing months).
Great Capital Allocators Strive In Difficult Environments
I like to invest in great capital allocators with a lot of discipline. TI undoubtedly is just that. The company managed to generate increasing returns on assets, capital and equity over the years from an already high base. I am sure that over the next decade this trend won’t reverse. The company intelligently allocates resources to high-yielding projects and investments at an accelerating pace. The company has a strict capital allocation strategy and a capital allocation scorecard, where they grade their performance every year. A long track record of high discipline.
TI Return metrics (koyfin)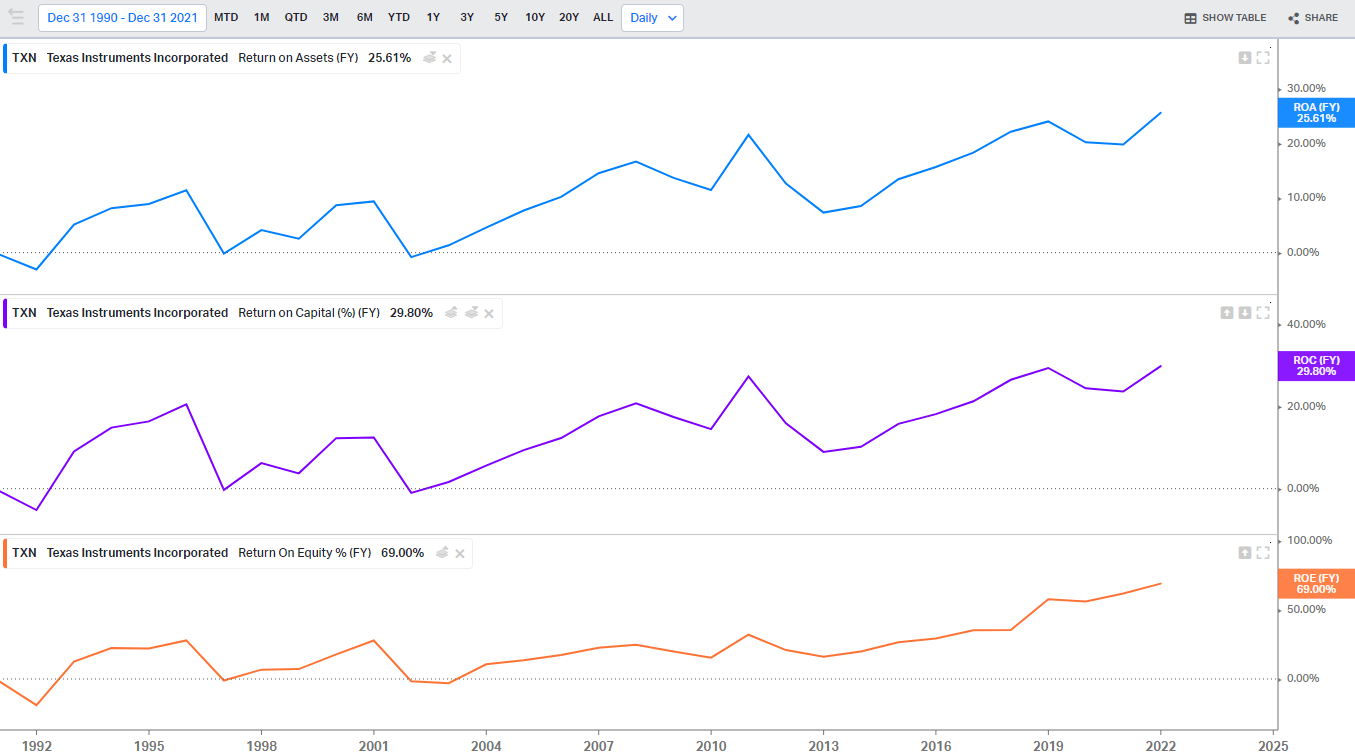
What if the semiconductor cycle is at its peak?
People often talk about the cyclicality of semiconductors. For example, investment firm Truist recently slashed price targets across the board for the semiconductor industry, on concerns of slowing demand. Even in the case of a cycle peak, great capital allocators thrive in these times of distress. In the graphic below we can see TI’s buyback history. Amid the financial crisis of 2008, where most companies tried to stay afloat, a well-managed company like TI pounced on the opportunity. They bought back 17% of the company just in 2008 and acquired a handful of distressed companies for pennies on the dollar from 2008 to 2011. A great capital allocator comes out of any big crisis much stronger than before. This makes me confident that TI will be able to operate in any environment.
TI buyback history (koyfin)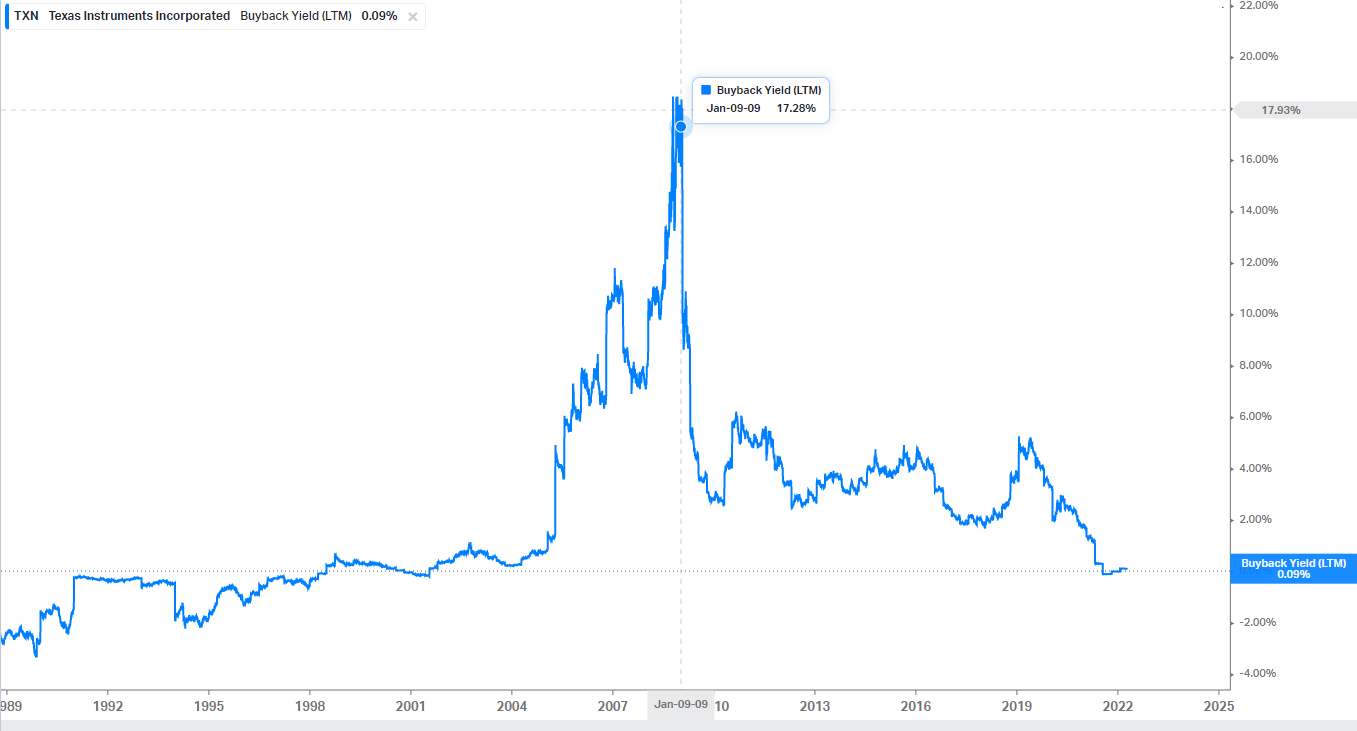
Risk Factors
1) TI mainly sells its products outside of the US. In 2021 the percentage of sales outside the US grew from 90.3% to 90.7%. In 2021 shipments into China were 54.5% of revenues. If the political tensions with China erode further and the trade war intensifies, that might have an impact on margins.
2) TI is the market leader in its core analog semiconductor segment, but they still only have a 19% market share. The market is very competitive with many competing firms. TI has the scale advantage, vertical integration of the supply chain and is investing to increase its competitive advantage, but competition remains a risk.
3) As I mentioned in the previous segment, some people speculate that the semi cycle is at its peak. A decline in the general demand for semiconductors could have material effects on TIs operations. Especially considering their accelerated CapEx into new fabs at this moment.
4) Integration of newly built fabs and the recently acquired 300mm semiconductor fab in Lehi, Utah pose a risk too. These assets need to be integrated into the company. There is an execution risk here.
I believe that these risks are manageable and that the experienced management team will be able to deal with the risks that are in their control. Risk 1) and 3) are outside their control though, so investors should keep that in mind.
Valuation
Long term the best way to value a company is based on its FCF/share growth. Historically TI has compounded FCF/share at 12% since Templeton took over as CEO in 2004. With the accelerated investment cycle and the increased adoption of the D2C sales channel I strongly believe that TI will be able to at least keep up with this 12% FCF/share growth, but let’s be conservative and assume a deceleration to 10% growth. On top of the FCF/share growth, we have to take their current FCF/EV yield into account of 3.9%. Keep in mind that the FCF yield might be suppressed for a few years due to the acceleration in CapEx, but over the long term, this will result in the growth of FCF. This FCF is then fueling buybacks (if the company’s DCF indicates a buying opportunity under intrinsic value and the cash can’t be reinvested elsewhere) and their 2.5% dividend yield with a CAGR of over 15%. This leaves us at a CAGR of 13.9% roughly over the next decade, based on my assumptions and offers a great buying opportunity at current prices.
TI PE ratio and FCF yield (koyfin)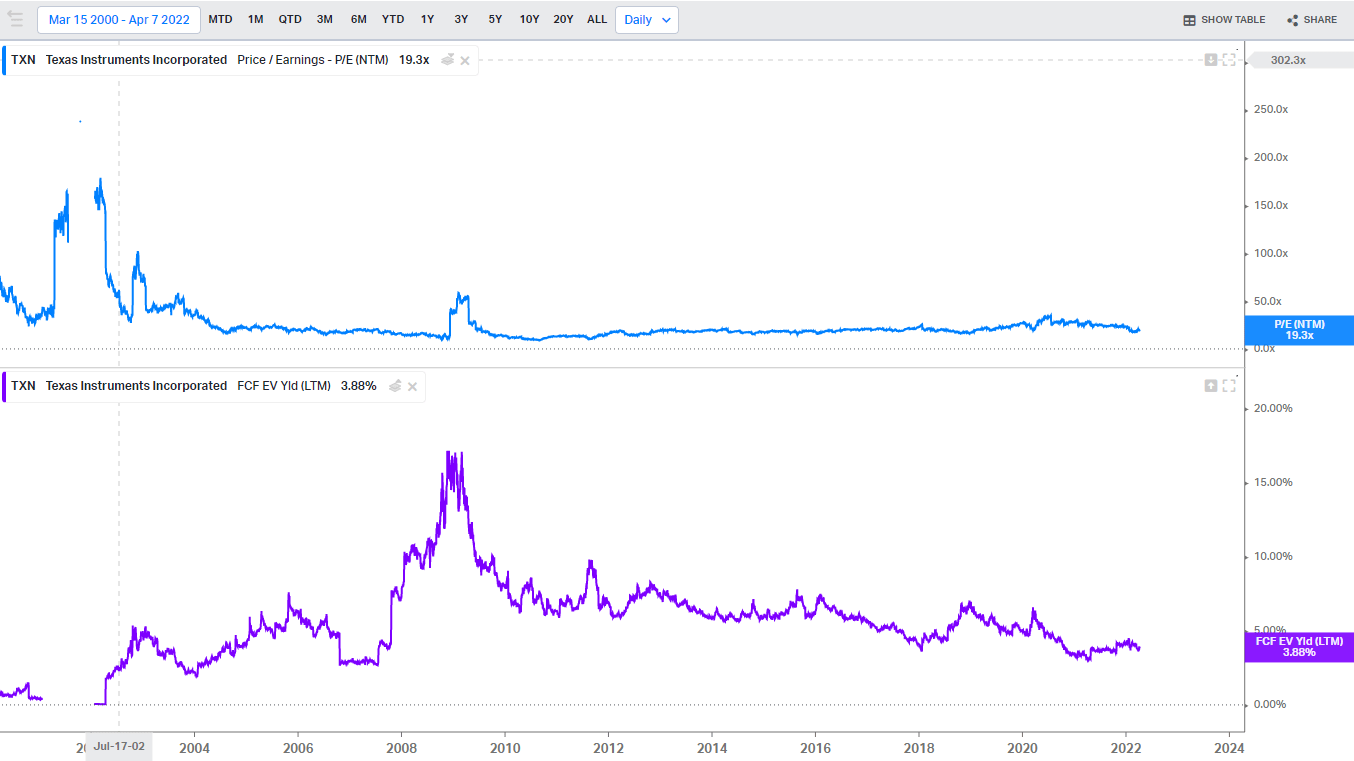
The forward-looking PE of TI is currently at 19.3, in line with the forward-looking PE of the S&P 500 index. I strongly believe that TI is a much higher quality business than the average company in the S&P 500, based on return on capital, margins, their stellar balance sheet and other quality metrics. Over the next decade, I believe that TI should at least keep pace with the average PE and could even trade at a higher multiple than the Index. Analysts are currently expecting TI to grow at a 7.5% EPS CAGR over the next three years, but TI has beaten EPS estimates in eight consecutive quarters. Due to the industry tailwinds and further increases in operating efficiencies I described in my article, I believe that they can beat these estimates in a meaningful way and reach my outlined 10-15% CAGR.
TI earnings surprise (Seeking alpha)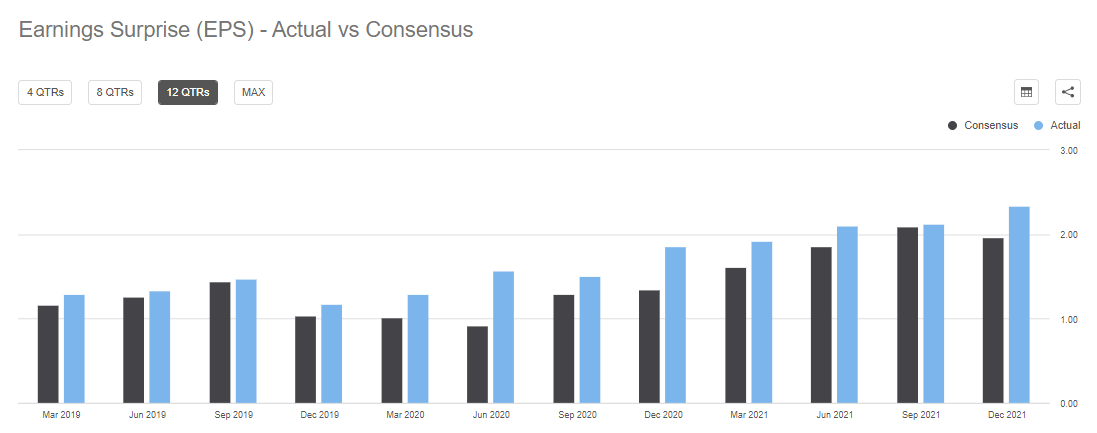
Conclusion
I am convinced that TI will delight long-term-oriented owners over the next decade with rising dividends, strong buybacks and a great total return. TI has some risks though, which I outlined and should be considered by investors. It’s one of the highest quality companies I came across in my investing journey so far and I recently increased my allocation into Texas Instruments to 8%, the second-largest behind only ASML (ASML) with 10% of my portfolio.
Be the first to comment