

Maks_Lab/iStock via Getty Images
It’s known that an inversion of the yield curve as measured by practitioners based on the difference between the 10-year and 20-year yields (T10Y2Y) has occurred before all six recessions since 1976 but has generated a false signal in July 1978.
10-Year Treasury Constant Maturity Minus 2-Year Treasury Constant Maturity (T10Y2Y) (Federal Reserve Bank of St. Louis)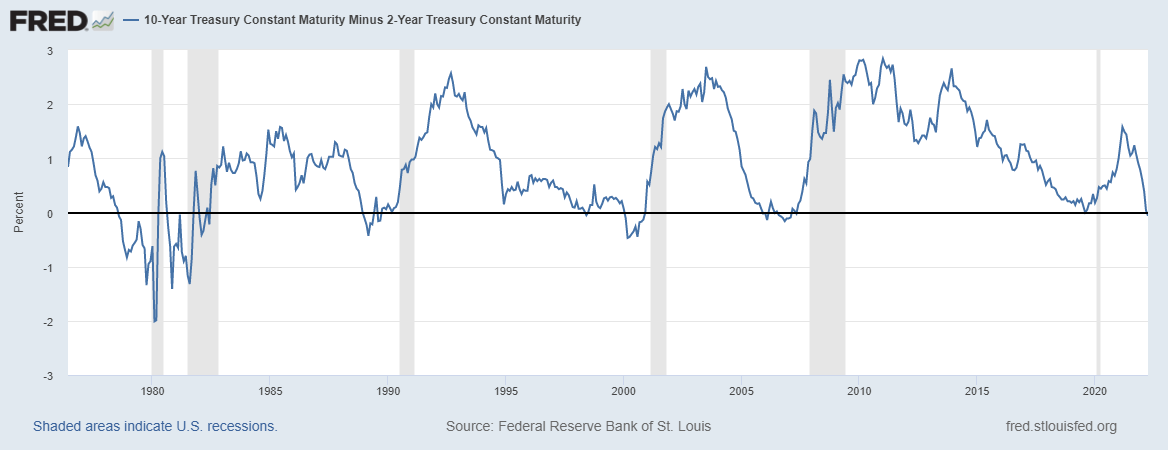
Recession periods are indicated with the light gray shading in the above chart. Due to the small sample and a failed signal, it isn’t clear whether this indicator of recessions is reliable. Academics have instead focused on the spread between 10-year yields and 3-month rates (T10Y3M).
10-Year Treasury Constant Maturity Minus 3-Month Treasury Constant Maturity (T10Y3M) (Federal Reserve Bank of St. Louis)
By this measure, the yield curve is far from inverted. However, this chart goes back only to 1982 versus 1976 for the previous chart for T10Y2Y. Therefore, an important comparison regarding signals in 1978 cannot be made from these charts.
Regardless, our point here is that these specific term spreads, and indeed all term spreads, are quite uninformative and have only served as a part of narrative creation over the years.
The recent wide divergence between T10Y2Y and T10Y3M term spreads has even triggered a new round of speculation that this was caused due to the Fed never being behind the curve as they are today and this signals a recession.
Let us look at the difference between the two term spreads we defined above, the T10Y2Y and T10Y3M.
Difference of T10Y2Y and T10Y3M Term Spreads (Price Action Lab Blog – Norgate Data)
The top chart shows the two term spreads; the blue line shows the T10Y2Y term spread and the red line shows the T10Y3M term spread. The recent divergence can be seen from the above chart. But has this divergence provided a reliable signal of recession and, more importantly, of a pending bear market in stocks?
The bottom chart above shows the difference between T10Y2Y minus T10Y3M, which currently stands at -1.76%. It may be seen that during 1994, the T10Y2Y nearly inverted while the T10Y3M was around 2%, causing a wide divergence between these two term spreads. Surprisingly, this inversion coincided with the start of one of the stock market’s longest uptrends in history, as shown by the superimposed chart of the S&P 500 (orange line).
Usually, narratives about term spreads rely on obscuring essential information, which is shown in this article. There is no way the wide divergence in these term spreads can be considered a reliable indicator of the state of the economy, and more importantly, of the future course of the stock market, when there was a failed signal before one of the most dynamic bull markets in history.
A recession may occur, a bear market could follow, but the point of this article is that term spreads are uninformative and used partly to confirm biases.
The equity markets are non-linear stochastic processes with fat-tailed returns. Small samples of events cannot guarantee the significance of the indicator used. For these types of processes, in order to calculate probabilities and, more importantly, the expectations arising from the probabilities related to future performance, with sufficient significance, sample sizes must be in the order of hundreds or even thousands. This is one reason practitioners pay more attention to risk and money management, rather than trying to predict future market direction and the state of the economy using obscure indicators such as term spreads.
Be the first to comment