

Nikada/E+ via Getty Images
Tecnoglass Inc. (NYSE:TGLS) strives to achieve and maintain a vertical business model which allows it to have more control over distribution and costs. Being directly involved in all processes from the factory to the client allows the company to maintain competitive prices for its products.
In 2016, the company acquired ESW, which gave them control over the distribution of its products manufactured in Colombia. In 2017, TGLS bought its largest installation and consulting customer GM&P. The company continues to implement this policy by actively searching for new acquisitions.
The vertical integration of raw material purchases, manufacturing, and distribution has allowed TGLS to achieve high-profit margins. In fact, the company has a TTM gross profit margin of 46.43%, high in absolute terms, and 29.06% higher than the sector median.
And TGLS has had a gross profit margin average of 35.56% over 5 years, which is 30.57% higher than the sector average. Maintaining such a high-profit margin for a sustained period is an indication that the company can continue to maximize revenue.
As part of its drive to acquire larger shares of the residential new and replacement sectors, the company introduced two new products under the ES Windows brand. The company went from 5% of revenue in 2017, to 35.7% of revenue from sales in these sectors.
Considering the performance of the broad stock market in 2022, shares for TGLS outperformed the S&P MidCap 400 by 32.42%.
Industry Trend
The percentage of revenue from residential window sales is 35.7% for Tecnoglass. Presumably, commercial glass windows sales make up the largest part of revenues for this company. Looking at the industry trends, it’s, therefore, necessary to split the analysis into two parts.
Commercial Property
Sales from commercial property in my opinion are likely to come mostly from new building projects. I imagine the windows of most of these structures last longer than residential buildings. For commercial property sales, data on starts is, therefore, the most important factor.
It was not possible to find data for the latest months. What I did find is that the value of commercial and multifamily construction starts in the top 20 metro areas increased by 24% in the first half of 2022. Also, according to Dodge Construction Network, in the top-ten metro areas, commercial and multifamily starts increased in value for the first half of 2022 by 28% over 2021.
The value for commercial and multifamily starts in the top 20 metro areas for the first half of 2021 was $64.82 billion, while in 2022 it was $80.45 billion for the same period.
The table below shows a breakdown of the commercial and multifamily start value for each metro area and the progression since 2019. We can see that after the drop in 2020, due to the pandemic restrictions, construction value then picked up again from 2021 and surpassed the level of 2019.
Dodge Data & Analytics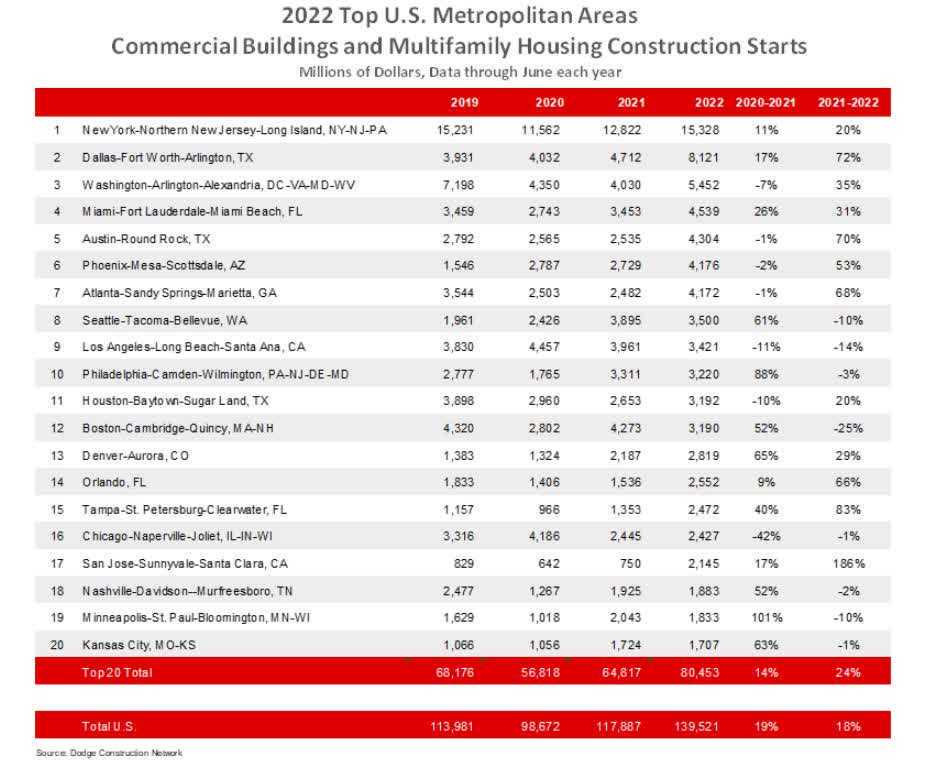
Residential Property
Housing starts have been on the decline throughout 2022. Mainly due to the increase in mortgage costs as the Fed has tightened monetary policy. Housing starts reached a 3-month low of 1.427 million in November 2022, which was still higher than the year low of 1.377 million in July.
TradingEconomics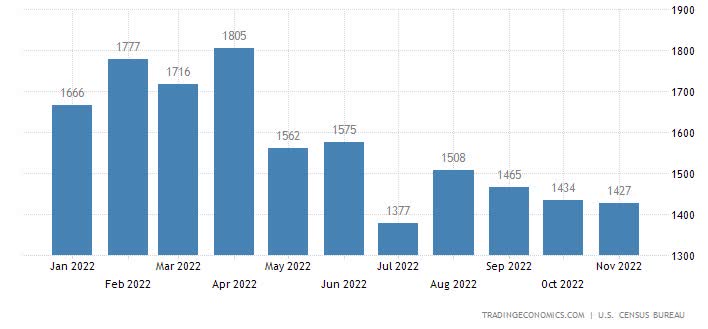
Expectations for December 2022 housing starts see another decline with a consensus of 1.385 million. How much further the residential housing market will shrink remains to be seen. And it will have a lot to do with how high the Fed pushes interest rates.
I see high interest rates as negatively affecting home sales when they are on the rise. Interest rates that may be higher than in previous years but are stable for some length of time do not have the same drag. Consumers become accustomed, and demand returns.
Tecnoglass Fundamentals
The fundamental aspect I like the most about Tecnoglass is the high and increasing gross profit margin. Not only is the profit margin high compared to its peers, but it has also been on the rise for 3 consecutive years since 2019.
The increase in profit margin has also been accompanied by a sharp increase in earnings. From 2018, the company has nearly tripled its EBITDA. TGLS has gone from earning $70.4 million in 2018 to $205 million for the TTM.
Seeking Alpha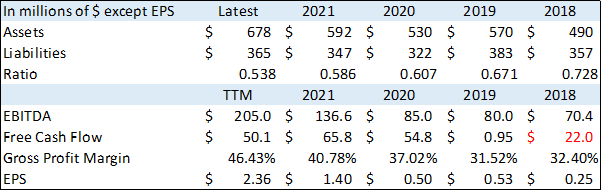
EPS has also risen steadily over the same period from a meager $0.25 to $2.36 TTM. Free cash flow (“FCF”) looks like it was a bit of a problem in 2018 with a negative $22 million on its books. However, the company has corrected the issue and FCF has been on the rise, reaching $50.1 million TTM.
The liabilities to assets ratio is declining and has been since 2018. Since the decline has been steady and consistent, I have not compared it to the sector average. I see the level as positive and as the company having things under control for the long-term sustainability of the company.
Quant rating
The quant rating for TGLS is at 4.9, a strong buy, while Wall Street also sees this stock as a strong buy. Out of the 5 factors that are used to calculate the rating, 3 are A- and one an A+. Valuation gets a C+, which may look weak compared to the other factors.
However, the Valuation model shows the elements bringing down that factor’s grade are Price/Book, Price/Sales, and Dividend Yield. Whereas P/E gets at least a B+ and EV/EBITDA gets an A-.
Seeking Alpha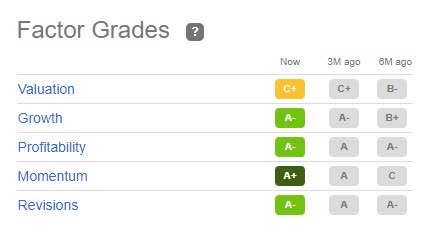
Tecnoglass Technicals
The technical outlook for Tecnoglass also matched the positive fundamental outlook. Not that technicals will always be right, but it adds another clue as to the direction a stock might be headed.
Looking at the weekly chart, we see price action is well above the Ichimoku cloud and all the other elements of the system indicating a bullish trend. We can also see price has broken above the resistance line at the $28.27 area, which is the previous high from March 2022.
The next resistance area should be found at $34.90, its all-time high from November 2021. The RSI is also above 50 and its moving average, indicating bullish momentum. Price action has been confined to a range over the past 6 weeks. A close above this area should lead price to test the all-time high at $34.90.
Whereas a break below the $28.27 support line could lead to further declines, with the top of the Ichimoku cloud acting as support at the $25.50 zone.
TradingView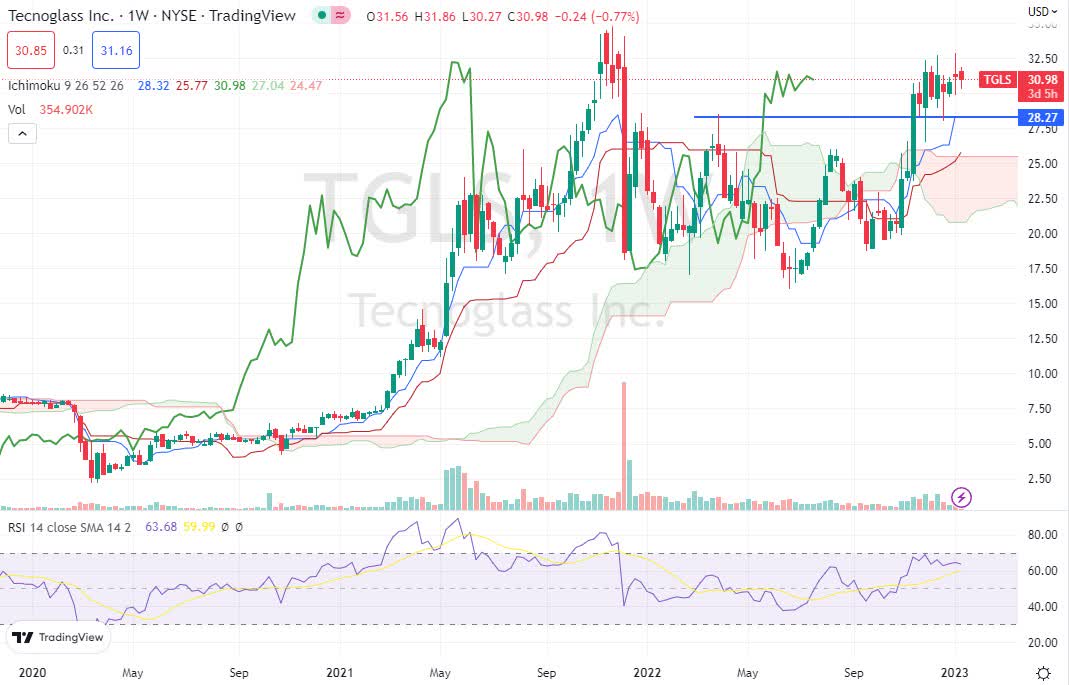
The daily chart below also shows a bull trend in full swing. After dipping below the cloud in late September 2022, the market recovered and has been rising since. True that the surprising earnings release for Q3 2022 with a surprise of 42.25% was a big catalyst for the market to return bullish.
The bull trend gets some confirmation of its validity from the higher-than-average daily volume as can be seen from the bar chart below the candle chart. Most of the large trading volume bars are green, indicating buyers are in control.
The RSI is above 50 indicating a bullish environment, while it’s also close to its moving average which is due to the ranged price action over the past weeks.
TradingView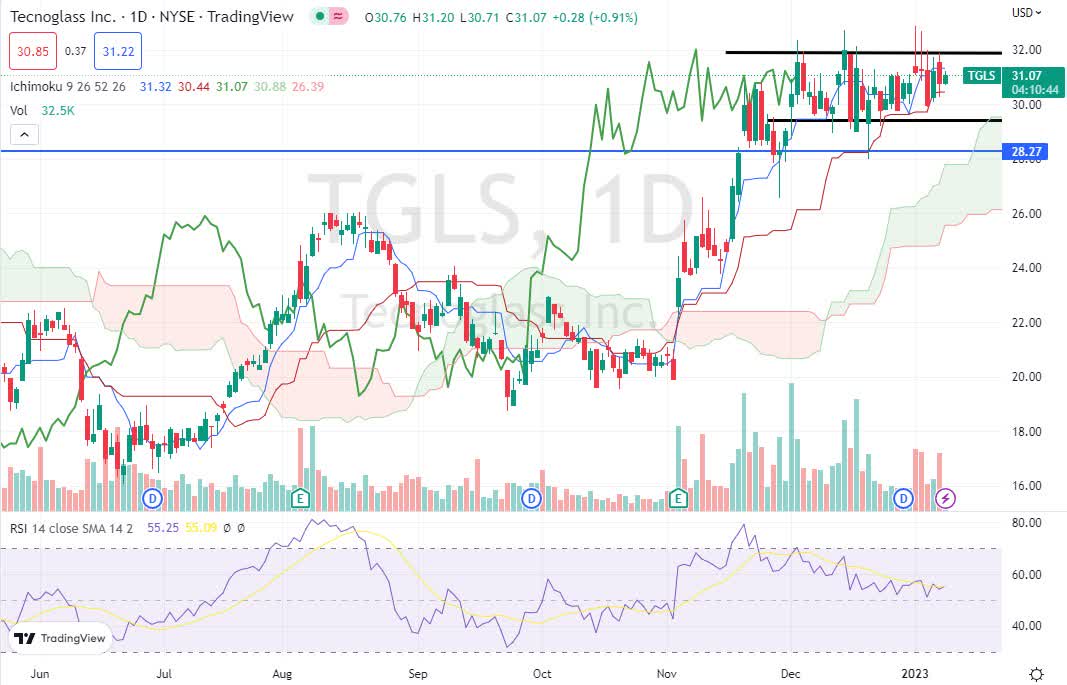
Looking at how this stock has performed over the recent past, we see that for FY 2022 TGLS gained 17.34% and outperformed the S&P MidCap 400 (MDY) by 32.54% which closed 2022 down 15.08%. Perhaps more importantly, over the past 3 months TGLS is up over 42%, while the mid cap index is only up 9.9%.
Conclusion
The fundamentals and technicals both look very good for Tecnoglass. But you’re bound to ask how can the company keep generating profits in what may be a shrinking market. I see TGLS managing to Increase profits by increasing its market share.
Decreasing new residential home starts and presumably a smaller market should be offset by increasing its market share in that sector. While for the commercial sector, we see that it hasn’t experienced contraction as of the first half of 2022.
I expect commercial real estate may continue to develop perhaps at a slower rate. However, the same principle applies, Tecnoglass Inc. should manage a greater market share and still increase its profits. Considering its potential to gain a greater market share, its high profit margin, and increasing earnings I give Tecnoglass Inc. stock a target area of $42 to $47.
Be the first to comment