

Dzmitry Skazau
Two weeks ago I stated in my latest article that the Nasdaq had finally bottomed after a long fall from 16,212 in mid-November of 2021 to 10,088 in mid-October of 2022. This works out to an eleven-month drop of 37.8% from peak to trough. Of course, nobody knew that the Nasdaq finally hit bottom last November, but over the last four months, the index has been building a solid sideways bottom formation.
Along the way, it tested its bottom three times and the bottom held. As you can see from the chart below, the Nasdaq is now transitioning from a No. 1 sideways (bottoming) pattern to a No. 2 uptrend pattern. There’s no guarantee that this new burgeoning uptrend will follow through, but you will see a lot more evidence of this new uptrend when we look at several individual stocks a bit later.
Marketsmith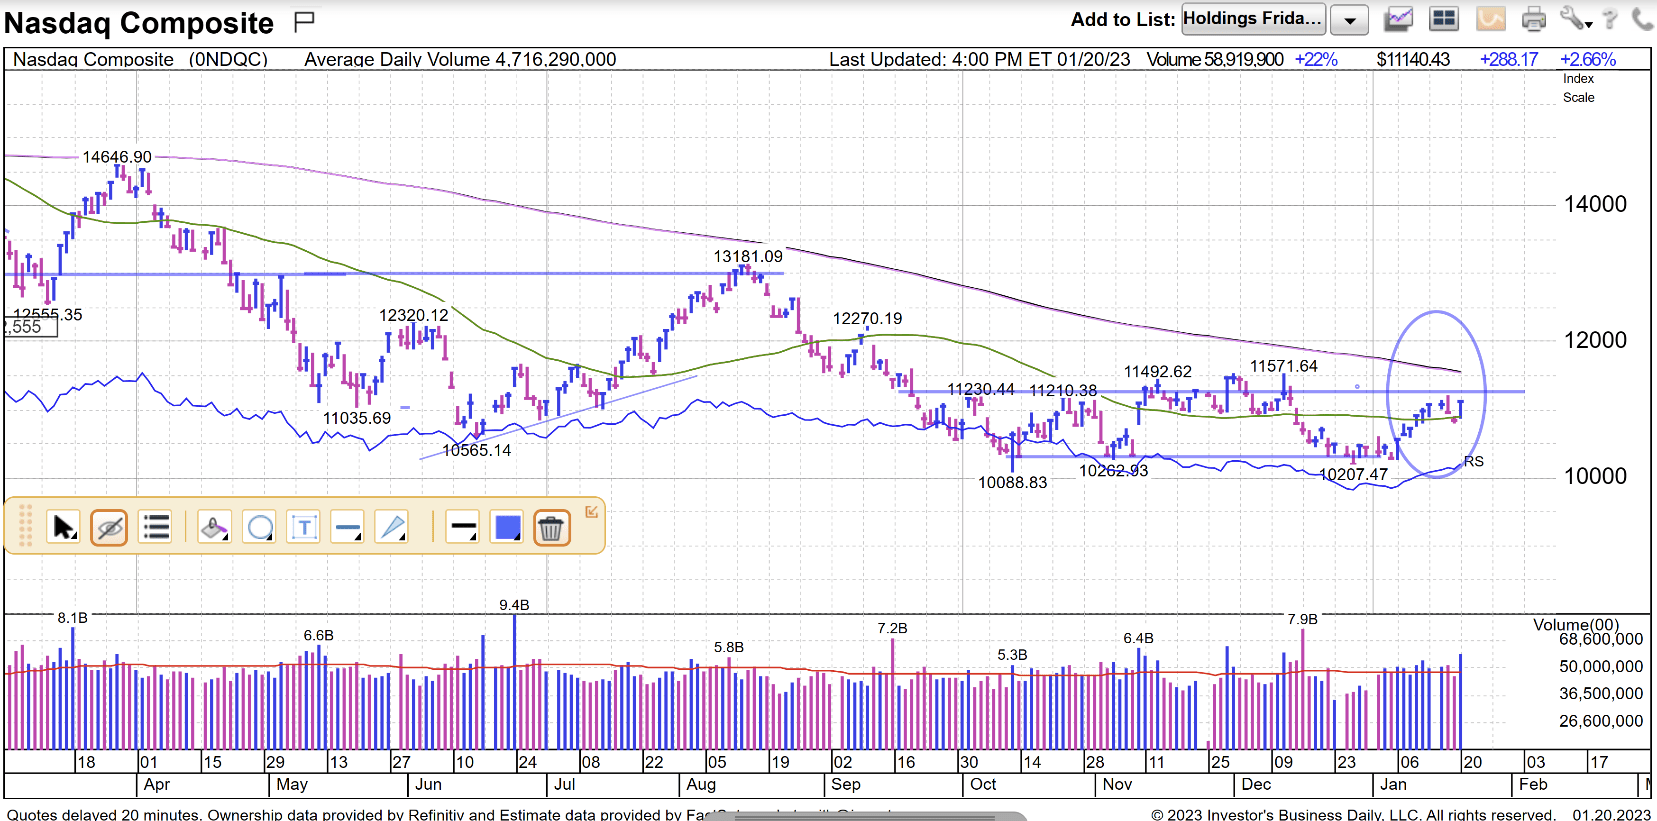
There’s a good reason for the big drop in the Nasdaq and the subsequent bottoming, and now a big attempt at a return to an uptrend once again. In the simplest of terms, it’s mostly due to interest rates. During my early years of over two decades in the business, I spent some time as an analyst writing up research reports on stocks.
The main components of a research report are five-year revenue and earnings growth projections, a multiple, and a target price. The growth projections come from talking with management and looking at previous income statements to make yearly pro forma statements going forward.
Once an earnings number is projected five years down the road, a multiple is then chosen to multiply those earnings by to come up with a five-year target price. There are many factors in determining an appropriate multiple. The multiple – PE – history of the company and its peers, the sector that the company is in, the growth rate vs. other companies in the industry, and prevailing interest rates at the time are all a part of this process.
The lower the prevailing interest rates at the time, the higher the multiple to be used. This is why the S&P 500 began 2022 with a forward PE ratio of 23X, when the long-term average has been in the 16-18X area. With Fed fund rates at almost 0.0% at that time, a bubble in stocks was created by this expanding multiple. All it would take is rising interest rates to begin to reign in this multiple.
By the end of 2022, the forward PE ratio of the S&P 500 had contracted to the 17X area, however. This works out to a 26% drop in the multiple for the S&P 500. This corresponds very closely to the overall drop in the S&P 500. Earnings did not drop, the multiple dropped. The higher PE Nasdaq was hit with a 33% drop in 2022.
In November of last year, the Fed stated that they were targeting 5.0% as the terminal Fed fund rate. That meant that by the spring of 2023, the interest rate hikes could be over. The forward-looking market began to build a bottom at that point in time as the shrinkage in the multiple was now coming to an end. We were now arriving back at the long-term average of 16-18x for the S&P 500.
The market still had to make sure that the rate hikes were bringing inflation down and that they had done enough damage to the market to impact earnings, however. So far, so good. Earnings estimates for 2023 and 2024 have only been shaved by a little bit, and inflation has now come down into the 6.7% area. The PPI number actually dropped -0.5% this past week.
There’s now light at the end of the rate hike tunnel, and it only makes sense that hard-hit indexes would react favorably to this prospect. The DJIA formed a death cross when the 50-day moving average crossed below the 200-day moving average back in March 2021. It then recently formed a golden cross in December 2022 as it began to see beyond the current rate hike cycle.
Marketsmith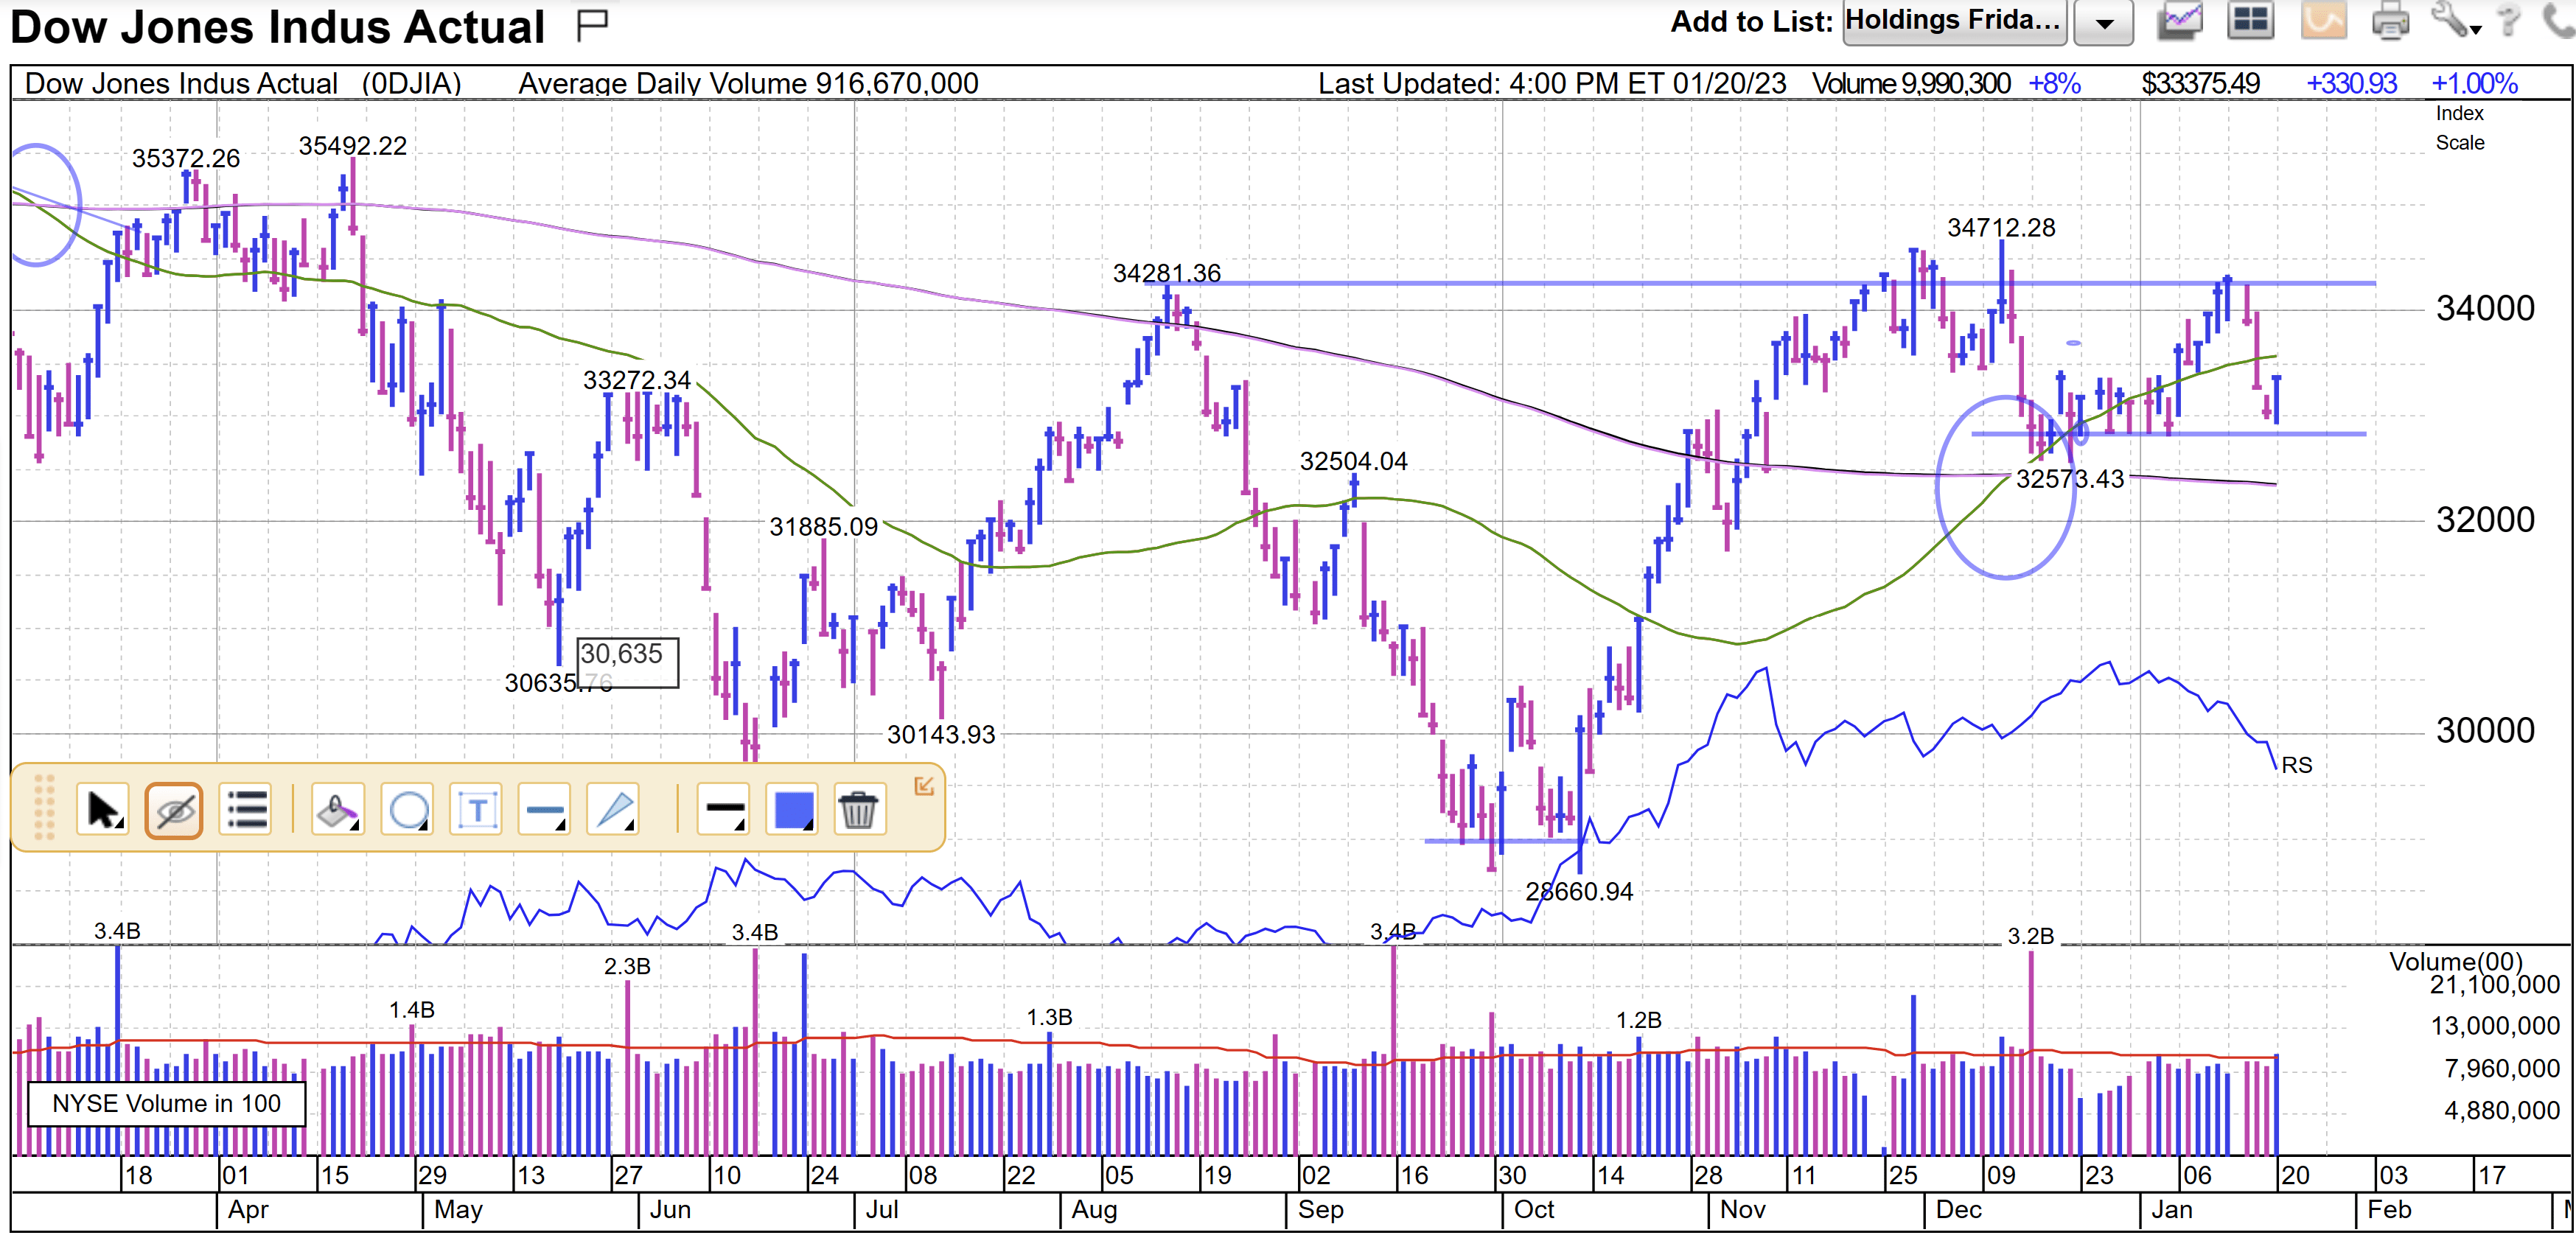
We also can now see a bottom in the very interest rate-sensitive bond market. It now appears that the bond market finally bottomed in late October of last year. This is good news for the multiples of stocks and the market going forward. The bond market has not formed a golden cross yet, but it looks to be headed in that direction.
Marketsmith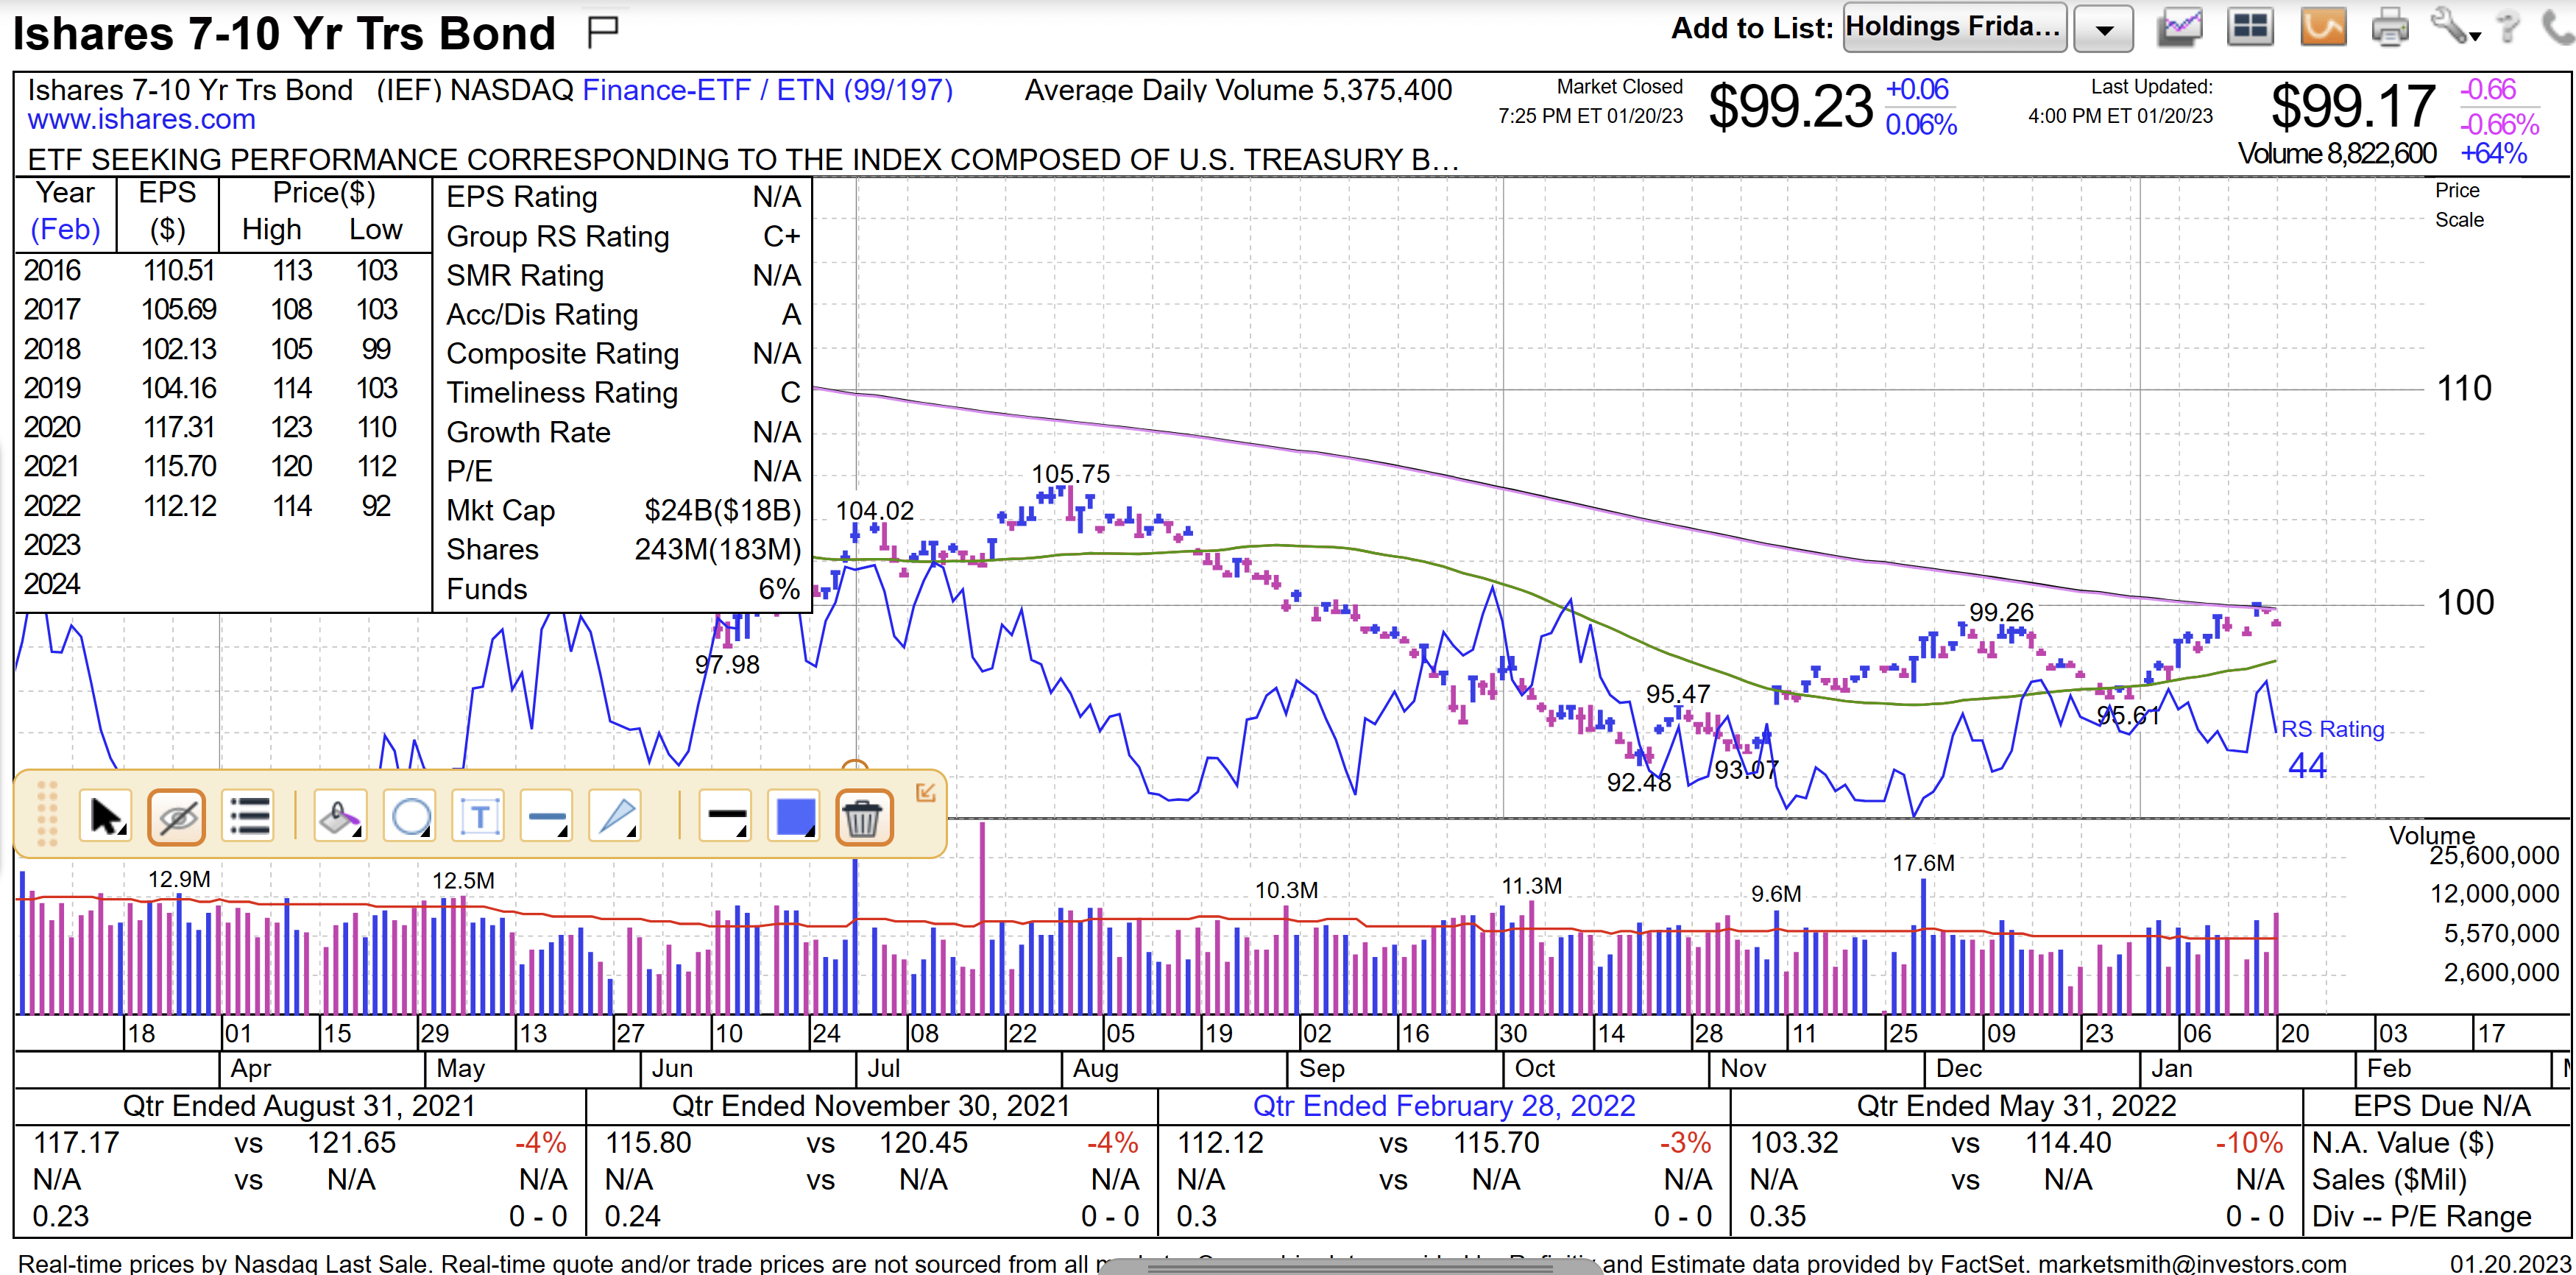
I love the Nasdaq and tech stocks, but they had to be avoided for the most part during the rising interest rate environment of 2022. We used inverse ETFs PSQ and QID several times last year to try and take advantage of the headwinds against high PE stocks.
We also used the ETF SARK last year as a bet against the longest-duration and highest multiple stocks in the market. It was up over 60% last year as Cathie Wood’s ARK innovation fund was crushed as interest rates moved higher. We wrote all about SARK and the trouble that ARKK was in last year.
We began with this Jan. 11, 2022 article that was titled “The Real Reason That ARKK Continues to Sink. We then followed up with an article three days later on how to profit from this situation with the SARK ETF.
We bought and sold SARK several times during 2022, but we finally sold it all on Jan. 4 of this year when the Nasdaq continued to come in for a landing after a long descent. Since that point in time, we have bought back into several Nasdaq stocks. The Nasdaq has only firmed up and continued to look better and better since then.
Let’s take a look at several bell-weather Nasdaq stocks.
The so-called FANG stocks are roaring back right now. Check out the chart of Alphabet (GOOG) (GOOGL) below. Note the huge breakout on Friday.
Marketsmith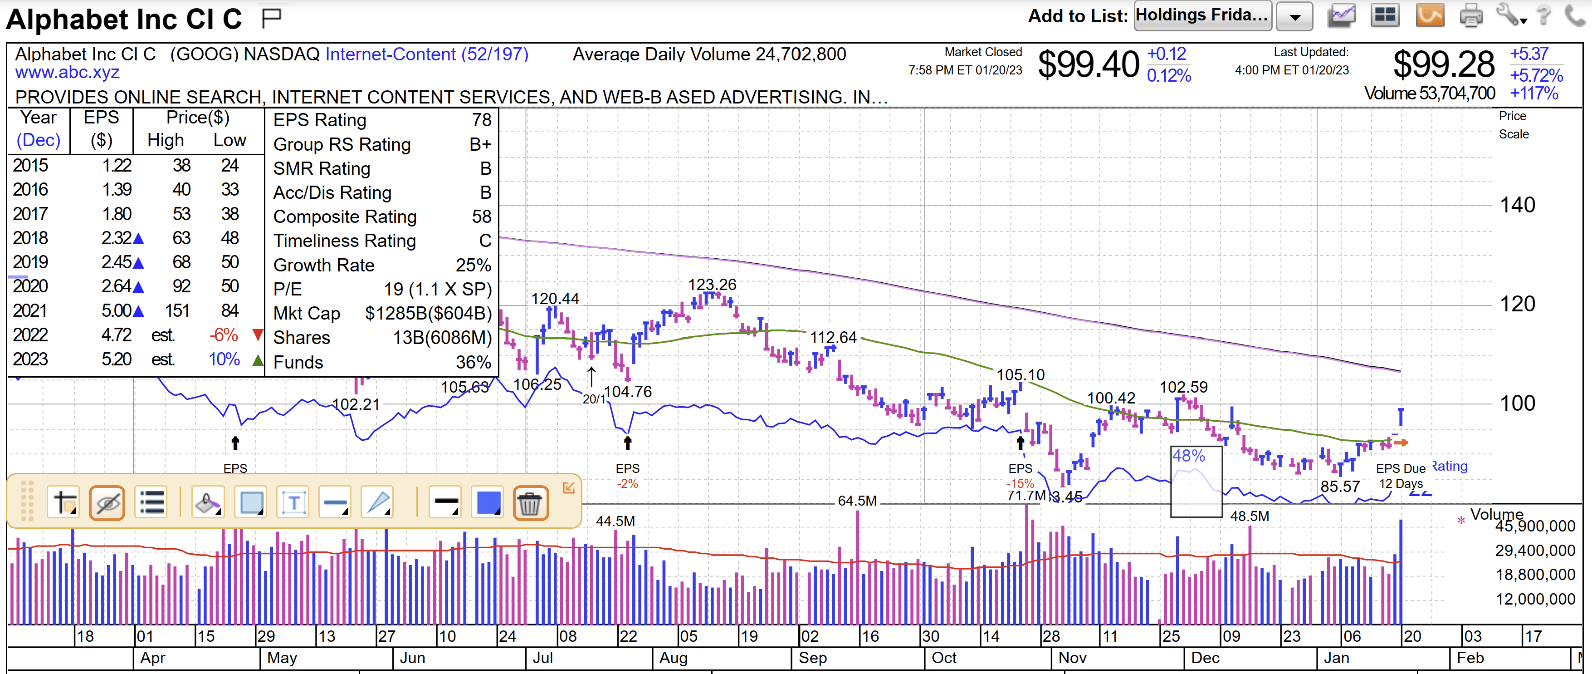
The stock formerly known as Facebook (META) finally bottomed in late October of last year. This coincides with the bottom of the bond market that I have previously shown. Meta has made a big move since then and is now breaking out. It currently sports a PE ratio of just 13X.
Marketsmith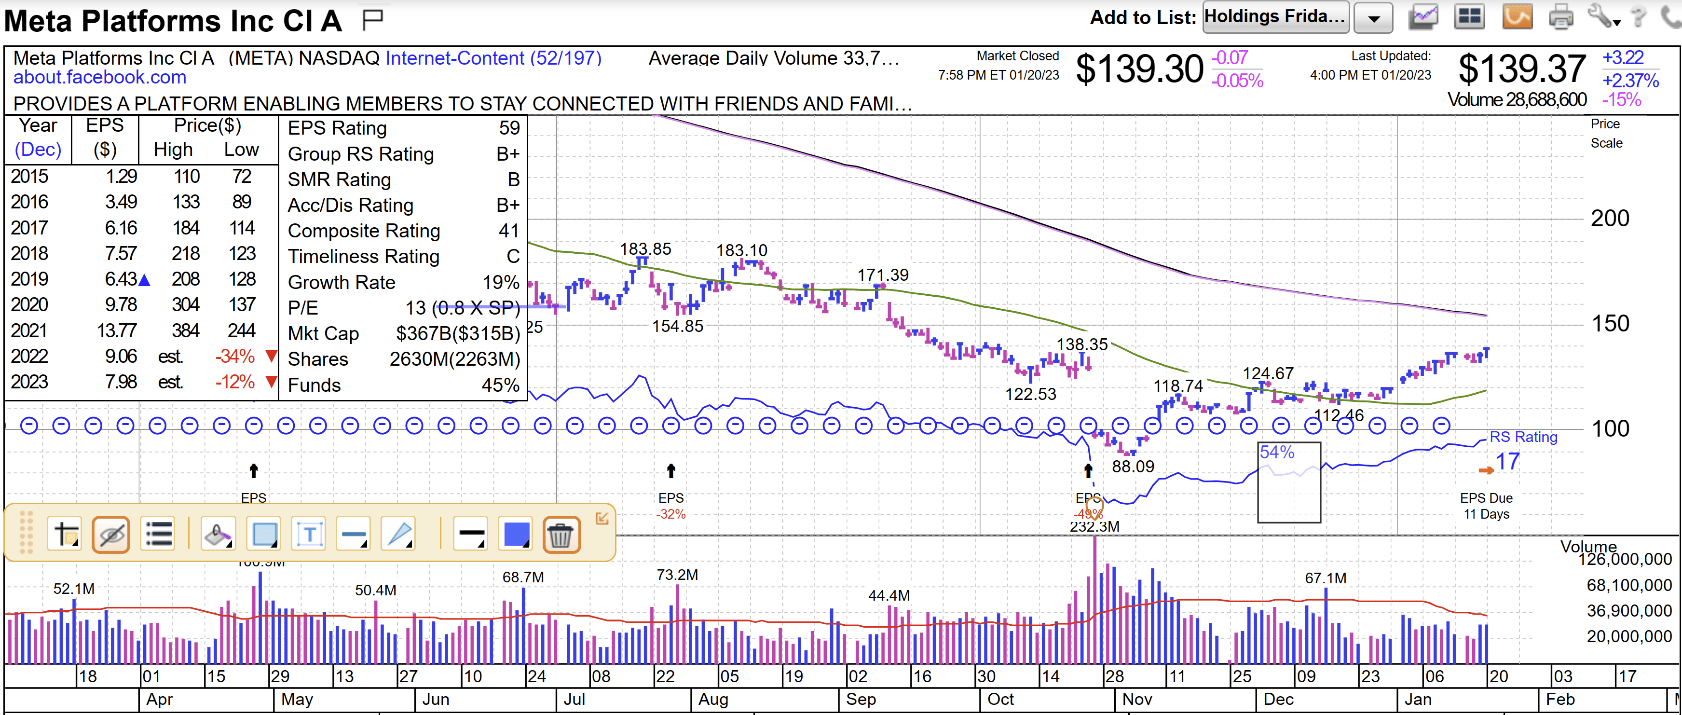
Look at the huge breakout in Netflix (NFLX) this past week.
Marketsmith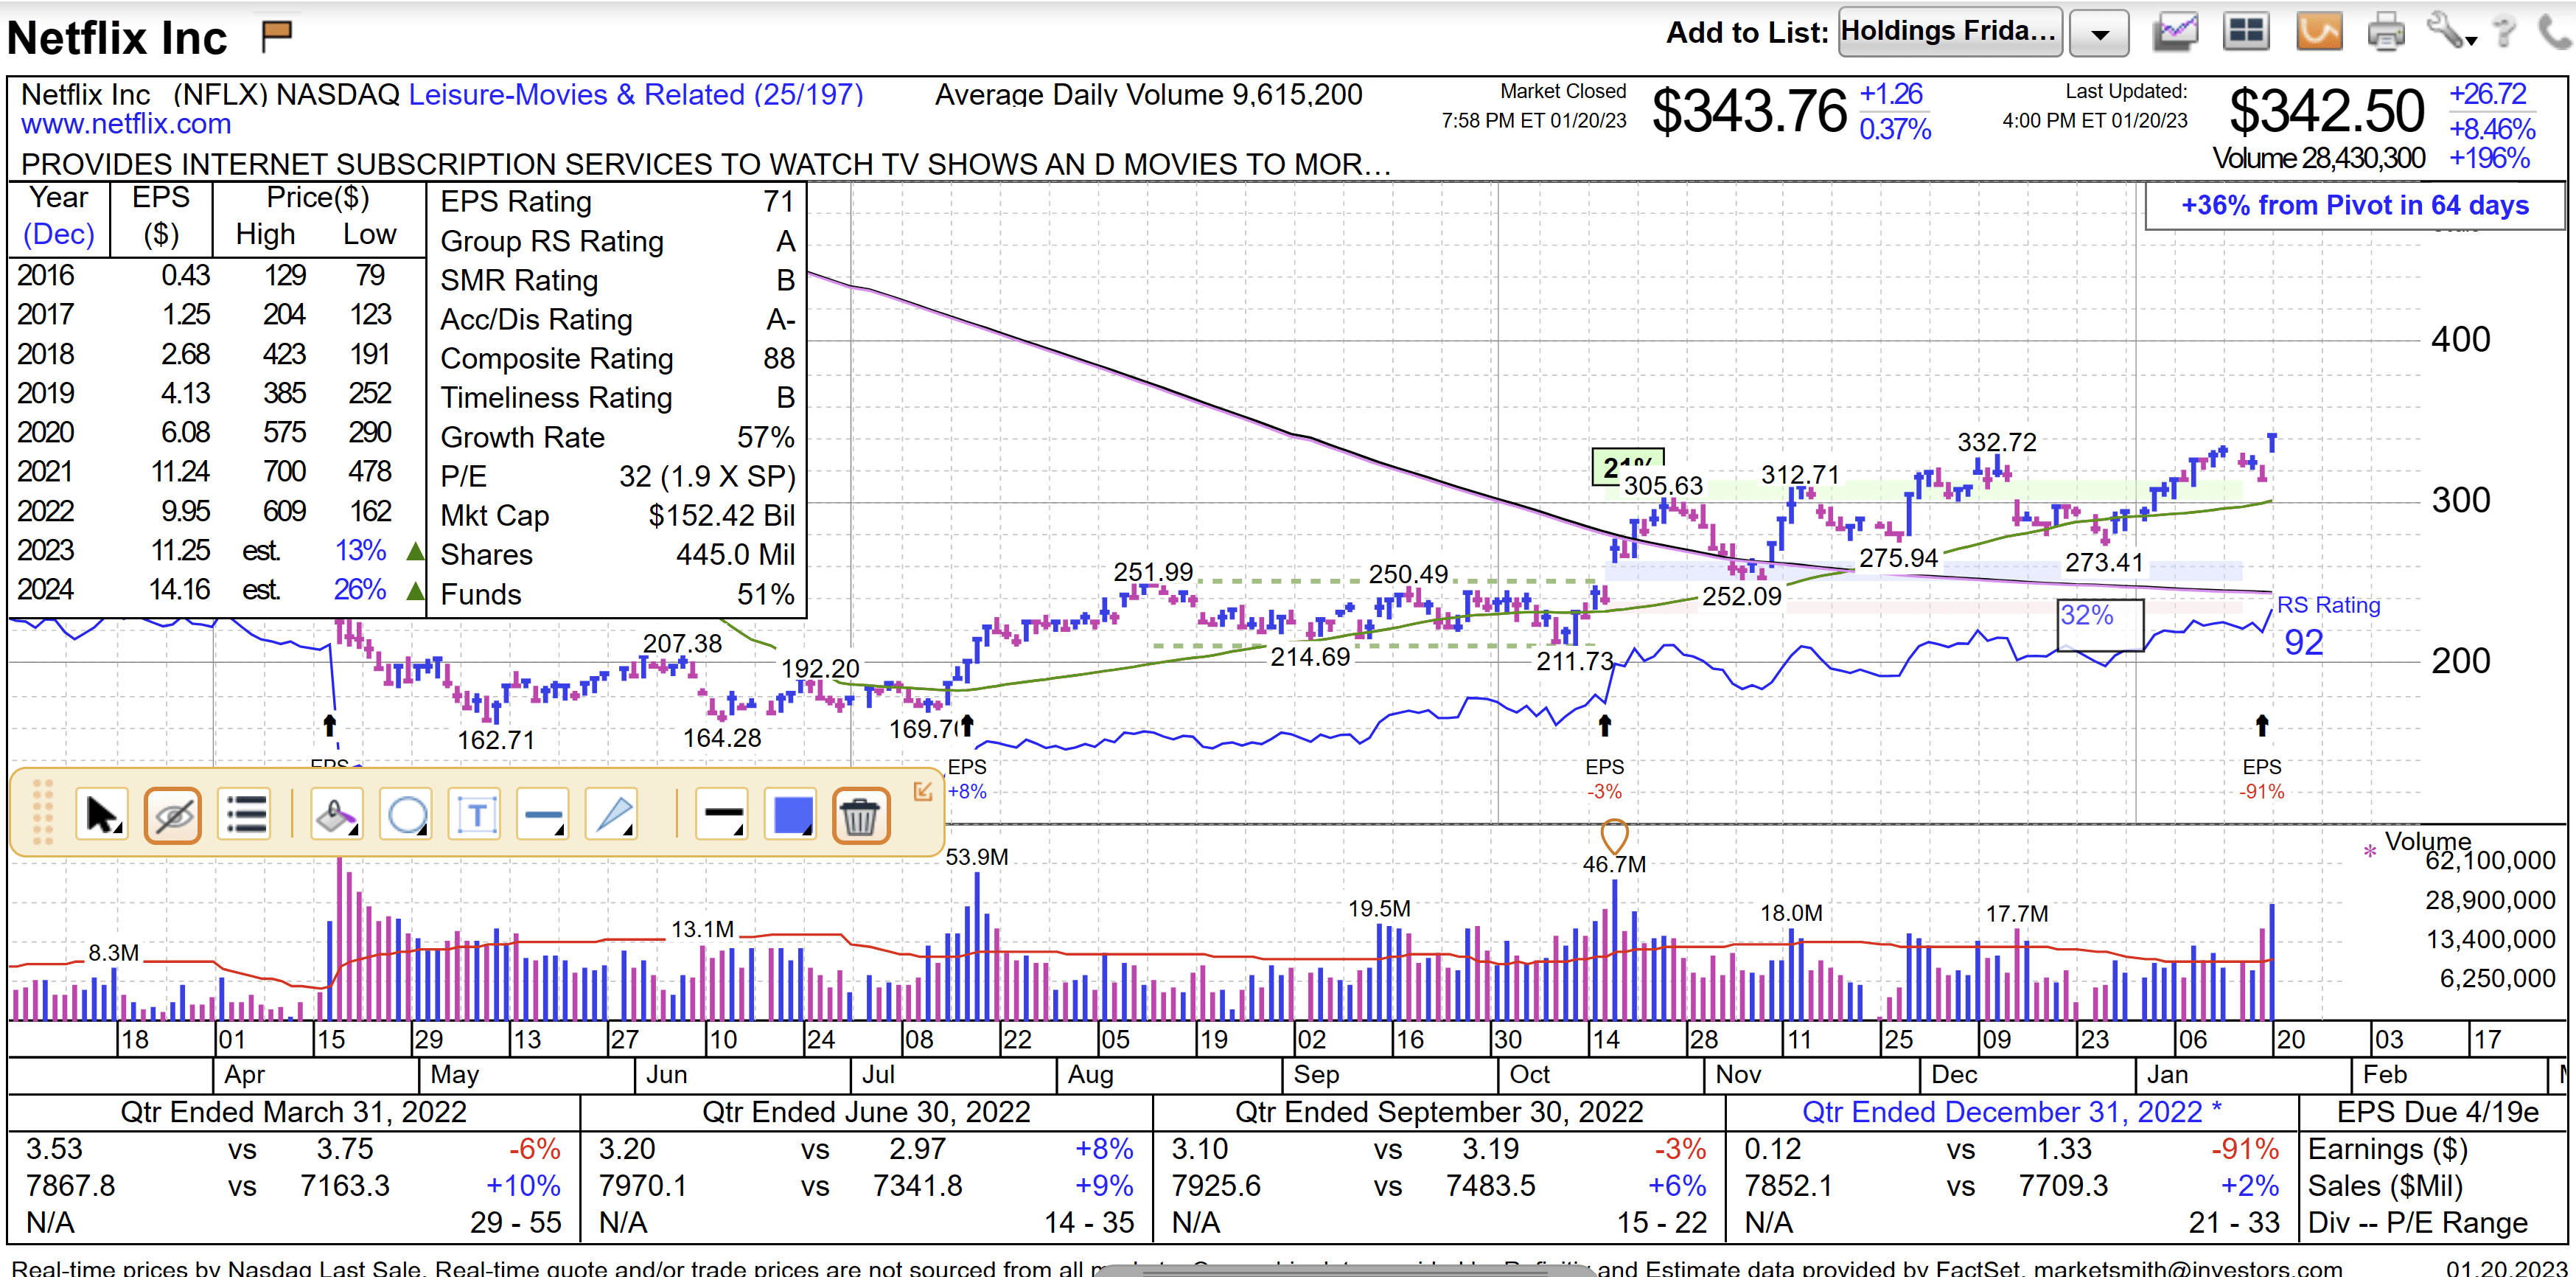
It’s hard not to get excited by the current chart of Nvidia (NVDA) right now. It’s now close to breaking out and making a golden cross.
Marketsmith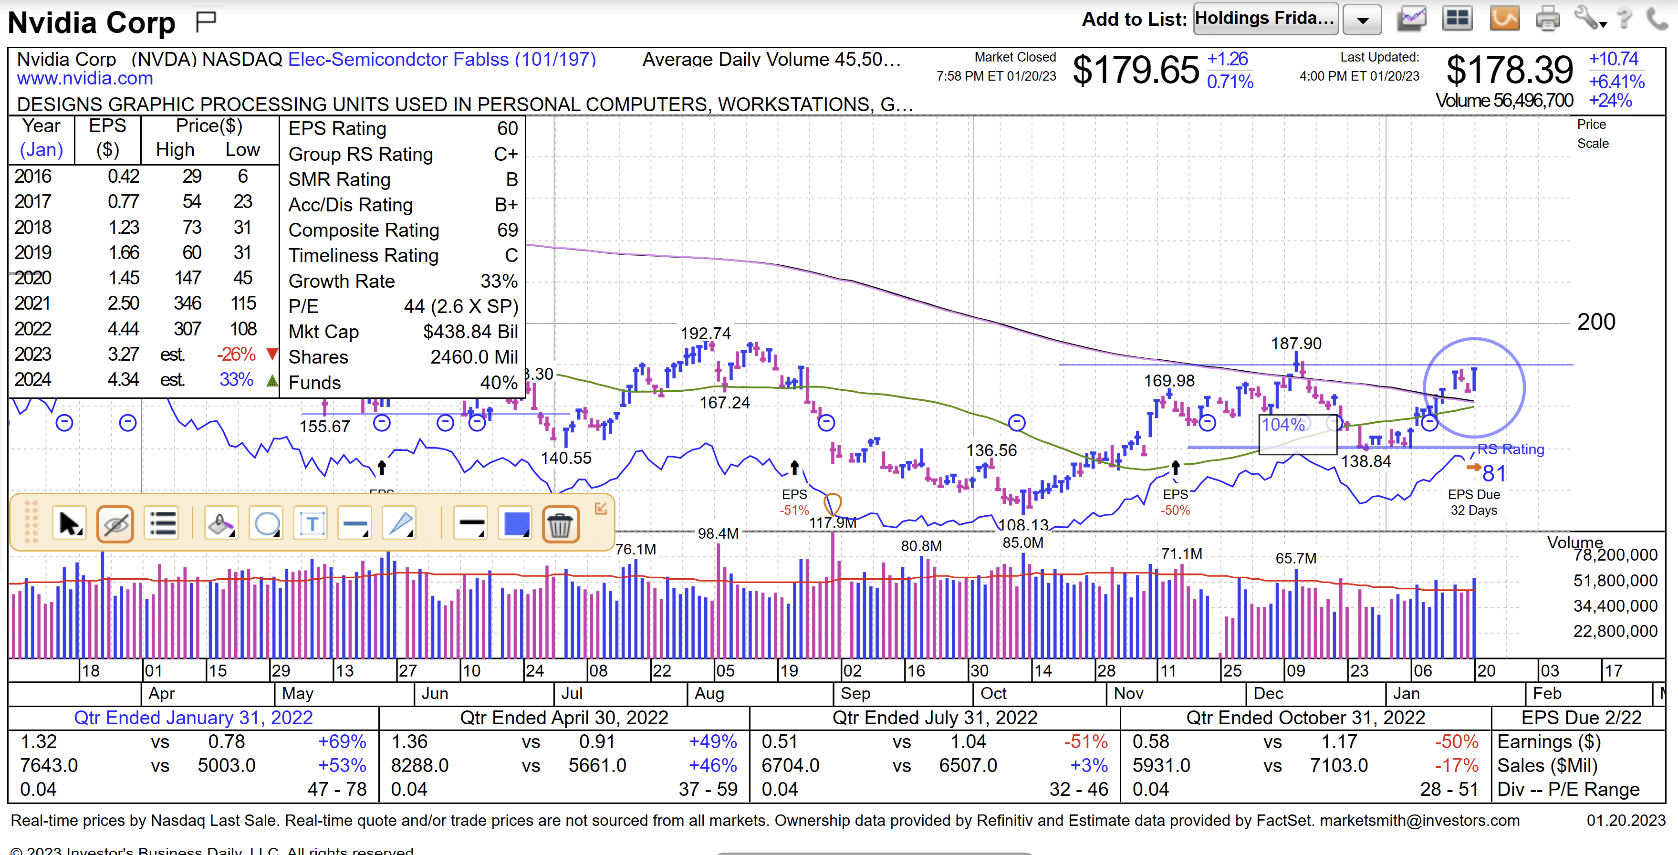
I could parade a lot more witnesses before you, but this should be a fairly convincing story by now. I will close this article with one tech stock that we especially like right now: We first brought ServiceNow (NOW) to your attention with an article way back on Sept. 4, 2018. The stock was trading at $200.26 back then, and it closed at $441.83 on Friday. It has provided a lot of alpha along the way. In fact, it got as high as $707 back in 2021. We recently got back into the stock.
Marketsmith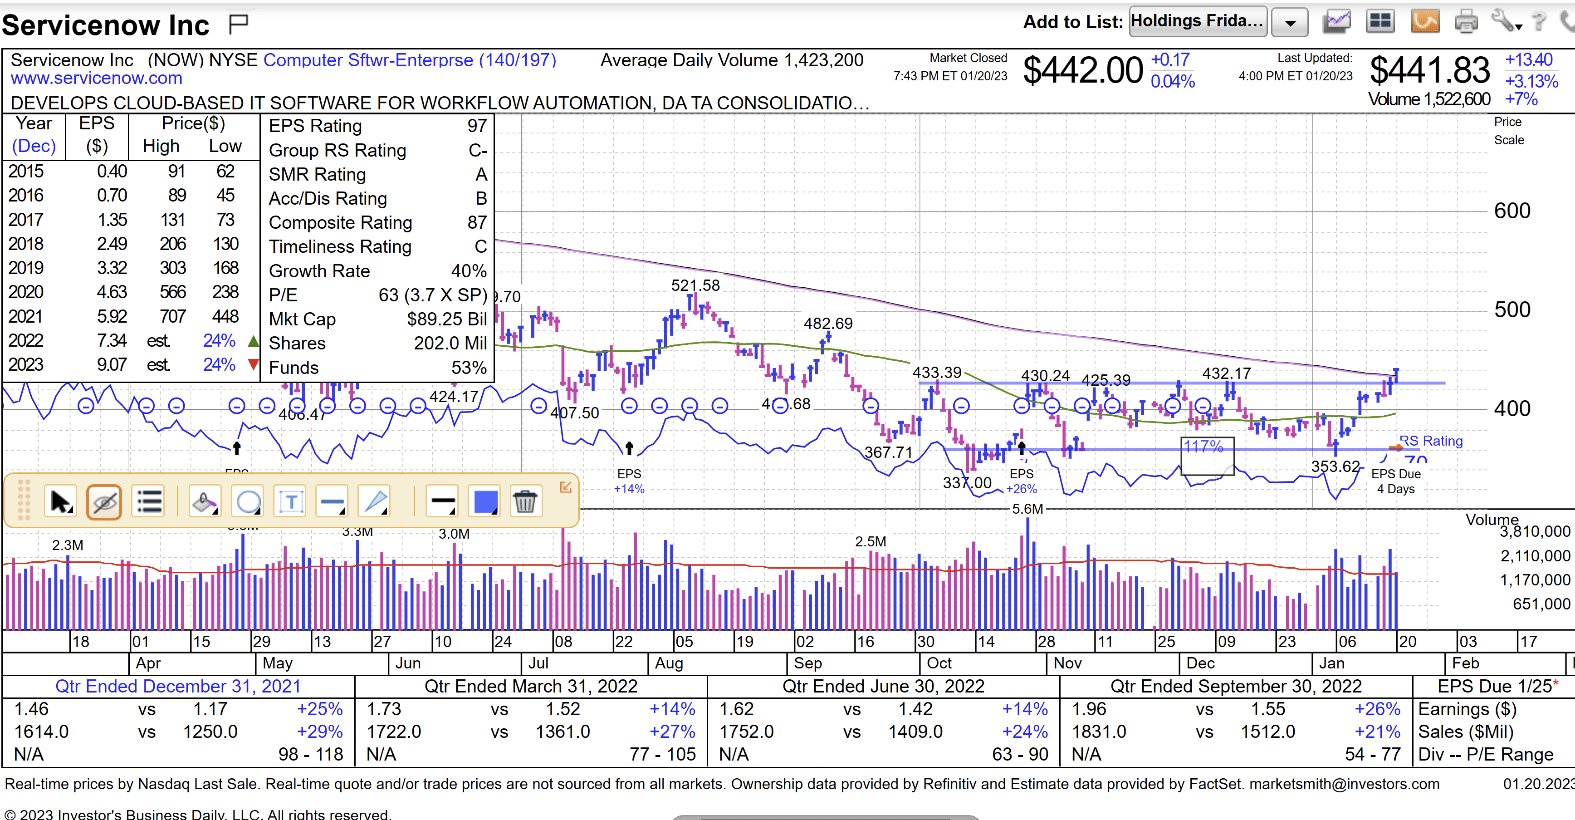
As you can see from the chart above, it appears to have finally bottomed back in late October of last year. It has been building a nice sideways base ever since then. Note the nice breakout in the stock on Friday.
BestStocksNowApp.com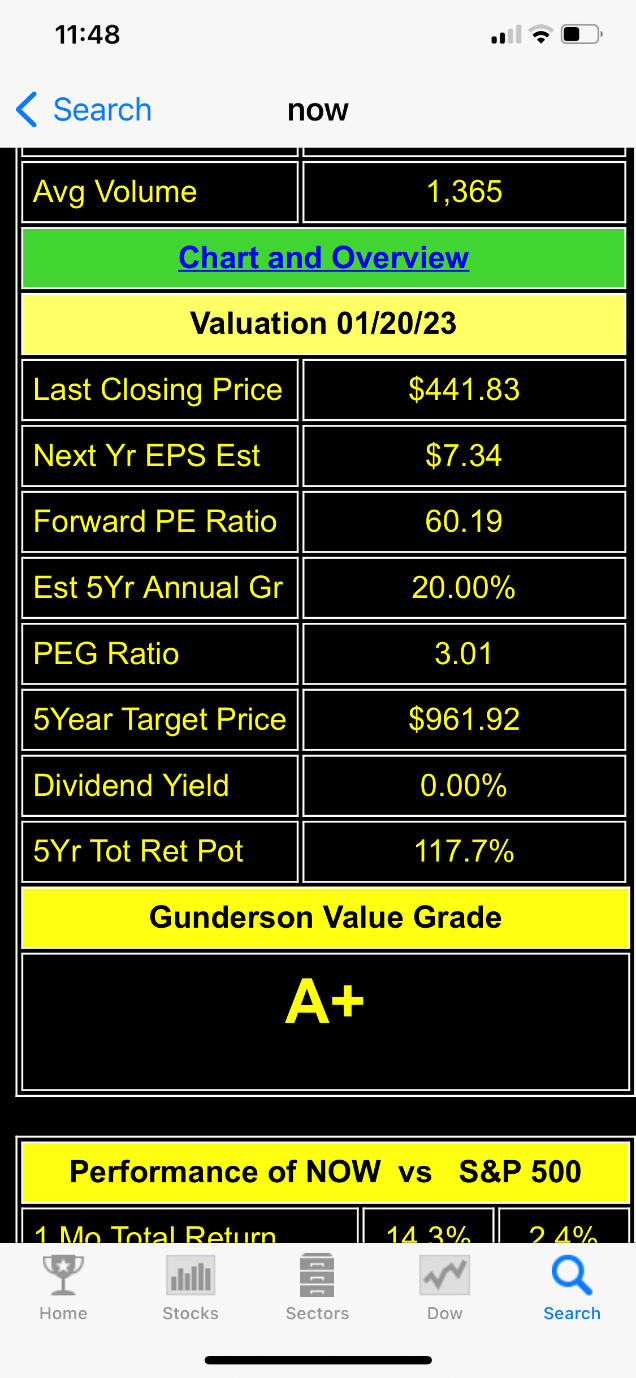
When we apply our valuation formula that I described earlier in this article, we come up with a five-year target price of $961.92. This is based on $7.34 in earnings this year and an average annual growth rate of 20% per year over the next five years.
www.BestStocksNowApp.com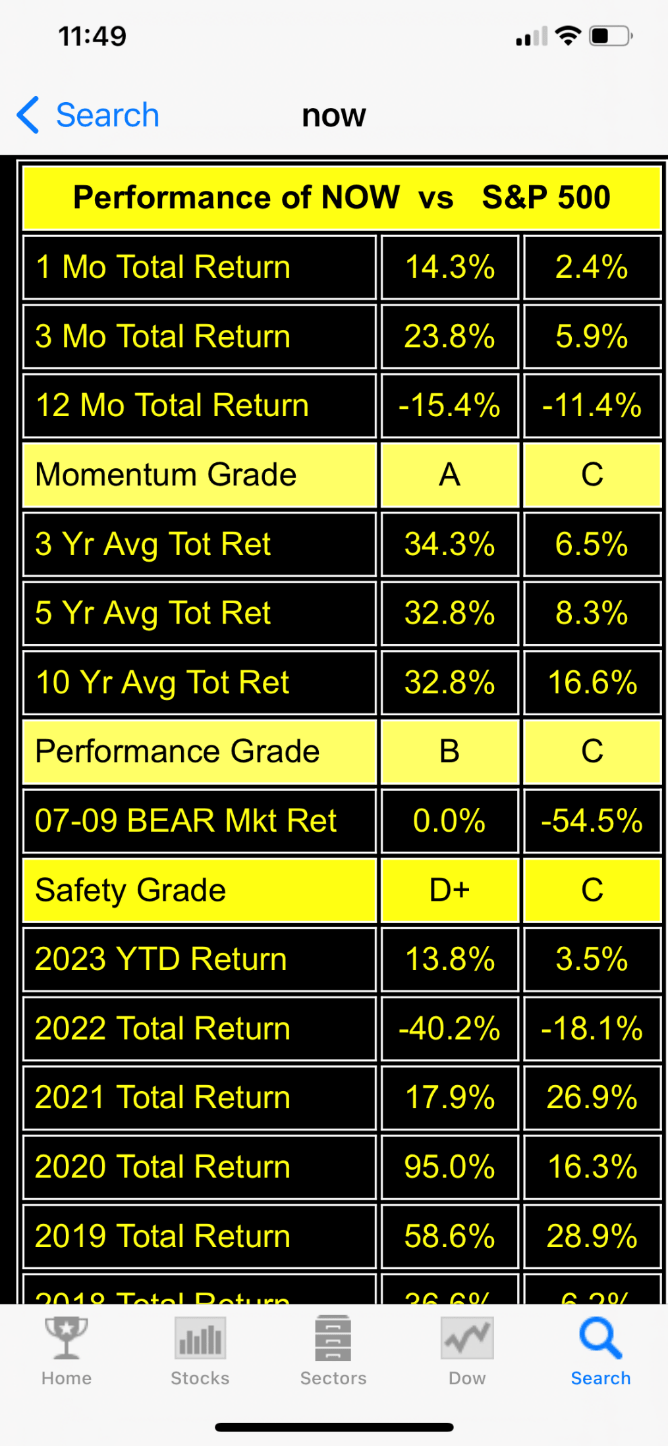
I’m not a value investor or a momentum investor, I’m both. I like to have at least 80% upside potential in a stock over the next five years, and a stock that has delivered alpha over the years, or is well positioned to do so in the future. A pure value investor pays no attention to momentum, and a pure momentum investor pays no attention to value. I think that they are both important. Notice the alpha that NOW has delivered over the years.
I developed a proprietary grading system of over 6,000 stocks, mutual funds, and ETFs many years ago that I use exclusively in making my macro decisions, and in making my individual selections. I also make this tool available to my premium subscribers along with all of the buys and sells that I make daily in real-time.
www.BestStocksNowApp.com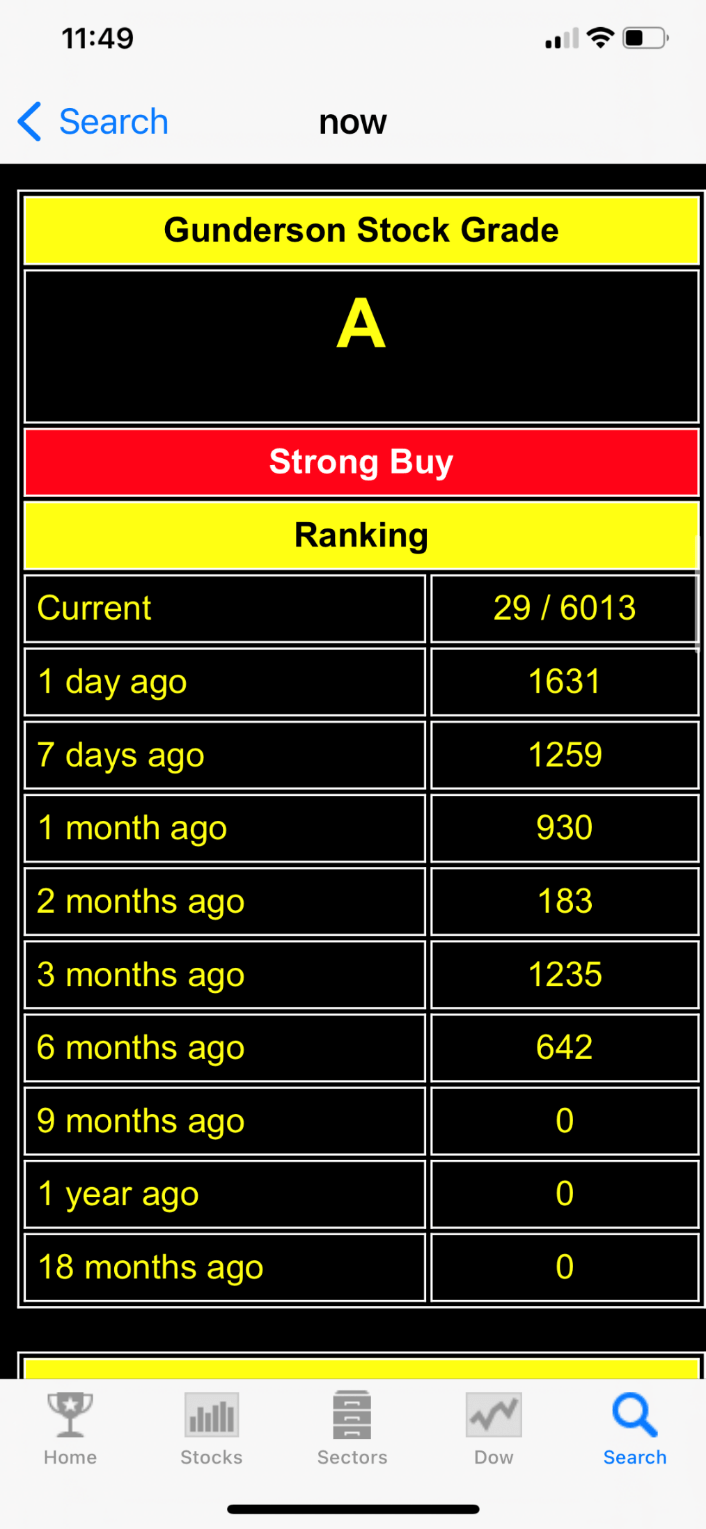
ServiceNow is currently ranked at #29 overall (out of 6,013) in this database and has a Strong Buy rating.
In conclusion, it appears that the risk of the shrinking multiples in the market and in stocks has now diminished. It’s also obvious that the market is now more comfortable with getting back into growth stocks.
That does not mean that there are not a lot of risks that remain, however. Inflation could remain stubborn, the economy could go into a recession, or global events could continue to worsen. But for now, we are slowly working our way back into some good growth stocks.
Be the first to comment