


Khanchit Khirisutchalual
Written by Nick Ackerman, co-produced by Stanford Chemist. This article was originally published to members of the CEF/ETF Income Laboratory on July 10th, 2022.
Thornburg Income Builder Opportunities Trust (NASDAQ:TBLD) is coming up on its one-year anniversary on the market. It’s certainly been a challenging time for the new fund. To me, there doesn’t appear to be anything fundamentally wrong with the fund besides what is happening more broadly with the markets selling off. The sell-off in equities and bonds across the board has impacted the fund, dragging it lower.
Generally, we’ve seen the discounts widen out fairly meaningfully on new funds. That has happened with TBLD. This seems to be another normal function of the closed-end fund market. Even when TBLD’s NAV was rising initially, the price was falling anyway. This was accelerated when the markets began to sell-off.
CEFs generally start to have their discounts widen out during times of volatility and uncertainty. Combining that with 2021’s historically narrow CEF discounts, the result was seeing most CEFs have discounts that widen out.
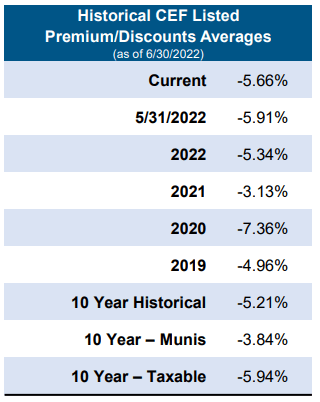
CEF Discount Average (XA Investments)
At this time, TBLD seems like a fairly interesting fund worth investing in. The declines and the discount have made the fund more attractive. TBLD will rely on capital gains to fund its distribution like most equity and hybrid funds. We could see them have to cut the distribution with a lack of capital gains over a while. That being said, the 8.54% distribution yield with a monthly payout is attractive.
The Basics
- 1-Year Z-score: N/A
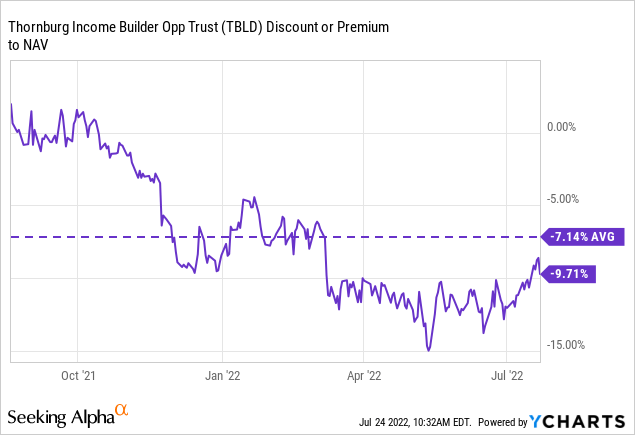
- Discount: 9.71%
- Distribution Yield: 8.30%
- Expense Ratio: 1.68%
- Leverage: N/A
- Managed Assets: $579.7 million
- Structure: Term (anticipated liquidation date August 2nd, 2033)
TBLD’s investment objective is “to provide current income and additional total return.” To achieve this, the fund will invest “in a broad range of income-producing securities to include both equity and debt securities of companies located in the U.S. and around the globe. The Trust additionally expects to employ an options strategy to generate current income from options premiums and to improve risk-adjusted returns.”
This leaves the fund entirely flexible to invest in just about anything income-related. 80% of the fund will be invested in income-producing securities “directly or indirectly.” They aren’t restricted to a certain market cap to invest in a company either but lean heavily in large-caps. At this time, those make up 99.7% of the portfolio. Up to 20% of the fund could be invested in emerging markets.
They then mention that the global equity allocation should vary between 50-90% – leaving the debt allocation with the remainder of the portfolio. The fund will typically be more tilted towards equity positions, given the general weightings. The options strategy “will be approximately 10% to 40%” of the notional value of the portfolio.
The fund has a limited term, which they anticipate liquidating at the end of 12 years. They may extend this termination for up to a year. Then for up to an additional six months, which is the fairly standard language for CEFs. A market sell-off such as we are in now will give them the flexibility to wait for a rebound before liquidating.
In addition, the fund may potentially conduct a tender offer to switch to a perpetual fund. The way this would work is they’d offer to repurchase 100% of outstanding shares at 100% of NAV. Meaning investors can cash out at NAV, just as intended with the termination date. However, the Board may switch to a perpetual structure if the fund still has $100 million in net assets after the tender offer.
This is also fairly standard language for CEFs that are launching now. The bit of difference here is the remaining net asset amount. Sometimes it’s the $100 million, or for larger sponsors, they put the threshold at $200 million.
No leverage on this fund could be a selling point for risk-averse investors. It should be less volatile and have reduced risk compared to leveraged peers. Of course, it’s still a CEF, so the discount/premium mechanic will make it more volatile relative to an ETF.
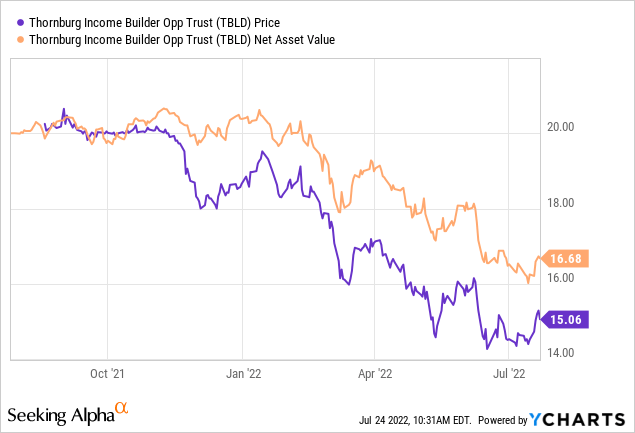
Performance – Attractive Discount
As mentioned above, since the fund’s launch, the discount has widened. Initially, it was the result of the NAV rising while the share price hadn’t really moved.
TBLD raised a fairly large amount by CEF standards, but I’m not aware of any other CEF they offer. In fact, I hadn’t heard of the name until I saw this CEF launch. That said, they aren’t any sort of new operation; they go back to the 1980s. They offer many different traditional mutual funds and managed accounts. Still, being a more recent name in the CEF space and a relatively smaller player in the asset space means they aren’t likely to get a lot of attention from most investors.
That’s where these sorts of opportunities can generally present themselves for investors. Those that can dig a bit more in the CEF weeds can find these hidden gems.
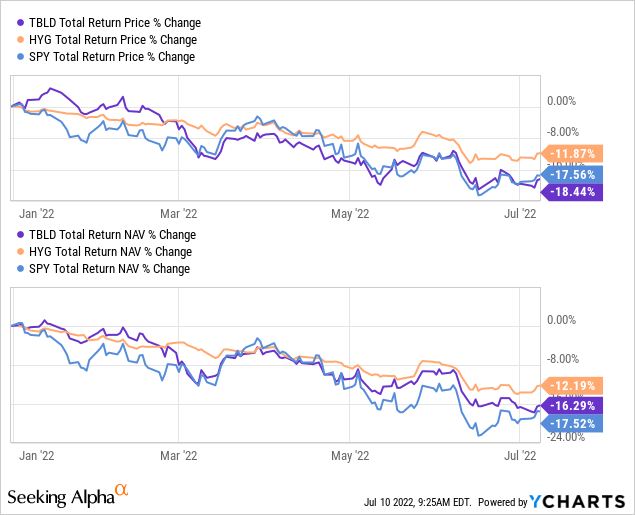
Here is a look at the YTD performance of the fund. For context, I’ve also included the iShares iBoxx $ High Yield Corporate Bond ETF (HYG) and SPDR S&P 500 ETF (SPY). These aren’t necessarily direct benchmarks but can give us a general sense of where TBLD is performing. I used HYG since most of the fixed-income sleeve of the fund is below-investment-grade bonds.
Ycharts
They use a blend of 75% MSCI World Index and 25% Bloomberg U.S. Aggregate Bond Index for their benchmark.
We can see that TBLD has simply been following a similar trajectory to the rest of the investment space. The difference is the fund’s discount has expanded. This is quite attractive at this time. If one believes that we see the markets rebound someday – I suspect we will.
Distribution – Monthly Pay
The fund launched with a monthly payout of $0.10417. I’m not sure how they arrived at that very odd amount, but they’ve paid out a total of $1.14587 at this time. The current distribution yield comes to 8.30% and, on a NAV basis, comes out to 7.47%.
To cover that distribution, the fund has net investment income coverage of 44.8% over the last six months. The remainder would require capital gains in order to “cover” the distribution. For CEFs, they can generally pay whatever they want, for however long they want to pay it. That is until the NAV goes to $0.
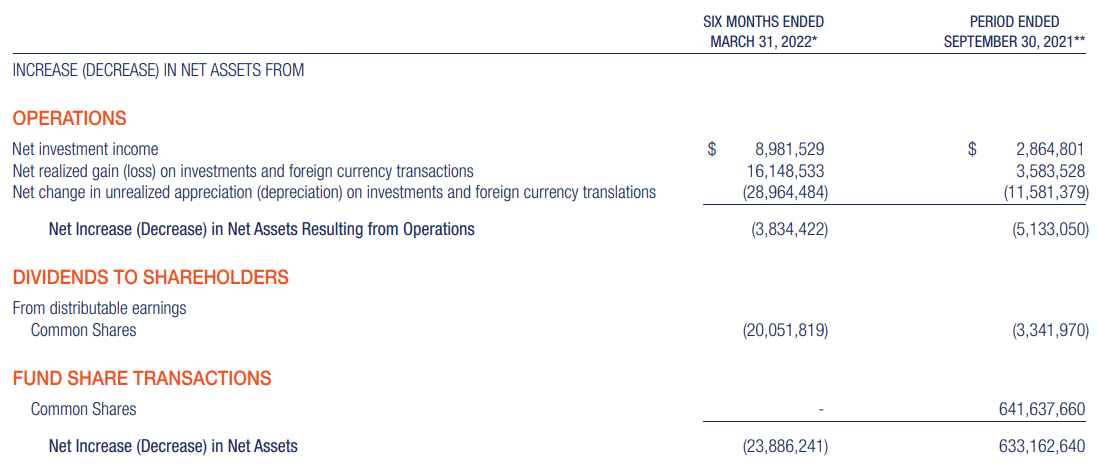
TBLD Semi-Annual Report (Thornburg)
Since they have a strong tilt towards income-producing investments, we can see that their NII coverage is actually quite strong. For other equity funds, it isn’t uncommon to see significantly lower NII coverage. If a fund is tilted heavier into tech allocations, it actually isn’t uncommon to see 0% NII coverage. TBLD tilts a bit towards a heavier tech allocation, but not significantly so.
TBLD’s Portfolio
I’m quite impressed with the significant number of stats Thornburg provides. The fund is invested in 211 positions. They go on to share the average market cap, the P/E, the P/CF, and many other metrics for the portfolio. It is all quite impressive and would be excellent if other sponsors provided similar metrics. The data is as of May 31st, 2022.
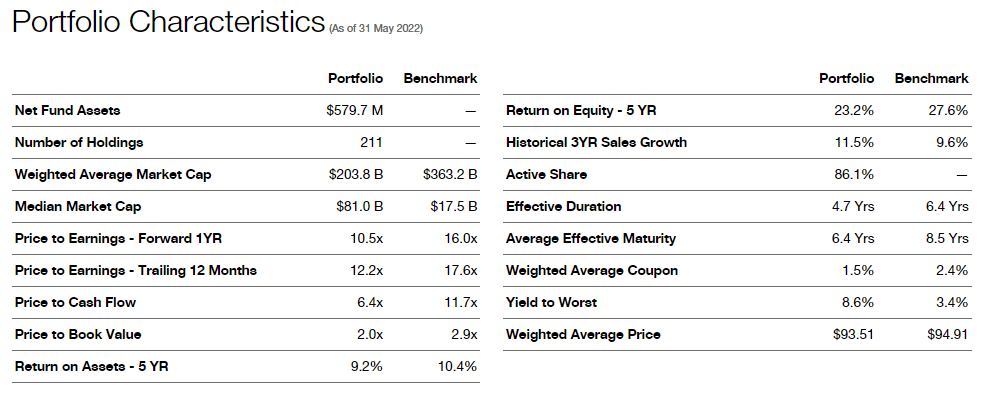
TBLD Portfolio Stats (Thornburg)
As we can see, the P/E of the portfolio they are invested in is a more value-oriented portfolio. I would say another key metric at this time is the effective duration. 4.7 years is quite significant, but that’s going to be reflecting the fixed-income sleeve of the portfolio. That is the smaller allocation of the pie, with equity long being the more significant slice.
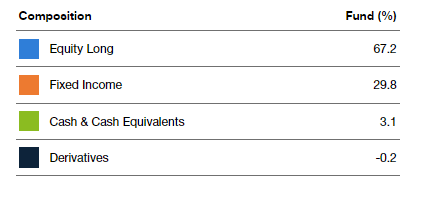
TBLD Asset Allocation (Thornburg)
When looking at the sector allocation of the fund, we can see that tech makes up the largest weighting. It isn’t an overly significant amount, and financials and healthcare follow it. Both of these would be considered value sectors, which can help explain why the P/E is lower relative to their benchmark.
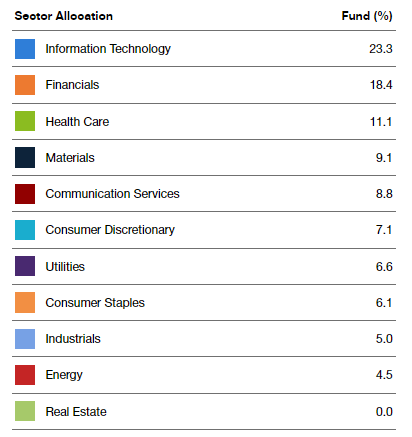
TBLD Sector Allocation (Thornburg)
Looking at the top ten, I’m surprised by some of the positions we see. Most of them are not what you would find in other CEF portfolios, at least not in the top ten positions. I believe that makes it a better candidate for an investor if they want to diversify or not have to worry about adding too much exposure to one area. The top ten make up 20.7% of the portfolio’s investments.
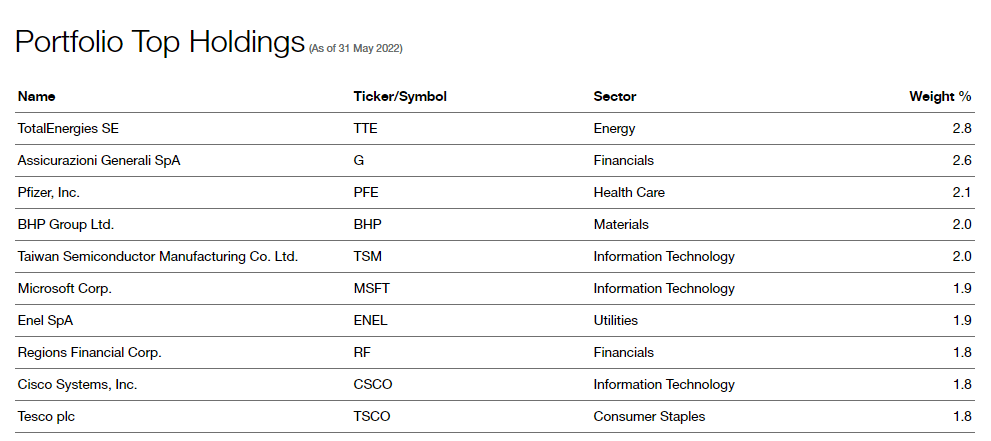
TBLD Top Ten (Thornburg)
Microsoft (MSFT) is a fairly common position, but it’s one of the only ones that we regularly see in CEFs. Pfizer (PFE) is also a well-recognized name but doesn’t make its way into the top ten of other funds often. Then there is Enel (OTCPK:ENLAY). This one is common but only amongst global infrastructure funds.
The rest of the names here are just not names that I regularly see in large allocations for other CEFs. The global tilt is also something that I’m hoping to gain more exposure to as they remain undervalued relative to U.S. positions.
Conclusion
TBLD launched midway through 2021. The fund enjoyed some appreciation on a NAV basis, but its share price never got too much attention. Then the whole market began to slide lower. To me, there isn’t specifically something wrong with TBLD, but it’s simply a victim of the broader market actions. I think the fund’s current discount and highly diversified portfolio could make a great fit for an income investor’s portfolio. This hybrid fund is quite flexible to invest just about wherever, whenever they want.
Be the first to comment