

Sohl/E+ via Getty Images
By Jean Boivin, Elga Bartsch, and BlackRock
We believe the drive for energy security will increase inflation and hurt growth in the short term. Greater supply of U.S. and other non-Russian fossil fuels will be needed. Further out, this should reinforce the net-zero transition in Europe yet make its pace more divergent across the world.
Summary
• Russia’s invasion of Ukraine is exacting a horrific human toll. In response, nations and governments across the world have come together to sever financial and business ties with Russia. In a drive for energy security, the West is seeking to wean itself off Russian oil and gas – this presents a fresh supply shock in a world that was already shaped by supply. It will make inflation more persistent, slow growth, and stoke demand for non-Russian fossil fuels in the short term.
• The scale of the impact depends on the speed at which the West reduces its imports of Russian energy. Our base-case scenario is a determined reduction as the West and Russia enter a protracted standoff. The reduction could happen more quickly if the conflict escalates. An easing of tensions could slow the process but is unlikely to stop it.
• In the U.S., the energy shock under a protracted standoff scenario is still less than half the 1970s oil supply shock. It will hit consumers and firms, but the economic impact will be smaller than in the past given greater energy efficiency and the U.S. now being a net primary energy exporter. With strong underlying growth momentum prior to the shock because of activity restarting from the pandemic shutdowns, we see growth staying above trend.
• In Europe, outright stagflation is a more serious risk, given its reliance on Russia for roughly 40% of its gas supplies. We estimate our baseline scenario could add 1-1.5 percentage points to euro area inflation and shave up to 3 percentage points off growth – and even more if energy prices return to their mid-March highs.
• We think the risk of inflation expectations de-anchoring – and central banks being forced to slam on the policy brakes in response – has risen. If higher inflation starts to be seen as the rule, central banks may be forced into costly destruction of demand by raising rates past their neutral point and into restrictive territory.
• Reducing reliance on Russian fossil fuels will mean Europe is dependent on greater output elsewhere in the short term, especially of natural gas. The supply of renewable energy can’t be ramped up quickly enough in response. Even with energy conservation measures and a delay to phasing out nuclear power, supply needs to come from the U.S. and elsewhere. This increase should be seen against the effective stranding of Russian fossil fuel productive capacity. We will see a shift in where fossil fuels are produced, not an increase in global demand.
• As with any big shock, a key question is what it means in the long term – for example, for the transition to net-zero carbon emissions that was already in train. This shock will probably reinforce the net-zero transition in Europe. In our base case, the share of EU GDP spent on energy would be the highest since the 1980s. For consumers, the energy shock is like a carbon tax, making renewables even more competitive. European budget deficits will likely widen to shield the impact of higher prices and help finance the transition.
• The U.S. won’t feel the same push as Europe: it is a net primary energy exporter, will need to increase production to compensate for reduced Russian supply to Europe, and has a lower energy cost burden. A faster shift in Europe could reduce global demand for fossil fuels and jumpstart technological innovation. Yet this shock probably means a more divergent transition pace globally.
• Traditional energy stocks are doing well in the short term due to a greater need for additional non-Russian supplies and higher prices. But the transition’s momentum means renewable energy is performing well at the same time. We see companies leaning more heavily into the energy transition to outperform in the medium term as economies rewire and the tectonic shift of investor preferences to sustainable investing keeps playing out.
A new shock to supply
We had already seen supply constraints driving high inflation over the past year, fundamentally changing how we should think about the macro environment and market implications. The pandemic resulted in a huge switch in consumer spending in the U.S., away from services and towards goods. This pushed up goods prices, resulting in higher overall inflation, despite activity not being back to its pre-Covid path. We were in a world shaped by supply and expected the supply side to adjust over time – but the nature of the activity restart meant we were far from 1970s stagflation.
We are now seeing a textbook energy supply shock, more like the 1970s, layered on top of the restart. The West is responding to Russia’s invasion of Ukraine by weaning itself off Russian energy. That’s no mean feat: Russia is the world’s third-largest energy producer, accounting for 10% of global oil supply and 17% of global gas supply, according to International Energy Agency (IEA) data as of December 2021. Russia is the EU’s largest supplier of oil, coal, and gas: 27%, 47%, and 41% of imports, respectively, according to Eurostat data. The U.S. and UK are banning Russian oil imports, while the EU has declared an ambitious goal of reducing Russian gas purchases by two-thirds by the end of the year. Germany has announced its intention to all but eliminate reliance on Russian gas supply by mid-2024 and become virtually independent of Russian oil by the end of this year. Russian energy production cannot be diverted elsewhere overnight, so the global energy supply is effectively being reduced, driving huge energy price spikes. Gas prices have spiked in Europe given the region’s high dependence on Russia. See the chart.
We believe the switch away from Russian energy will raise inflation and dampen growth in the short term, while creating the need for a greater supply of non-Russian fossil fuels. On a longer time horizon, we also think it will reinforce the net-zero transition in Europe but make it more divergent globally. The extent of the impact in both cases depends on the speed at which the West reduces its imports of Russian energy. We see three broad possible scenarios:
1) Our base case: a protracted standoff
We see a protracted standoff between Russia and the West, with tensions remaining high. Europe follows a determined path to significantly reduce its reliance on Russian energy by the end of the year. Oil prices settle at around $100-130 and European gas prices at €100-115 per megawatt-hour (equivalent to around $190-220 per barrel of oil).
2) Easing of tensions
Some form of agreement is reached between Russia and Ukraine. This might slow the speed at which the West reduces Russian imports, but does not stop it in our view. Energy prices return to close to December 2021 levels, with oil prices below $100.
3) Massive supply disruption
The cut in Russian imports is much sharper – either due to the conflict escalating and Europe looking to cut all imports of gas even more quickly or Russia disrupting supply. Energy prices surge to mid-March peaks or beyond.
Energy supply shock
U.S. and European energy prices, 2021-2022
The lines show the changes in the price of different commodities since July 1, 2021. European natural gas price based on European Energy Derivatives Exchange futures, the U.S. based on MYM-Henry Hub Gas futures price. Oil price based on ICE-Brent crude futures (BlackRock Investment Institute, with data from Refinitiv Datastream, March 2022)
No 1970s repeat in the U.S.
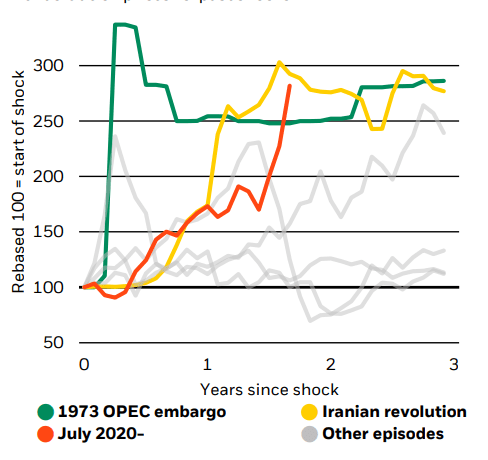
Since mid-2020, oil prices have risen by about as much as they did in the 1973 oil shock. Yet most of the increase in 2021 was due to the resurgence of economic activity in the restart, rather than a cause of weak growth. By contrast, the jump in prices this year reflects the supply shock in global energy markets as the West seeks greater energy security and Russian energy routes are forced to shift. See the charts below. That is stagflationary: it will increase inflation and slow growth. But by how much?
In our base-case scenario of a protracted standoff between Russia and the West, we estimate that U.S. inflation would increase by around 1 percentage point and growth would be 0.5 percentage points lower – though with much uncertainty on those estimates. This hit to growth is smaller than typically seen after past shocks. Why? First, U.S. industrial production is much less energy-intensive than it was in the past. Second, U.S. oil production has risen so much that the country only imports a fraction of its crude oil needs compared with the past. This means the terms-of-trade shock from a rise in oil prices – whereby imports become more expensive relative to exports, in turn weighing on incomes and consumption – is far smaller.
So though this is a stagflationary shock for the U.S., we do not believe it threatens outright stagflation – defined as zero or negative real growth for an extended period of time. The post-pandemic restart is not yet complete, and growth prior to the invasion was expected to be far above trend. We think it will remain above trend even as the impact of the energy shock takes hold. Yet higher inflation adds to the dilemma that the Federal Reserve was already facing. We think the Fed will choose to live with this higher inflation. Its economic projections are consistent with that: it revised up its inflation projection out to 2024. But it sees the unemployment rate staying around 3.5% and growth remaining above trend, suggesting it does not intend to destroy demand – and employment – to bring inflation down.
At the same time, the Fed – like other central banks – wants to ensure it is not continuing to stimulate activity. We see the Fed and other central banks moving to normalize policy quickly. The Fed has signaled it will do so over the course of this year – and the six further rate hikes it has penciled in for this year would be consistent with this.
Yet the Fed has also signaled that it may need to go beyond its current estimate of neutral policy rates – the point at which they are neither stimulating nor restricting the economy. For the moment we think this is tough talk. Supply-driven inflation can be dampened only at a high cost to growth, which the Fed hasn’t shown an intention to tolerate. But the risk has grown that the Fed does slam on the policy brakes. As we discuss later, it might become necessary if inflation expectations keep drifting up amid an outlook of even longer-lasting high inflation.
A new oil price shock…
Brent crude oil prices vs. past shocks
…driven by supply disruptions
Breakdown of U.S. crude oil price drivers, 2021-22
The chart shows the evolution of Brent oil prices over historical episodes of shocks to energy, as defined by Hamilton (2011), ‘Historical oil shocks’, NBER. Data are monthly and assume that the latest daily price is projected forward for the remainder of the month to calculate the current monthly average (BlackRock Investment Institute, with data from Refinitiv Datastream, March 2022)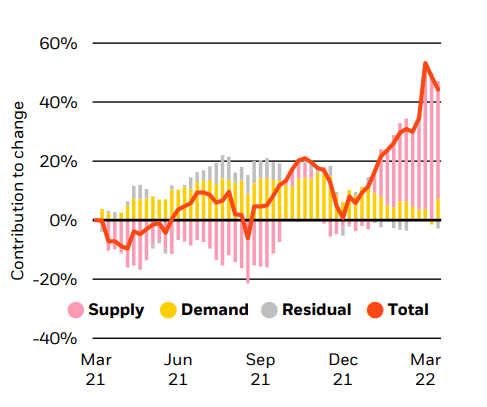
Europe at risk of stagflation
The picture looks more severe in Europe. The energy shock under our protracted standoff scenario would be more serious than implied by oil prices alone because of the sharp rise in European natural gas prices. See the left-hand chart below. Europe’s reliance on Russian gas for roughly 40% of its supply would make the gas price shock much larger than a typical oil shock – and the share of GDP it would have to spend on energy would be the highest since the 1980s.
This scenario would see inflation boosted sharply – we think by around 1-1.5 percentage points. But it would also hit activity hard. The European Central Bank (ECB) has revised up its inflation forecasts but has not factored in a major hit to growth. Yet we think it could shave up to 3 percentage points off growth. We see this substantial hit to growth coming through four main channels: 1) a squeeze on real incomes from higher energy prices, with consumers spending less on other things; 2) reduced confidence and greater uncertainty about the economic outlook further reducing spending and corporate investment; 3) renewed disruptions to supply chains as non-energy imports from Ukraine and Russia are restricted or disrupted; 4) financial stress and higher financing costs for firms, households and governments.
Such a hit to the euro area would ripple out to the global economy given Europe’s substantial international trade links. We believe the impact could be even more severe under the supply disruption scenario: a January 2022 ECB study suggests a 10% reduction in gas supplies could reduce GDP by 0.7 percentage points. If Russian gas were no longer available to the EU in 2022/23 winter and no ready substitute available, the direct impact on GDP could be just under 3% of GDP – on top of the existing estimated hit, clearly pushing the euro area into recession.
Like other central banks, the ECB had shifted its outlook towards policy normalization. The ECB was close to achieving its new symmetric inflation objective on a sustainable basis – as acknowledged by President Christine Lagarde this month. The euro area labor market no longer has slack to be eroded, and the restart of activity doesn’t need stimulus to complete. Before this shock, that might have meant the ECB ending bond purchases and taking rates out of the negative territory. But the shock may do some of the ECB’s work for it by weighing on activity. That means getting to a neutral setting for policy rates might imply doing very little with rates for now. The ECB gave itself some flexibility on starting rate normalization at its March policy meeting. Yet the market is pricing in repeated hikes. See the chart below right.
Even if the ECB doesn’t raise rates much, its ability to further offset the shock is limited, especially with inflation so high. This leaves fiscal policy as the possible cushion. Such a step would be consistent with what we’ve called the policy revolution of more explicit monetary and fiscal coordination to provide a bridge through the pandemic. With central banks in a bind, fiscal policy may play a more active role in stabilizing demand. National measures announced so far have been modest in scale. On balance, we’re likely to see wider budget deficits and additional commitments to defense spending and humanitarian relief. A bigger impact could come on an EU level if there were another joint response similar to the SURE program to preserve jobs during the pandemic and the NextGenEU fund. But despite some tentative signs in recent meetings of EU leaders, concrete proposals are still lacking. Existing spending plans and a flexible interpretation of the Stability and Growth Pact provides governments with extra fiscal space for 2023.
A large shock to Europe
European natural gas prices vs. past shocks
Forward-looking estimates may not come to pass. The chart shows the 3-year average annualized inflation rates for headline U.S. PCE inflation (yellow) and core PCE inflation (orange). Future values are derived from Bloomberg consensus forecasts up to Q3 2022, and thereafter from Federal Reserve projections published in the March 2022 FOMC Summary of Economic Projections (BlackRock Investment Institute, U.S. Bureau of Economic Analysis, Bloomberg, Federal Reserve Board, with data from Haver Analytics, March 2022)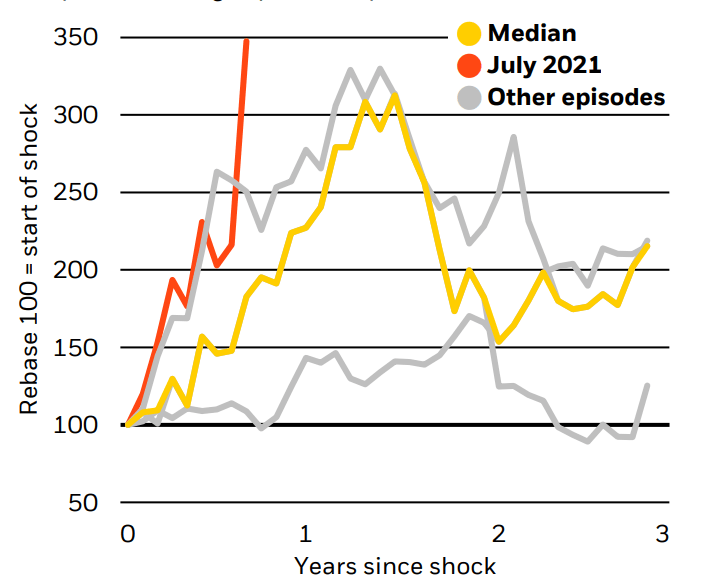
Unrealistically hawkish
U.S. fed funds, market pricing & Fed forecast, 2015-2025
The chart shows the historical fed funds rate, current market pricing in forward overnight index swaps and the Fed’s March 2022 projection based on the median dot of policymaker projections. The final green dot represents the Fed’s long-term policy rate expectation (BlackRock Investment Institute, with data from Refinitiv Datastream, March 2022)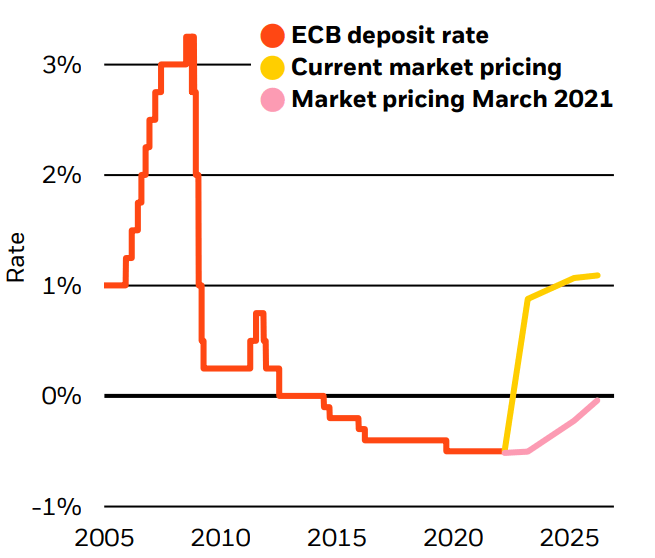
Fossil fuel demand shift
As well as shaping the macro picture, the drive for energy security will clearly reshape energy demand and supply. Europe will have an acute need for more fossil fuels from outside Russia to meet its energy demands and achieve its ambitious plans to reduce its reliance on Russia. We expect production elsewhere to be ramped up. But global oil, natural gas, and coal markets will likely remain tight in our base case scenario – and Europe’s energy cost burden will remain highly elevated.
The determined move away from Russian natural gas in our base case scenario reflects efforts toward the REPowerEU plan proposed by the European Commission to reduce reliance on Russian gas by two-thirds (100 billion cubic meters) by the end of the year. The IEA released a similar plan for Europe. As the chart below shows, both assume that the EU can implement some energy conservation measures, including building retrofits (heat pumps and efficiency improvements), driving savings of around 15 bcm. And both assume that existing sources of piped gas can be maximized (such as from Azerbaijan, Algeria, and Norway), increasing supply by 10 bcm.
Although the EU plan calls for massive deployment of new renewable power (20 bcm), the IEA views this as optimistic in the timeframe. It estimates that delaying the phase-out of four European nuclear reactors set to close in 2022 is needed to make the same reduction in natural gas demand. There are signs that delaying nuclear phase-out in Europe is on the table, and Belgium recently postponed its phase-out. But even if it proves possible, Europe will still face a shortfall of around 70 bcm of gas over the year to achieve its target. The EU will need fossil fuel suppliers outside Russia to increase production to meet its needs.
Greater imports of liquefied natural gas (LNG) (such as from Qatar, U.S., Australia, and West Africa) will be needed. LNG markets were already tight before the conflict, and Europe will be bidding against others for the available supply – a trigger for the spike in gas prices last year. The ongoing tightness in LNG markets through the year should incentivize producers to expand supply where possible. The U.S. has committed to increase LNG supplies to Europe by 15 bcm but it will be difficult to do this quickly. Even if supply can be boosted quickly, Europe will also need to invest in LNG import capacity, which had already been running at 95% usage – and that will take time. It is also unclear whether adding further long-lived LNG terminals can be consistent with the EU’s aggressive climate goals unless they can later be retrofitted to accept hydrogen.
To offset a majority of Russian gas imports, a switch of some gas power generators to coal burning would be needed, according to the IEA. Though absent from the EU’s plan, some switching may be unavoidable – the question is the scale. Russia is the EU’s top supplier of coal, complicating this shift. In oil markets, countries with spare capacity and the ability to drill more wells will need to quickly ramp up production – U.S. shale, in particular. In principle, U.S. Permian shale output could expand to replace European imports of Russian oil. But that will face some obstacles. We find that the U.S. rig count would need to more than double if it were to fill Europe’s gap of imports from Russia. And pipeline, raw material, and labor shortages could delay new shale development. So while we see production ramping up amid high prices, oil markets will continue to remain tight.
Reducing imports of Russian gas
Comparison of IEA and EU assessments of measures to reduce Russian natural gas usage
The chart shows the estimated contribution various measures can make in reducing EU imports of Russian gas. The left bar shows the IEA assessment released in its 10-Point Plan. The right bar shows the European Commission’s assessment under its proposed REPowerEU plan (BlackRock Sustainable Investing, International Energy Agency and European Commission, March 2022)
A more divergent transition
We will see higher fossil fuel output outside Russia and sustained high energy prices. We could also see carbon emissions edge up as the EU burns more coal and oil to make up for less Russian gas. But this isn’t a sign that the transition to clean energy is being derailed, in our view. The world needs fossil fuels to meet current energy demands given the way economies are wired today. What is ultimately key is the total demand for fossil fuels, not where they’re produced. The increase in non-Russian supply must be viewed against Russian production assets becoming effectively stranded. We are set to see a shift in where fossil fuels are produced, not a surge in the total amount of fossil fuels consumed.
The drive in Europe for greater energy security should spur the development of clean energy. Tight fossil fuel markets, with sustained high prices, act like a carbon tax on consumers. Europe is now spending about 9% of its GDP on energy – the highest share since 1981. See the chart below left. And the green energy premium – the extra typically paid for choosing renewables over traditional energy – has been eroded. Even before the shock drove up fuel prices to record highs, the cost of wind and solar energy had reached parity with existing coal and gas-fired power and was far below the cost of fossil fuel power generated by building new infrastructure, according to a Lazard analysis from October 2021. Now that fuel prices are even higher, renewables have become even more competitive despite higher steel, aluminum, polysilicon and copper prices – all materials needed to build renewable power capacity.
This should all spur the energy transition toward renewables and electrification in Europe, in our view. We believe this would be the case across all three scenarios. Yet in the U.S., we don’t expect the same motivation to hasten the transition. The burden of higher energy costs on U.S. consumers – though very real – will be much smaller than for EU consumers: between the start of the year and early March, natural gas prices in the EU rose by three times as much as in the U.S. The share of GDP the U.S. spends on energy is a fraction of that in the EU. Because the U.S. is also a net exporter of primary energy its trade balance will improve if it scales up oil and gas production. Gains for energy companies will offset some of the hit to consumers, meaning that the U.S. will face more difficulty in balancing competing interests. At the same time, geopolitical events may reduce political attention on the energy transition.
What will happen to Russian oil and gas in the longer run? It is unlikely to remain entirely stranded and could find a buyer in China, Southeast Asia or India. Pipeline capacity is already being built to more than double flows of gas from Russia to China to up to 100 bcm per year, although Chinese wariness of Western sanctions may stall such efforts in the near term. This gas would mostly offset coal-fired power, helping the transition somewhat but potentially delaying the shift to cleaner energy sources, such as renewables.
By spurring the transition in Europe but less so elsewhere, the drive for energy security means the transition will now be more divergent. But we think it could be reinforced overall. Markets are reflecting this view: while traditional energy stocks are doing well in the short term due to greater demand for non-Russian output, clean energy stocks are also outperforming global benchmarks. See the chart below right. From an investment perspective, the effective stranding of Russian fossil fuel supply has created investment needs in both traditional energy and renewables.
Spending more on energy
Energy burden as a share of GDP, 1970-2022
The chart shows the cost of oil, gas and coal consumption in the European Union and U.S. as a share of GDP. We use regional energy prices and divide by GDP in U.S. dollars. Data for 2022 are based on IMF’s latest GDP forecasts and the year-to-date average of daily commodities prices (BlackRock Investment Institute and BP Statistical Review of World Energy 2021, with data from Haver Analytics, March 2022)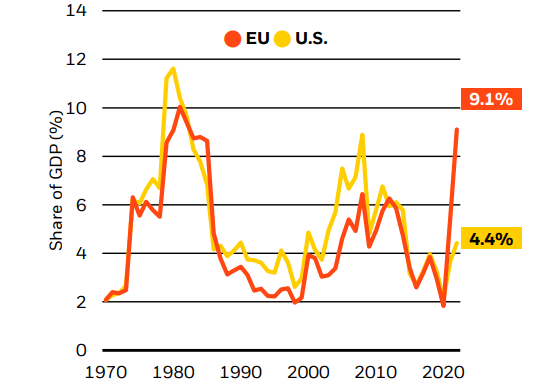
Clean energy stocks still outperforming
Global and clean energy equities total return, 2022
Past performance is no guarantee of future results. The chart shows the total return index for the MSCI World Energy Index, MSCI World Equity Index and S&P Global Clean Energy Index rebased to 100 at the start of January 2022 (BlackRock Investment Institute, with data from Refinitiv Datastream, March 2022)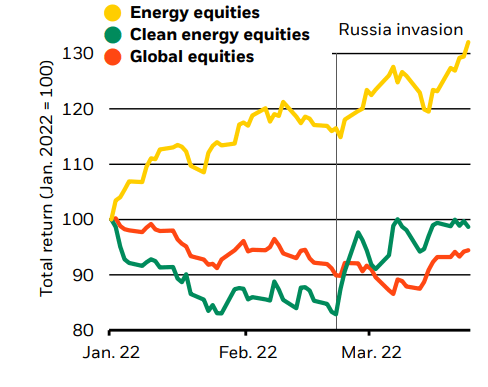
This post originally appeared on the iShares Market Insights
Editor’s Note: The summary bullets for this article were chosen by Seeking Alpha editors.
Be the first to comment