

BING-JHEN HONG/iStock Editorial via Getty Images
Price Action Thesis
We follow up with a detailed price action analysis on Taiwan Semiconductor (NYSE:TSM) stock as there have been significant developments to its price action structure over the past month.
We highlighted in our previous article why we de-rated TSMC stock, emphasizing where we got our thesis wrong. Notably, we didn’t pay necessary attention to its price action and paid the price for several poor calls on TSMC. It had already formed a menacing double top bull trap after its FQ4’21 earnings call. The market had astutely drawn in buyers rapidly in a final flush-up before moving into rapid liquidation.
TSMC stock is likely testing its near-term support. Therefore, investors could see a short-term rally play out at the current levels. However, the rejection of buying momentum at its recently-formed near-term resistance delivered another bull trap. Furthermore, we have not observed a significant bear trap price action that could help stymie its bearish momentum.
Our reverse cash flow valuation analysis suggests that TSMC stock could continue to underperform at the current levels. Some investors have kindly informed us that parsing an opportunity in TSM stock with the free cash flow (FCF) lens may not be appropriate, given the timing of its CapEx intensity. However, we think the market is right in informing us that we should pay attention to its CapEx intensity and not ignore it.
Therefore, we reiterate our Hold rating on TSM stock and urge investors to be patient. We would reassess our rating if we noticed a significant bear trap price action that could help stanch its decline and potentially reverse its bearish bias.
A Massive Double Top Bull Trap Massacred TSMC Stock
TSM price chart (monthly) (TradingView)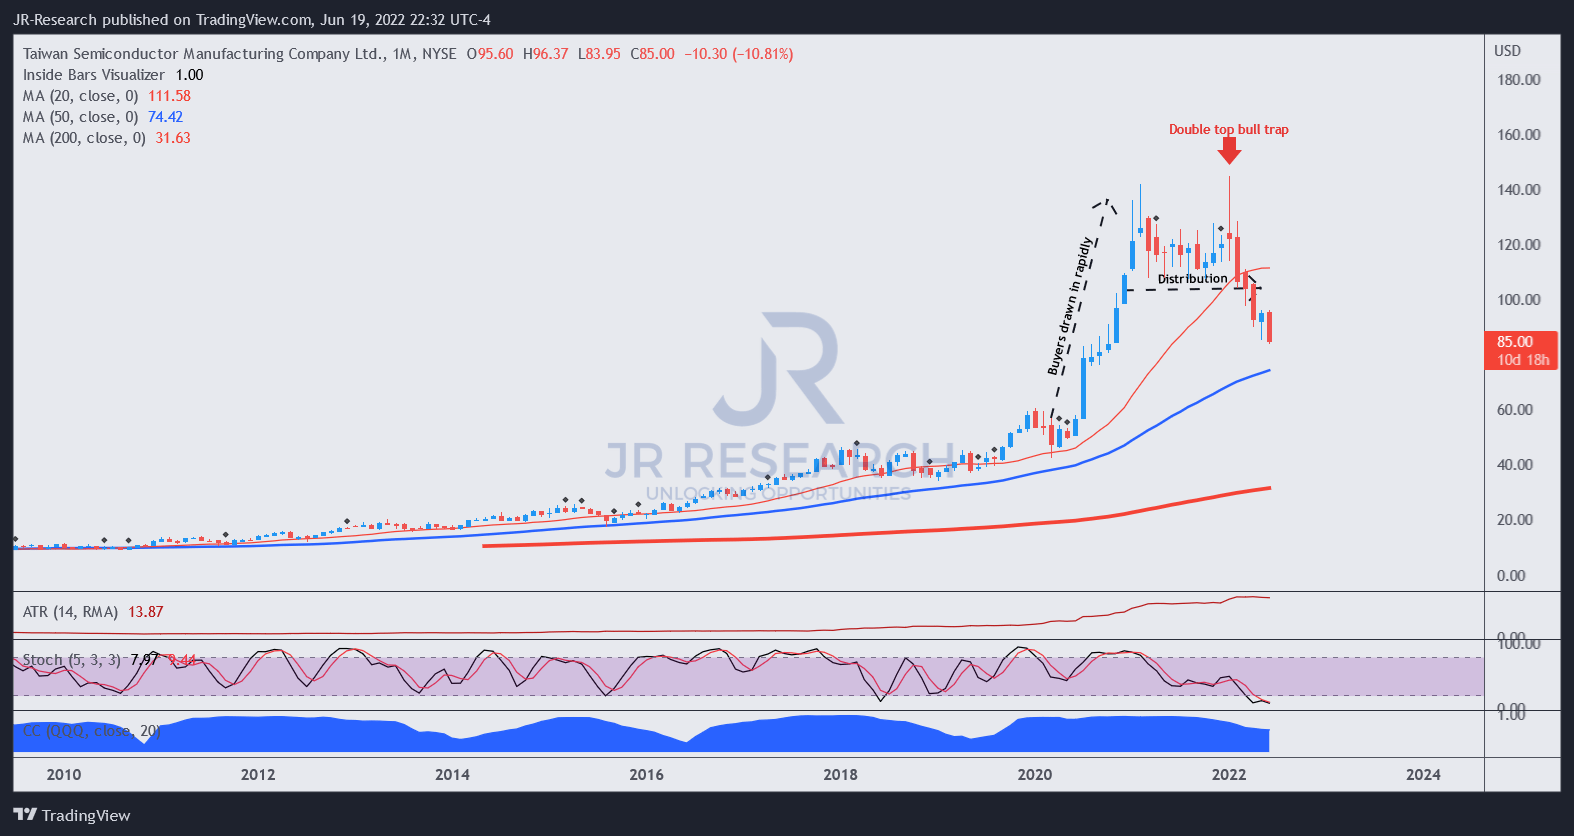
We must admit that we missed the double top bull trap formed in January 2022. The market astutely drew in the final round of buyers after its FQ4’21 earnings call before sending TSMC stock into rapid liquidation subsequently.
Had we paid more attention to its price action, and not just its thesis of “massive growth in 2022 and beyond,” we would have noticed the double top. Therefore, we implore investors to pay attention to price action structures, as they are forward-looking. They give early warning signals of the market’s forward intentions, lending clarity to investing decisions.
Notably, after drawing in buyers rapidly in 2020-21, TSMC stock moved into a distribution phase for one year before the double top bull trap. Therefore, the warning signs: Rapid mark-up bars, distribution, and double top bull trap should have informed astute investors about taking their profit earlier in January.
TSM price chart (weekly) (TradingView)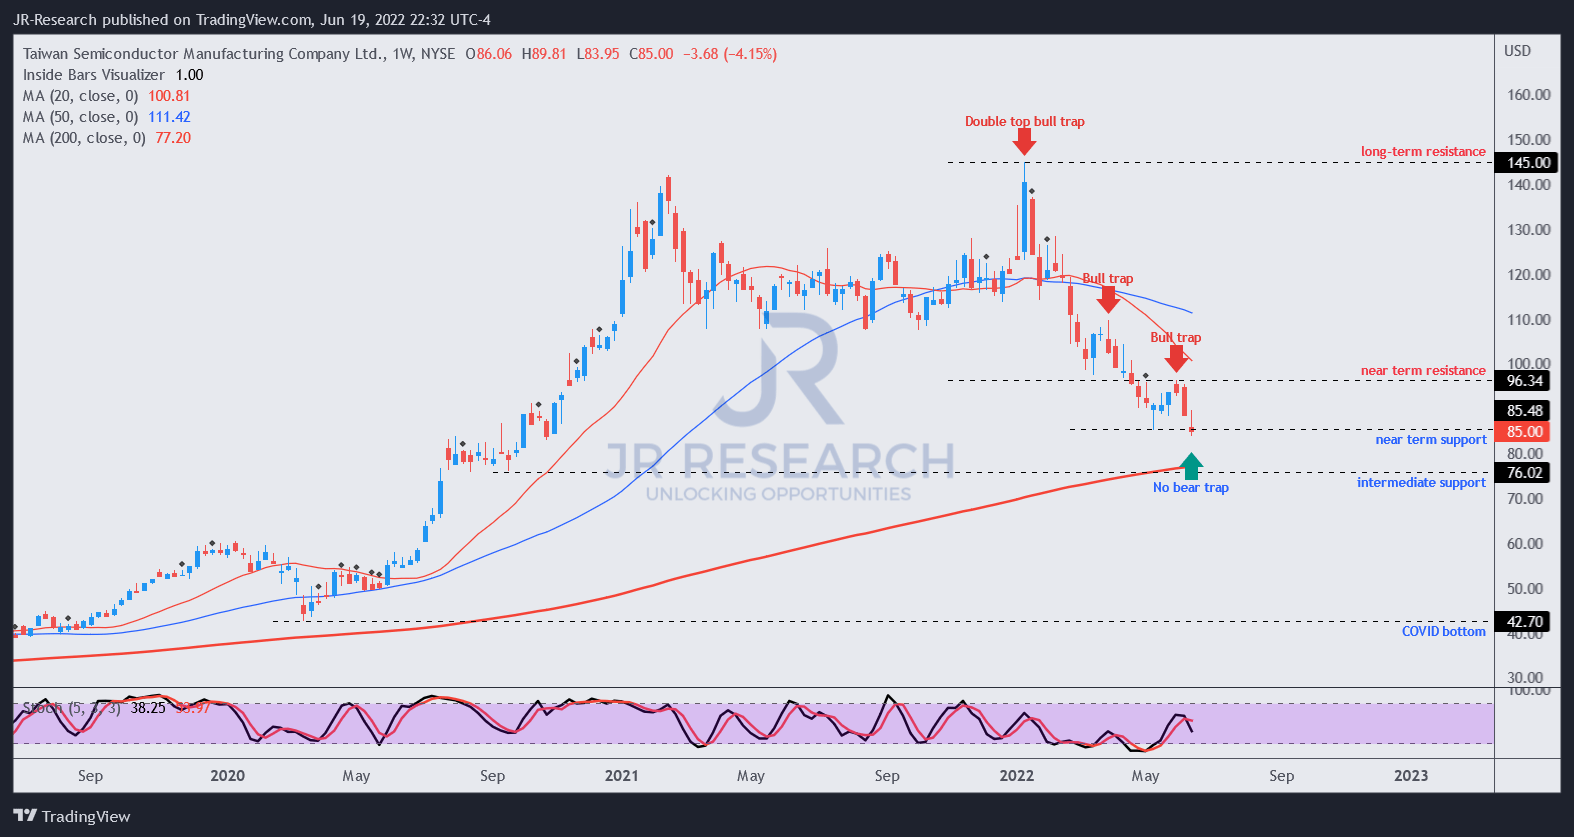
Zooming into its weekly chart, we can glean the structure of its double top. It sent TSMC stock into negative flow (bearish momentum) by the end of February, as the market continued to force rapid liquidation in TSM positions.
Following our previous article, the stock formed another bull trap at the end of May, confirming the market’s intention to reject May’s dip-buying momentum.
Currently, TSM stock is re-testing its near-term support and could very well form a bear trap price action signal. Therefore, investors should watch closely how the price action dynamics evolve at the current level. Notwithstanding, until a bear trap signal has been validated, we believe it’s apt for investors to be patient with TSM stock.
TSM Stock Is Not Undervalued
TSMC revenue change % and FCF margins % consensus estimates (S&P Cap IQ)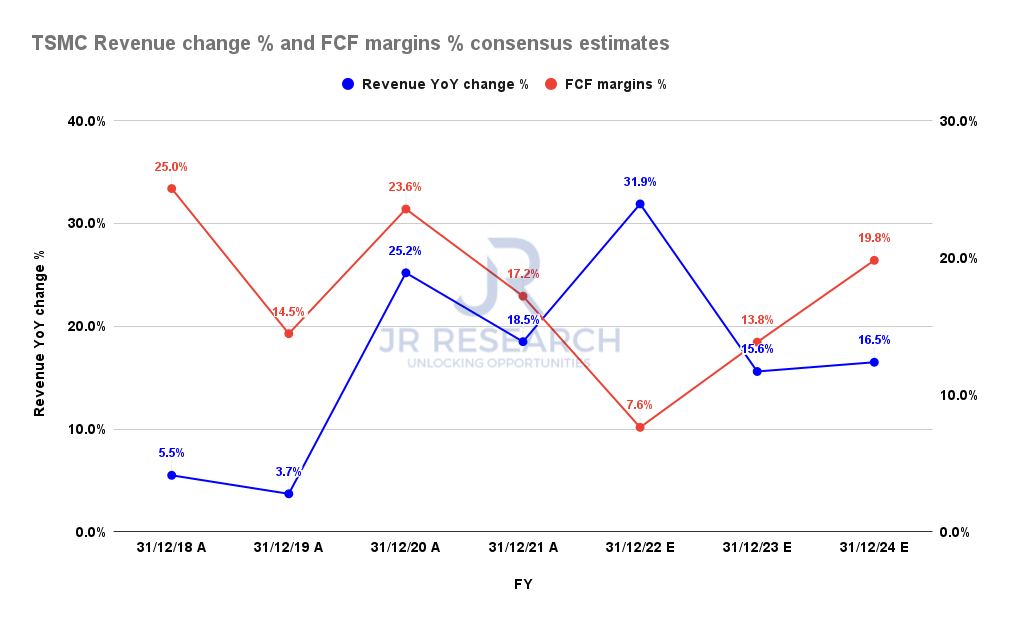
TSMC reiterated at its recent shareholder meeting that it’s confident of meeting its 30% revenue growth target for FY22. The consensus estimates (Bullish, 8/10 analysts with Buy/Strong Buy ratings) suggest that TSMC’s guidance is conservative, as they modeled for YoY growth of 31.9%.
Furthermore, the company has maintained its confidence in maintaining its technological lead over its closest peers, moving into the 2nm process by 2025. It also indicated that it would adopt ASML’s (ASML) High-NA EUV in 2024, but did not specify when it would be ready for volume production. Furthermore, Apple’s new M2 chip (AAPL) is also expected to help drive TSMC’s revenue growth through 2025, helping stem the market’s pessimism about a potential downturn.
However, concerns remain over whether a potential data center/HPC slowdown could occur. For example, notable Taiwan’s server ODMs highlighted that H2’22 shipment growth could be slower than previous estimates.
Therefore, we believe these concerns have been reflected in TSM stock performance since January, as the market is forward-looking. But, the question is whether the current levels represent an opportune time to add exposure to TSM stock from the fundamental valuation framework.
| Stock | TSM |
| Current market Cap | NT$12,900B |
| Hurdle rate (CAGR) | 18% |
| Projection through | CQ2’26 |
| Required FCF yield in CQ2’26 | 2.5% |
| Assumed TTM FCF margin in CQ2’26 | 16.4% |
| Implied TTM revenue by CQ2’26 | NT$3,812.64B |
TSM stock reverse cash flow valuation model. Data source: S&P Capital IQ, author
Some investors kindly informed us in the past not to use FCF to model TSM’s valuation due to the timing of its CapEx intensity. As seen above, TSMC’s FCF margins are relatively volatile, as seen for FY22.
However, we believe that the double top bull trap in January 2022 has informed us how the market intends to value TSMC stock. We think investors should not understate the risk of its massive CapEx expansion that could hit the FCF profitability of critical foundry players like TSMC.
TSMC is undoubtedly a high-quality company, with a seemingly unassailable leadership in advanced node manufacturing (at the moment). However, it doesn’t mean it’s a good stock currently.
Based on our parameters (and we used reasonable assumptions), TSMC needs to deliver a TTM revenue of NT$3,812.64B by CQ2’26 to justify its current valuation.
However, the consensus estimates suggest that TSMC could post revenue of NT$2,819.79B in FY24. Therefore, we require TSMC to deliver a revenue CAGR of 22.28% from FY24-CQ2’26, an improbable scenario.
Is TSM Stock A Buy, Sell, Or Hold?
We reiterate our Hold rating on TSM stock.
We have not observed a bear trap price action, even though it could be at a near-term bottom. Therefore, we will reassess our rating if we notice a significant price action structure that could stanch its bearish momentum.
Our valuation analysis suggests TSM stock is not undervalued. In addition, TSM stock is likely to underperform its 5Y CAGR of 18.9% at its current valuation.
Be the first to comment