

RiverNorthPhotography
Thesis
Leading asset manager T. Rowe Price Group, Inc. (NASDAQ:TROW) stock has been hammered since its September 2021 highs. Given its exposure to equity-based AUM, investors shouldn’t be surprised as the equity bear market has inflicted tremendous pain on investors. Furthermore, fixed income was also battered in 2022, as a hawkish Fed continued to pile on the misery for bond investors with rapid rate hikes to combat elevated inflationary pressures.
As a result, 2022 has been a year for TROW investors to forget, as they battled unsuccessfully against market forces. In addition, investors repositioned their portfolios, coupled with negative investor sentiment driving massive outflows, exacerbated the challenges for T. Rowe.
However, our analysis suggests that TROW has likely formed its long-term bottom in June. Therefore, we view the recent pullback from its summer rally as healthy and appropriate for investors to add more positions.
As such, we rate TROW as a Buy.
Market Bottom Amid A Hawkish Fed Is Not Impossible
Investors need to consider that the market is a forward-discounting mechanism. Even though the Fed is expected to raise its rates by 75 bps (78% probability as of September 15) at the upcoming FOMC meeting, it’s still up against a medium-term inflation outlook that remains relatively well-controlled.
August’s CPI print of 8.3% YoY came in ahead of the consensus estimates (but down from July’s 8.5% YoY), sparking the bearish furor in this week’s broad market decline. However, investors need to remember that the 5Y breakeven remains at 2.62%, well below the current elevated rates. As a result, medium-term inflation expectations remain relatively well-anchored. JPMorgan (JPM) also articulated that it continues to see moderating inflation data, as it added:
The data appear to be increasingly supportive of a soft landing (rather than a global recession), given moderating inflation and wage pressures, rebounding growth indicators, and stabilizing consumer confidence. – Seeking Alpha
We also discussed in our recent SPDR S&P 500 ETF (SPY) article why we envisaged that the broad market bottomed out in June/July. Therefore, we are confident that the bottoming tailwinds should lift TROW’s prospects markedly, given its exposure to the market, as CEO Rob Sharps articulated:
The biggest driver of our AUM is beta. It’s a market performance. In over really pretty much any time horizon, given $1.3 trillion base of AUM and substantial exposure to equities, the market movement is going to have a bigger impact on our base of AUM than organic growth will. (T. Rowe Business Update)
T. Rowe – Look Ahead To Better Days in FY23
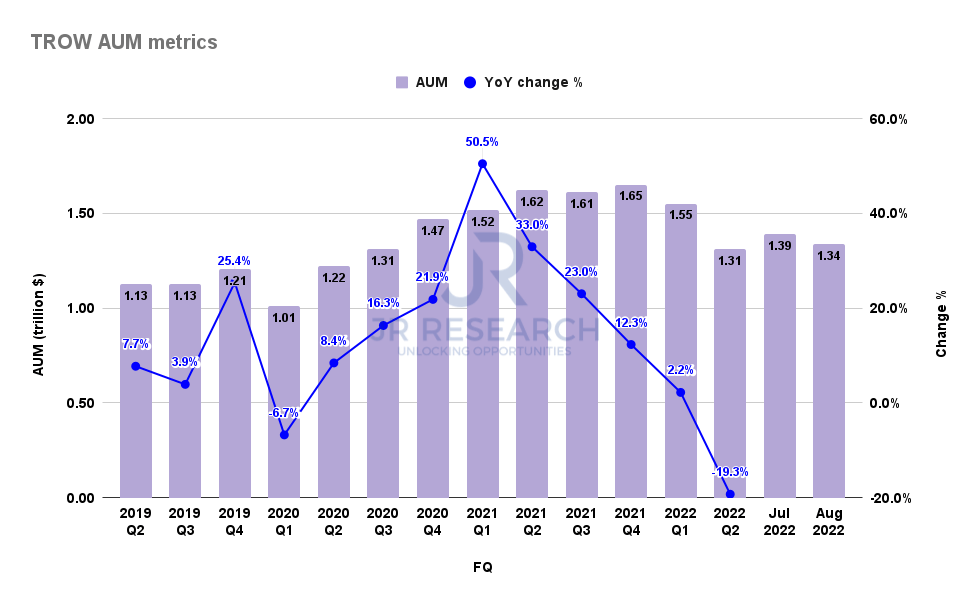
T. Rowe AUM metrics (Company filings)
T. Rowe’s AUM growth has fallen off a cliff since Q1’21, posting its fifth consecutive quarter of growth deceleration. Moreover, it posted negative growth in Q2’22, as its AUM declined by 19.3%, down from Q1’s 2.2% uptick.
However, its AUM also appears to have stabilized in July and August. Despite that, we believe September could be another subdued month, given the recent sell-off. Therefore, we encourage investors to assess Q3’s metrics to even out the volatility of MoM metrics.
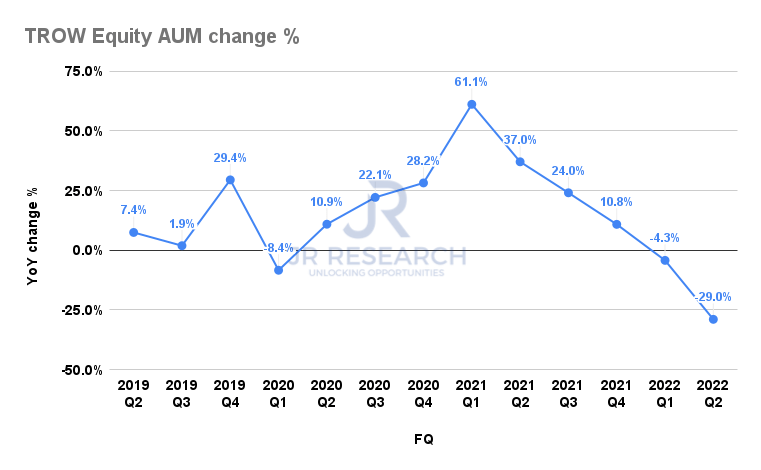
T. Rowe Equity AUM change % (Company filings)

T. Rowe Fixed income AUM change % and Multi-asset AUM change % (Company filings)
Unsurprisingly, Equity led the carnage in its AUM decline, as its growth fell 29% in Q2. While the weakness was broad-based, Fixed income fell 4.3%, below Multi-asset’s 13.8% decline. Management also highlighted it would be investing in building up its non-Equity portfolio, which should help reduce its AUM volatility moving ahead.
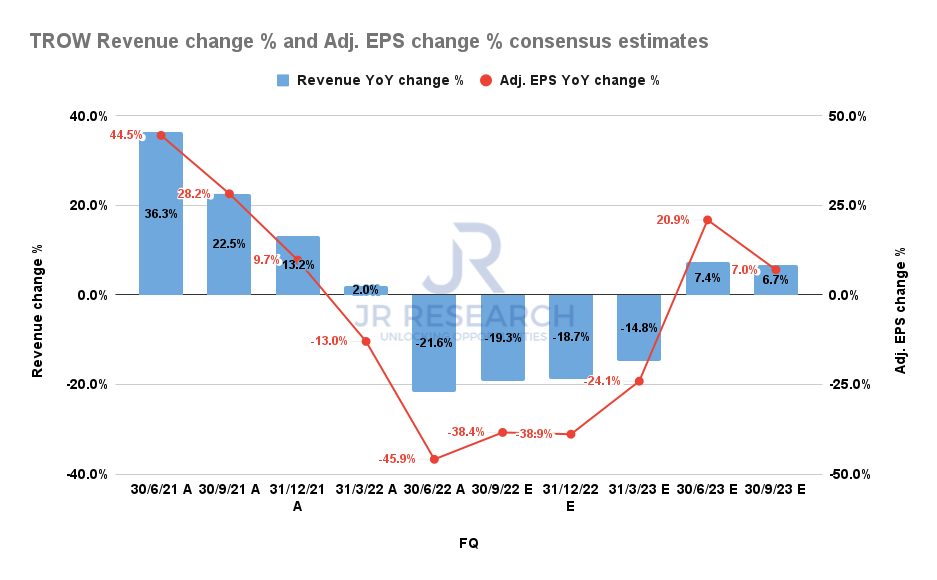
T. Rowe Revenue change % and Adjusted EPS change % consensus estimates (S&P Cap IQ)
Notwithstanding, we urge investors to look ahead, even though T. Rowe’s revenue and adjusted EPS growth could face near-term headwinds through FQ1’23.
Given our conviction of a broad market bottom in June/July, we are confident the consensus estimates (neutral) are credible, with growth recovery from FQ2’23.
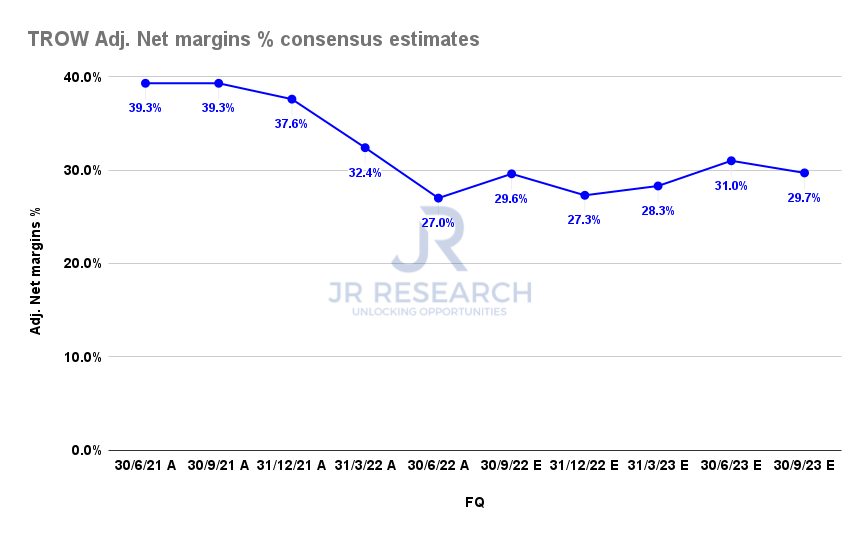
T. Rowe Adjusted net margins % consensus estimates (S&P Cap IQ)
Moreover, T. Rowe’s adjusted net margins are expected to remain robust, corroborating its strong competitive moat as one of the leading asset managers globally. Consequently, we believe it should continue to support its relatively low dividend payouts, undergirding its valuation through the current cycle.
Is TROW Stock A Buy, Sell, Or Hold?

T. Rowe Dividend per share and TTM Dividend yield % consensus estimates (S&P Cap IQ)
Given its robust profitability profile, T. Rowe is expected to raise its payout through FY23, with an estimated TTM dividend yield of 4.3% on a next-twelve-months basis. It’s well above its 10Y mean of 2.81%, offering tremendous value for investors at the current levels.
Also, TROW has delivered a robust and highly consistent 5Y (9.66%) and 10Y (9.15%) total return CAGR for investors. With a YTD total return of -40%, we believe the potential for mean reversion is significant at the current levels, coupled with solid dividend yields.
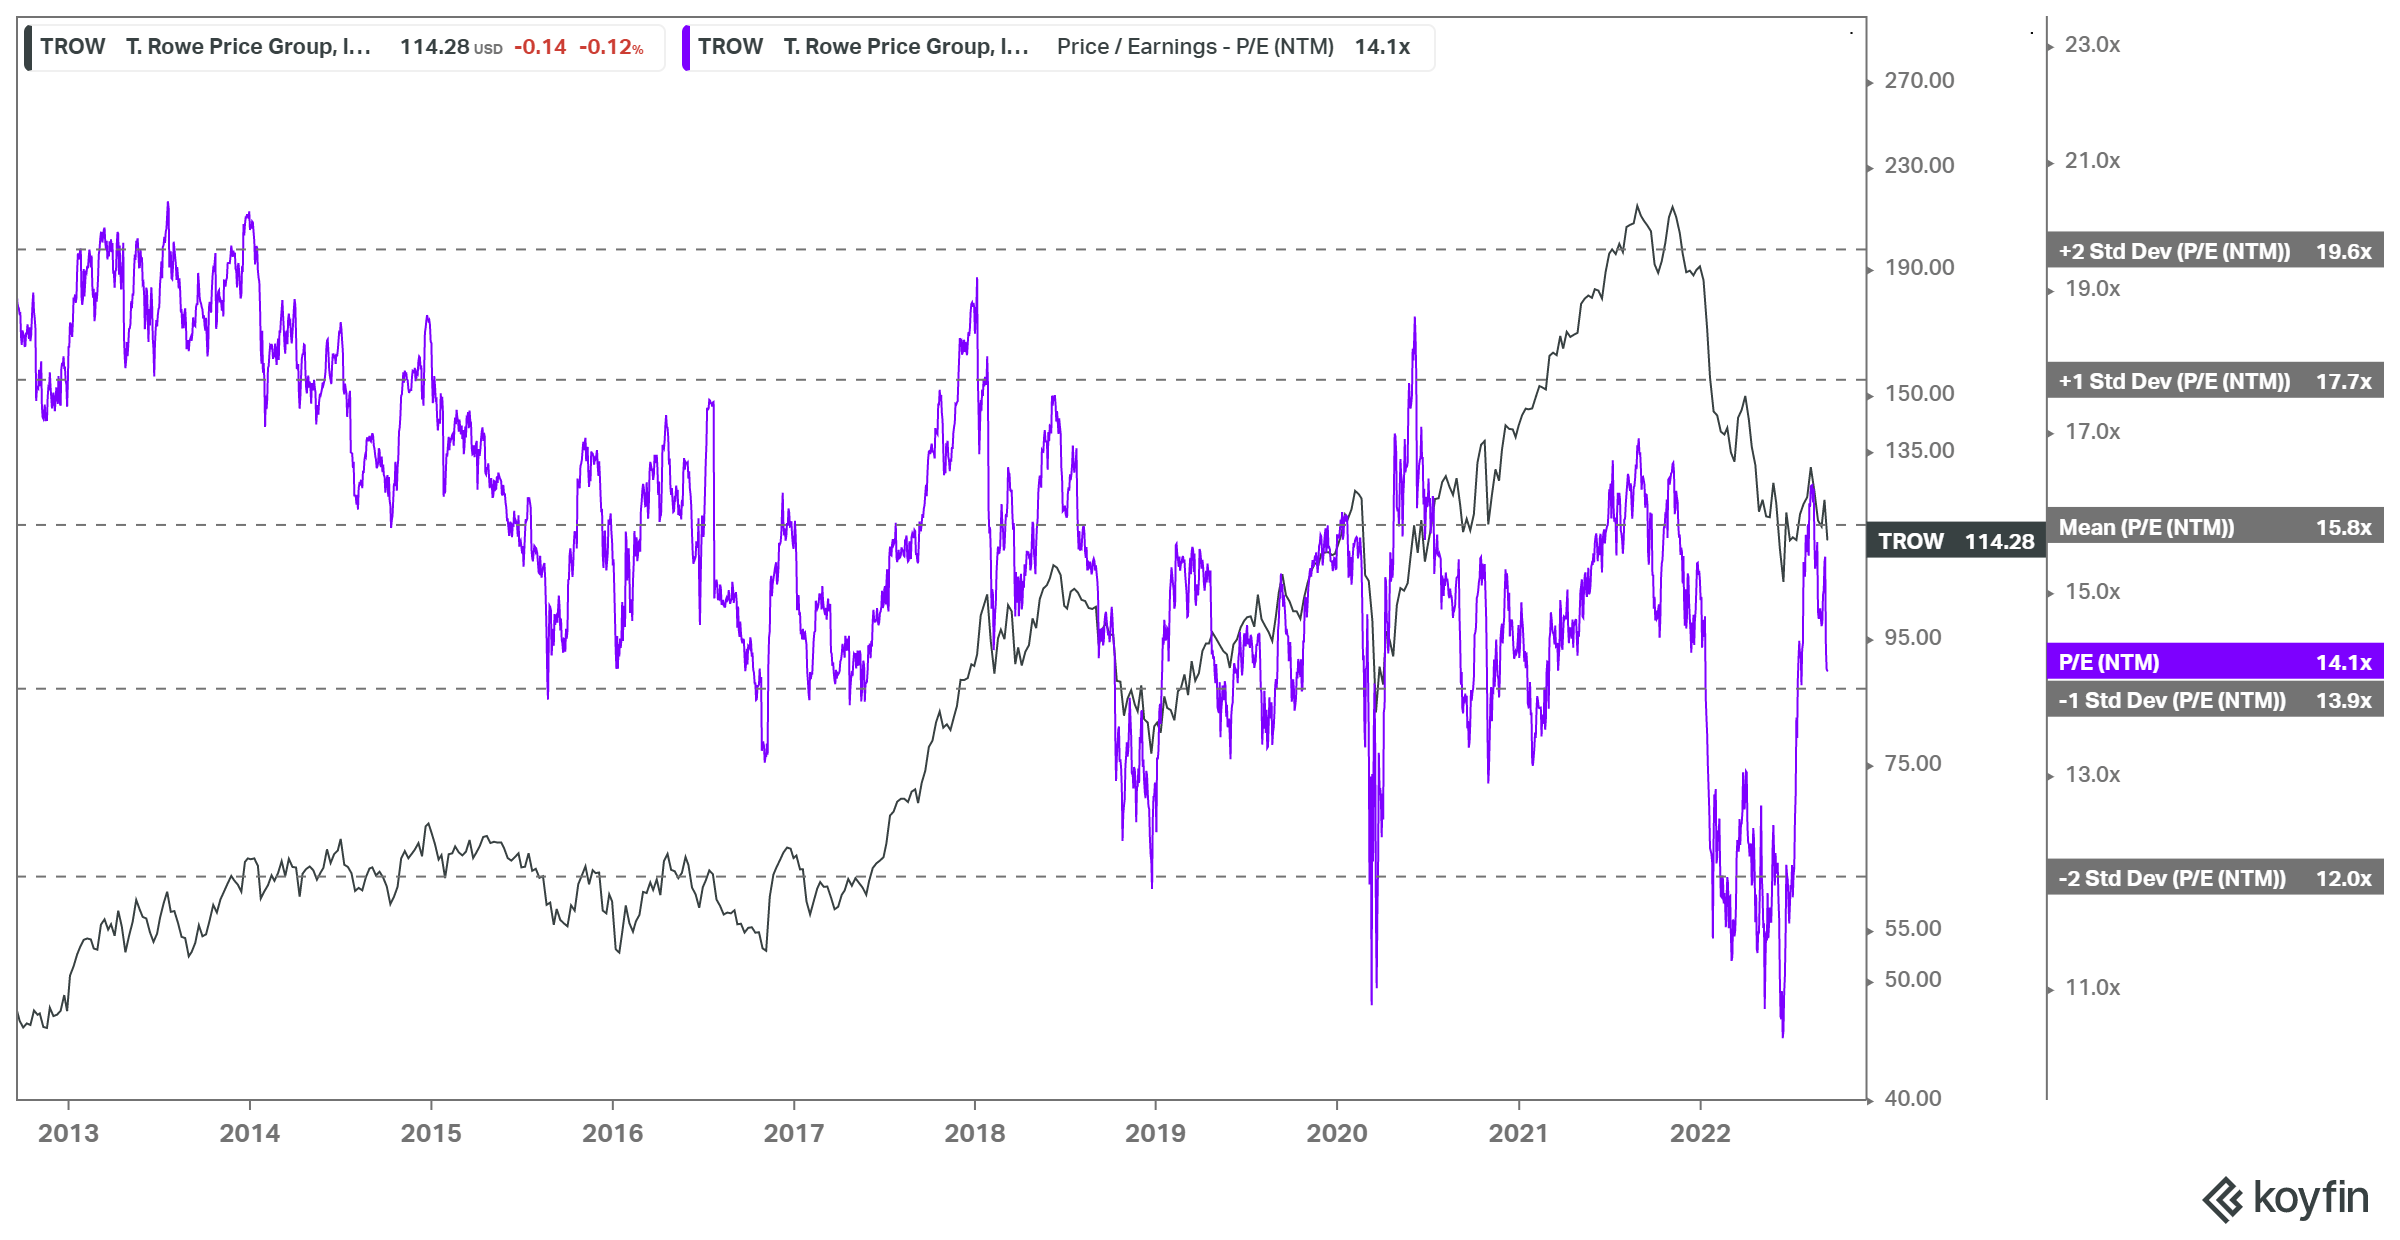
TROW NTM normalized P/E valuation trend (Koyfin)
Furthermore, TROW traded at the two standard deviation zone below its 10Y mean in June. That zone has also supported its valuation during the 2018 bear market and the 2020 COVID carnage. Therefore, we believe TROW has been significantly battered, with its valuations substantially de-risked.
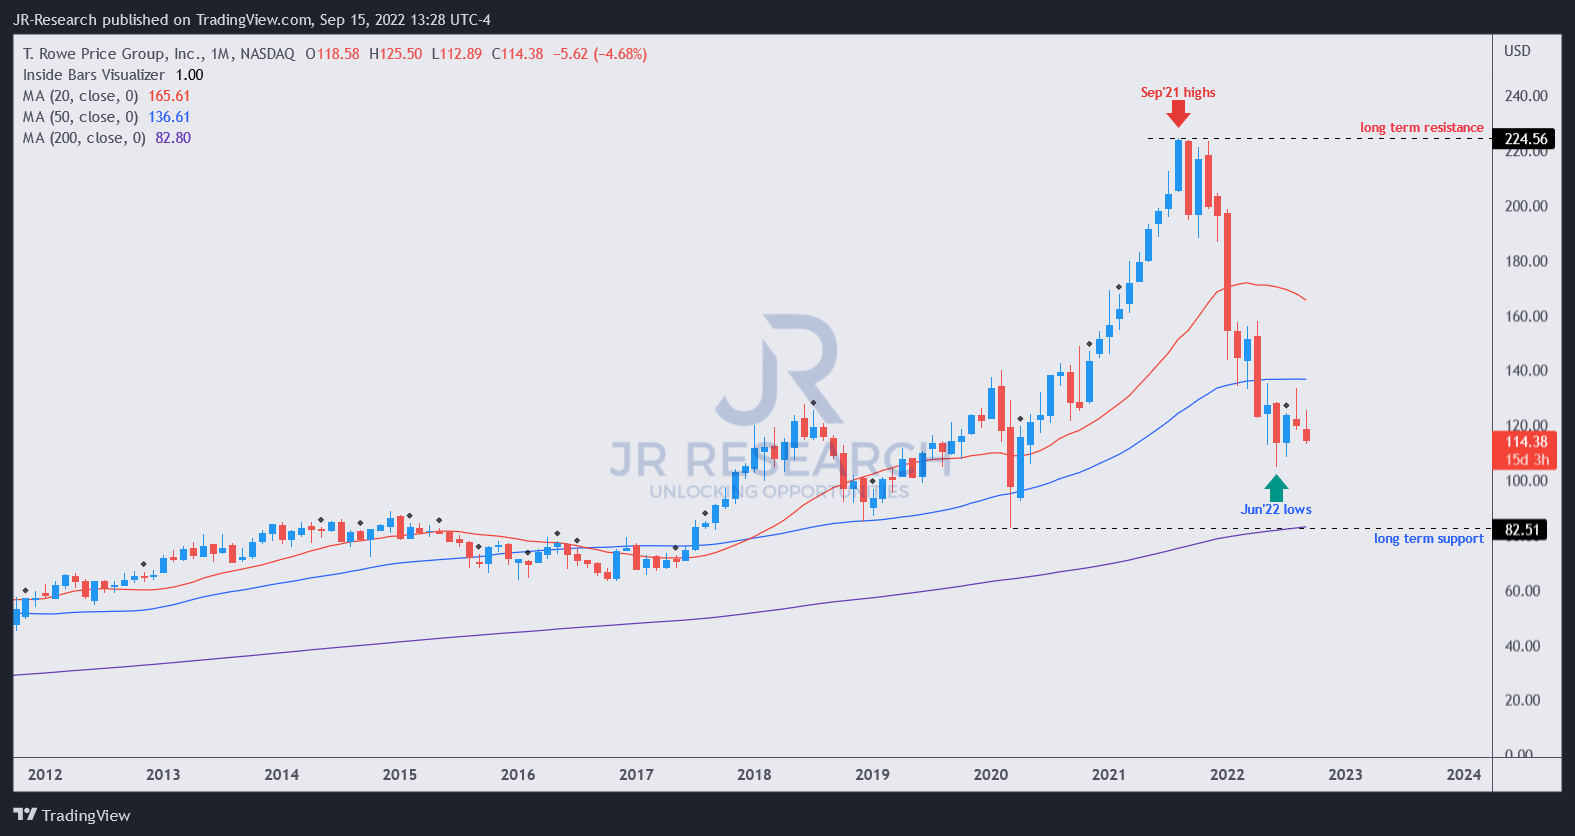
TROW price chart (monthly) (TradingView)
Given its solid medium- and long-term total return CAGR, we aren’t surprised to observe a robust long-term uptrend on its chart above.
We also gleaned that the battering from its September 2021 highs created a bear trap (indicating the market denied further selling downside decisively) in June 2022.
Therefore, we view the recent pullback from its August highs constructively, proffering investors lower-risk entry levels to add exposure.
Accordingly, we rate TROW as a Buy.
Be the first to comment