

JHVEPhoto/iStock Editorial via Getty Images
Over time Sysco (NYSE:SYY) has built its strong position in the food service industry and now holds a 17% share of a $300 B industry. Even better is that Sysco has been growing faster than their cohorts and expects to see accelerated growth versus their competitors over the coming years.
SYY Market Share (SYY FY 2022 10-K presentation)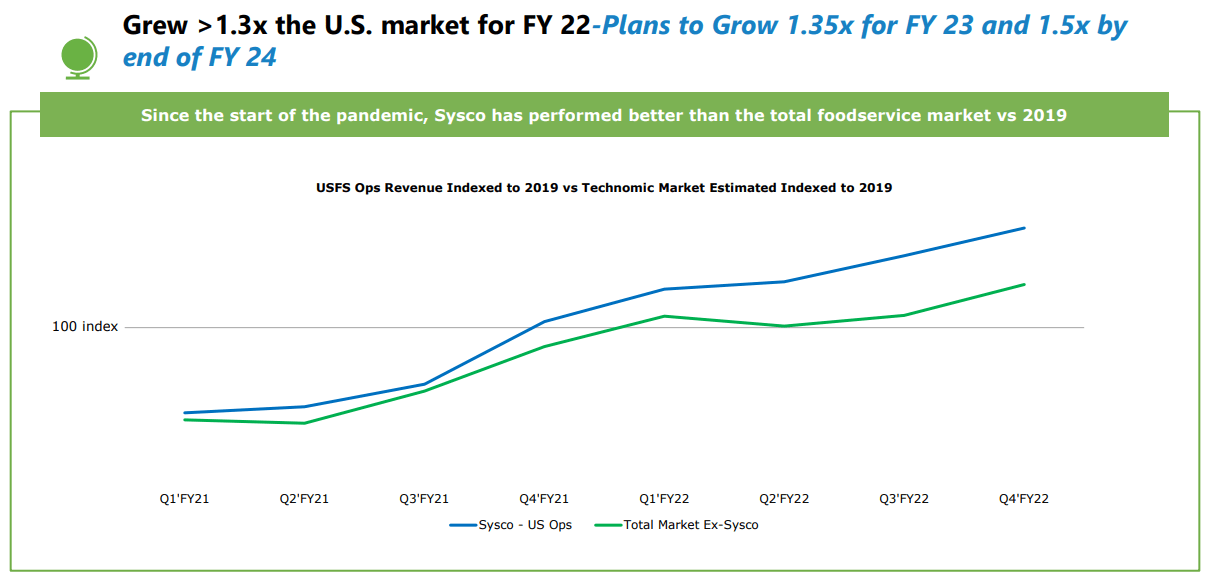
Sysco is the largest global distributor of foods and other products for the food service industry and now has over 700,000 customer locations that they service. Their clients are other businesses and institutions such as restaurants, hospitals, school districts, hotel chains, sports stadiums, universities and much more.
Sysco has 4 operating segments: (1) US Foodservice, (2) SYGMA, (3) International, (4) Other. The US Foodservice segment is by far the largest in terms of sales which represented 70.7% of FY 2022 revenues. The next largest is International with 17.2% of FY 2022 revenues followed by SYGMA with 10.6%. The Other segment which primarily represents the hotel supply operations was the remaining 1.6% of FY 2022 sales.
Sysco has a global footprint although their operations are dominated by the US market. They also operate in Canada, Mexico, Central America, and the Caribbean as well as in Europe.
Sysco’s scale, with an estimated 17% market share, gives them an advantage over competitors as they have the supplier and distribution network to service just about any customer anywhere in the world. Their customers are more concerned with Sysco’s ability to give them what they need when they need it as such the relationship is more about execution rather than cost to keep the clients happy. Sysco’s size allows them to fulfill the majority of their orders within 24 hours of order placement, as such Sysco does have to keep large amounts of inventory on hand.
As a distributor with quick asset/inventory turnover, Sysco is largely able to pass on inflation costs. Sysco passed through 15.0% inflation in the US segment which increased their revenues for the period.
Dividend History
The dividend growth strategy is the one that appealed most to me when I began investing. One reason that I took that approach is that dividends are much more reliable, assuming you choose the right companies, than capital gains as investors this year have found out. Over time the share price will track along with business fundamentals; however, over shorter periods of time investors’ exuberance or gloom plays a much larger role than fundamentals in the share price.
Sysco Dividend History (SYY Investor Relations)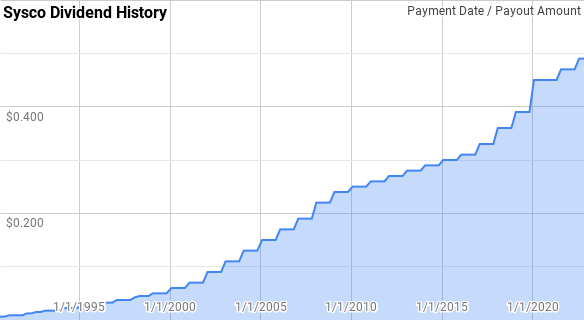
According to the CCC list, Sysco has increased their dividends for 52 consecutive years which makes them a Dividend King.
Dating back to 1991, Sysco’s year-over-year dividend growth has ranged from 3.4% to 52.6% with an average of 14.7% and a median of 13.6%.
Over that time there’s been 27 rolling 5-year periods with annualized dividend growth spanning from 3.6% to 31.8% with an average of 13.4% and a median of 13.9%.
Sysco has also delivered a rolling 10-year period annualized dividend growth between 5.0% to 24.0% with an average of 13.0% and a median of 13.7%.
The rolling 1-, 3-, 5-, and 10-year annualized dividend growth rates from Sysco since 1991 can be found in the following table.
| Year | Annual Dividend | 1 Year DGR | 3 Year DGR | 5 Year DGR | 10 Year DGR |
| 1991 | $0.030 | ||||
| 1992 | $0.043 | 41.06% | |||
| 1993 | $0.065 | 52.58% | |||
| 1994 | $0.080 | 23.08% | 38.37% | ||
| 1995 | $0.100 | 25.00% | 32.90% | ||
| 1996 | $0.120 | 20.00% | 22.67% | 31.78% | |
| 1997 | $0.140 | 16.67% | 20.51% | 26.87% | |
| 1998 | $0.163 | 16.07% | 17.57% | 20.11% | |
| 1999 | $0.190 | 16.92% | 16.55% | 18.89% | |
| 2000 | $0.220 | 15.79% | 16.26% | 17.08% | |
| 2001 | $0.260 | 18.18% | 16.96% | 16.72% | 24.02% |
| 2002 | $0.320 | 23.08% | 18.98% | 17.98% | 22.34% |
| 2003 | $0.400 | 25.00% | 22.05% | 19.74% | 19.93% |
| 2004 | $0.480 | 20.00% | 22.67% | 20.36% | 19.62% |
| 2005 | $0.560 | 16.67% | 20.51% | 20.55% | 18.80% |
| 2006 | $0.640 | 14.29% | 16.96% | 19.74% | 18.22% |
| 2007 | $0.720 | 12.50% | 14.47% | 17.61% | 17.79% |
| 2008 | $0.820 | 13.89% | 13.56% | 15.44% | 17.57% |
| 2009 | $0.920 | 12.20% | 12.86% | 13.90% | 17.09% |
| 2010 | $0.980 | 6.52% | 10.82% | 11.84% | 16.11% |
| 2011 | $1.020 | 4.08% | 7.55% | 9.77% | 14.65% |
| 2012 | $1.060 | 3.92% | 4.83% | 8.04% | 12.72% |
| 2013 | $1.100 | 3.77% | 3.93% | 6.05% | 10.65% |
| 2014 | $1.140 | 3.64% | 3.78% | 4.38% | 9.04% |
| 2015 | $1.180 | 3.51% | 3.64% | 3.78% | 7.74% |
| 2016 | $1.220 | 3.39% | 3.51% | 3.65% | 6.66% |
| 2017 | $1.280 | 4.92% | 3.94% | 3.84% | 5.92% |
| 2018 | $1.380 | 7.81% | 5.36% | 4.64% | 5.34% |
| 2019 | $1.500 | 8.70% | 7.13% | 5.64% | 5.01% |
| 2020 | $1.680 | 12.00% | 9.49% | 7.32% | 5.54% |
| 2021 | $1.800 | 7.14% | 9.26% | 8.09% | 5.84% |
| 2022 | $1.880 | 4.44% | 7.82% | 7.99% | 5.90% |
Source: Author; Data Source: Sysco Investor Relations
The dividend payout ratio lets you know how safe a dividend payment has been. All else being equal the lower the dividend payout ratio the better as there’s more cushion for the inevitable adverse events that temporarily hurt the business without jeopardizing the dividend.
SYY Dividend Payout Ratio (SYY SEC filings)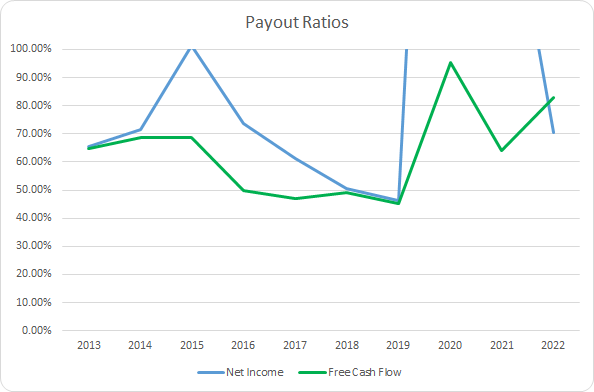
Sysco’s payout ratio hasn’t exactly been the most stable. The 10-year average net income payout ratio comes to 111.3% with the 5-year average at 148.0%.
However, when looking at their free cash flow we still see quite a bit of choppiness, but it’s not nearly as ominous. The 10-year average free cash flow payout ratio comes to 63.5% with the 5-year average at 67.3%.
Quantitative Quality
While a lengthy dividend growth history is a good sign that you’re dealing with a strong business that is but one data point. I like to see how a business has performed over time across a variety of metrics.
SYY Revenue Profits and Cash Flow (SYY SEC filings)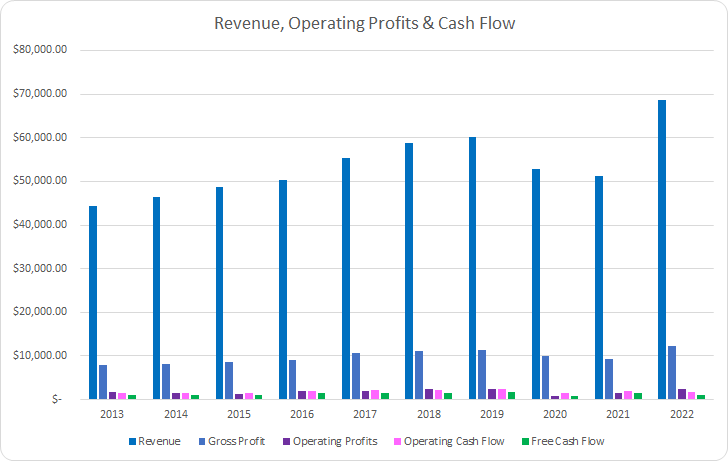
Prior to the pandemic, Sysco showed steady growth in revenues accomplished through both organic and acquired growth. However, as a food distributor that focuses on larger scale customers, i.e. school districts, hospitals, restaurants… their business suffered as fear took hold. The silver lining is that Sysco’s FY 2022 sales came in roughly in line with the trend of the prior 7 years as if the pandemic had not happened.
Between FY 2013 through FY 2022, Sysco’s revenues rose by 54.5% in total or 5.0% annualized. Gross profits increased by 56.6% or 5.1% annualized with operating profits lagging behind improving by 41.1% or 3.9% annualized.
Operating cash flow hasn’t fared well as Sysco deals with inflation as it grew just 18.5% in total or 1.9% annualized over that time. Likewise, free cash flow increased just 15.9% or 1.7% annualized.
Good businesses should be able to, at a minimum, defend their margins over time as competitors try to encroach on their operations.
SYY Margins (SYY SEC filings)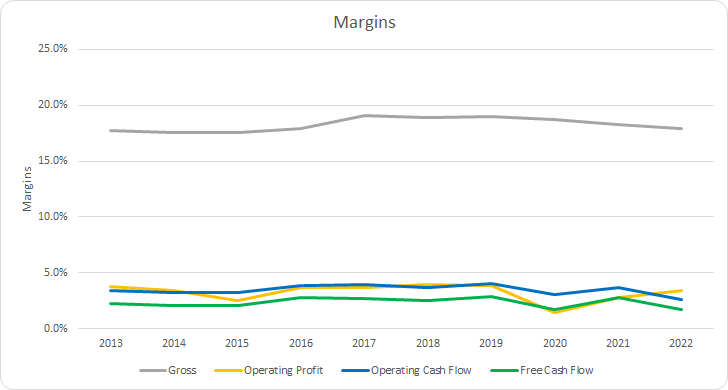
Sysco’s gross margins have shown a slight uptick during the last decade, but for the most part, have been stable. The 10-year average gross margin works out to 18.3% with the 5-year average coming to 18.6%.
The first thing that stands out is how tight Sysco’s free cash flow margin is, although it makes sense with respect to the business they run as a food distributor. Sysco’s 10-year and 5-year average free cash flow margins are 2.3%.
An alternative measure of profitability is the free cash flow generation versus some measure of assets or capital base. The free cash flow returns let you know how profitable the business is compared to its assets or invested capital. I prefer to see a 10% free cash flow return on invested capital.
SYY Free Cash Flow Returns (SYY SEC filings)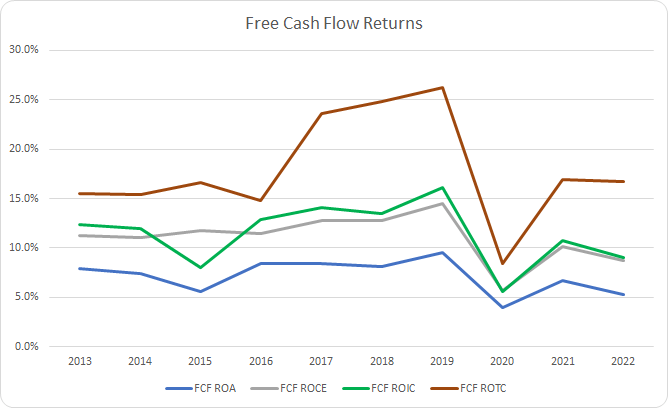
Despite the low FCF margins that Sysco has they show much stronger FCF ROIC thanks to very high asset/inventory turnover. Sysco has also been able to surpass the 10% FCF ROIC level in 7 of the last 10 years. The 10-year average FCF ROIC works out to 11.4% with the 5-year average at 11.0%. The average FCF ROTC, which aims to measure the FCF generation compared to the physical assets, is 17.9% and 18.6%, respectively.
To understand how Sysco uses its free cash flow I calculate three variations of the metric, defined below:
- Free Cash Flow, FCF: Operating cash flow less capital expenditures
- Free Cash Flow after Dividend, FCFaD: FCF less total cash dividend payments
- Free Cash Flow after Dividend and Buybacks, FCFaDB: FCFaD less net cash used on share repurchases
SYY Free Cash Flows (SYY SEC filings)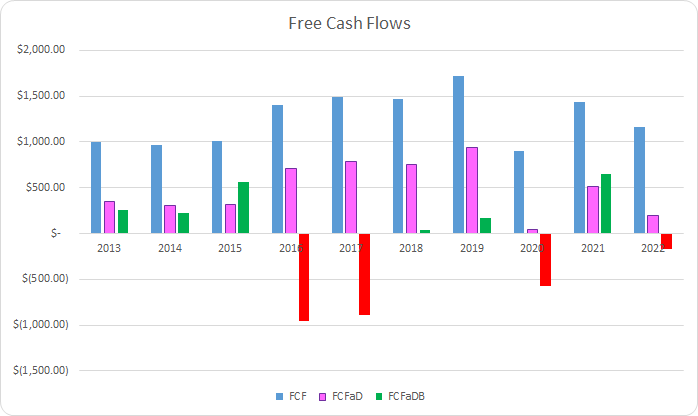
Sysco’s FCF hasn’t shown a nice and steady rise over time although the last three years have dealt with the pandemic and now inflation and potential recession headwinds which muddies the water a bit. Over the last 10 years, Sysco generated a total of $12.6 B in FCF. They also sent out $7.6 B to shareholders via dividend payments which put the cumulative FCFaD for the last decade at $4.9 B.
Additionally, Sysco has spent a net total of $5.6 B on share repurchases over that time which puts the cumulative FCFaDB at -$0.7 B. Sysco showed very aggressive repurchases in FY 2016, FY 2017, and FY 2020.
Over that time Sysco has favored dividends to share repurchases as a means to return excess cash to shareholders. Sysco has used roughly $1.36 on dividends for every $1.00 net used on share repurchases.
SYY Shares Outstanding (SYY SEC filings)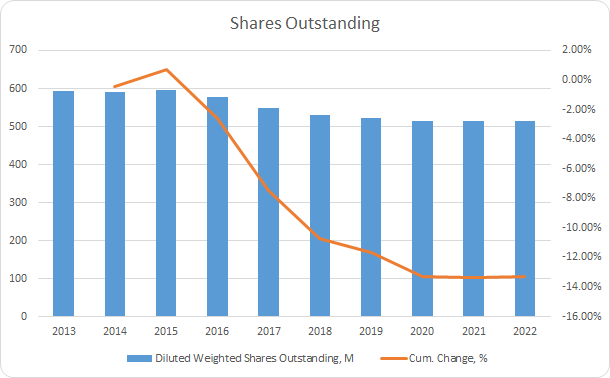
Sysco’s share count is down 13.3% from FY 2013 through FY 2022 or roughly a 1.6% annualized decline. Buybacks were especially strong for FY 2016 – FY 2018 with an average annual decline of 3.9%.
My goal is to find businesses that I want to own for the long-term which means the balance sheet and leverage placed upon the business is another factor to track.
SYY Debt to Capitalization (SYY SEC filings)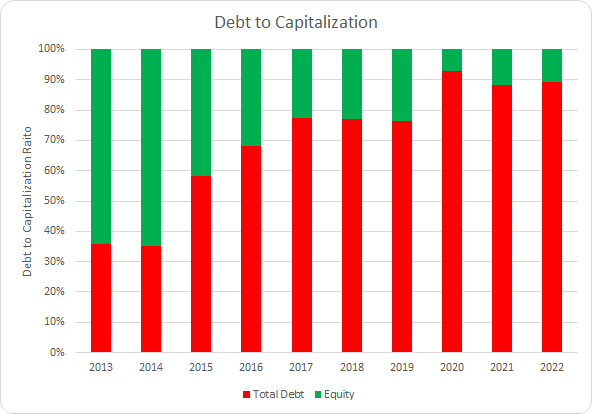
Sysco’s debt-to-capitalization ratio has risen substantially over the last decade partially due to acquisitions. While the low-interest rates of the last decade have made debt extremely cheap as a means of financing the business it does increase risks should interest rates rise significantly as we’ve seen thus far in 2022.
Over the last decade, Sysco’s debt-to-capitalization ratio has averaged 70% and, for the most recent 5 years, the average comes to 85%.
I place more emphasis on the net debt ratios when trying to determine if a company appears to be carrying excessive leverage. The net debt ratios look at the total debt less cash compared to a measure of profits or cash flow. The net debt ratios let you know how quickly the management team could de-lever through its normal business operations.
SYY Debt Ratios (SYY SEC filings)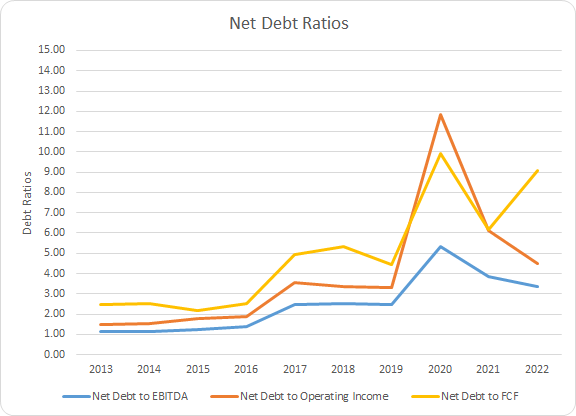
With the rise in debt over the last decade it shouldn’t be too surprising that Sysco’s net debt ratios have risen. The 10-year average net debt-to-EBITDA, net debt-to-operating income, and net debt-to-FCF ratios for Sysco are 2.5x, 3.9x, and 5.0x, respectively. The 5-year averages are 3.8x, 6.4x, and 7.4x, accordingly.
Sysco’s net debt rose by $8.0 B between FY 2013 and FY 2022. During FY 2021 Sysco was able to significantly reduce their debt load. Part of the increased debt levels is due to the number of acquisitions that Sysco has taken on that have totaled $5.4 B.
How Did We Get Here?
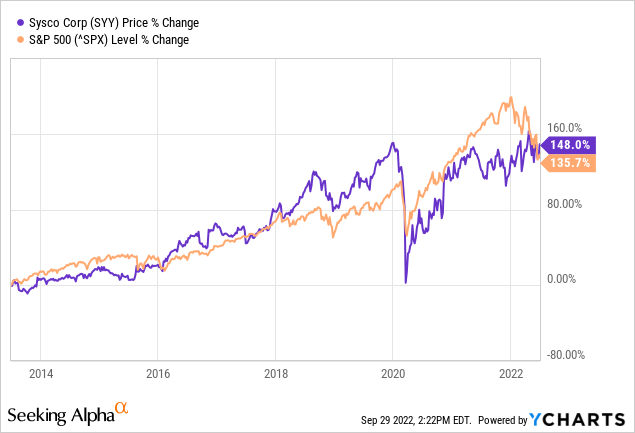
Admittedly I didn’t expect to see that Sysco had outperformed the S&P 500 between June 28, 2013 and June 30, 2022. Yet based on share price alone Sysco is up 148.0% over that time compared to 135.7% for the S&P 500. That works out to a 9.5% annualized gain in share price and coupled with the initial dividend yield around 3.2% gives a total return CAGR in the neighborhood of 12.7%.
However, not all returns are created equally. That’s why I’ve started to break down the returns into business performance, capital allocation, and sentiment change.
- Business Returns: Measured by revenue growth and change in net profit margin
- Capital Allocation Returns: Measured by dividend yield and annualized change in share count
- Sentiment Returns: Measured by the annualized change in starting and ending TTM P/E multiple
As we saw earlier Sysco grew revenues by 54.5% in total from FY 2013 through FY 2022 which contributed accounted for 4.8% of the annualized return over that time. Net profit margin was actually down over that time from 2.2% to 2.0%, an 11.4% total decline, and was a -1.3% drag on annualized returns. That brings the total business returns to around +3.5% annualized.
Sysco’s dividend yield was around 3.3% at the beginning over the period on a forward-looking basis. Once again the share count for Sysco is down 13.3% over that time and attributed ~1.5% to the annualized return bringing the total capital allocation annualized returns to +4.7%.
Sentiment change is the least sustainable return source. As such, Sysco’s P/E ratio was 20.4x at the beginning of the period and ended it at 32.0x. That’s a total increase of 57.1% and a +4.5% attribution to the annualized returns.
| Annualized Returns | % of Returns | |
| Business Returns | 3.5% | 28% |
| Capital Allocation Returns | 4.7% | 37% |
| Sentiment Change | 4.5% | 35% |
| Total Annualized Returns | 12.7% |
Source: Author
That brings the combined business and capital allocation returns to 8.2% over that time or ~65% of the annualized CAGR. That leaves the remaining 4.5% returns to sentiment change.
SYY Returns Breakdown (SYY SEC filings)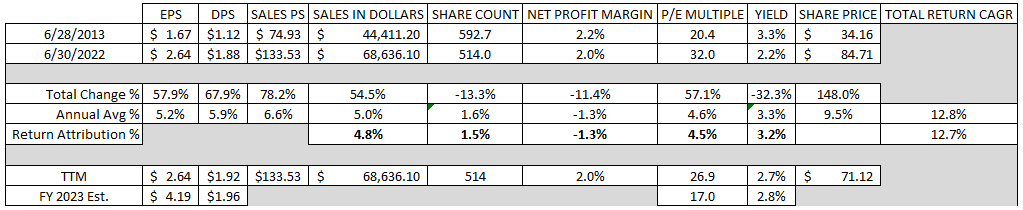
Valuation
When valuing a potential investment I like to approach that puzzle from various perspectives and valuation methods. The methods that I utilize are dividend yield theory, a reverse discounted cash flow analysis, and a minimum acceptable rate of return, “MARR”, analysis.
Dividend yield theory is a valuation framework that’s best suited for stable businesses with a consistent history of paying out dividends. It’s a reversion to the mean-based model that assumes that over time investors, collectively, will value a business such that it offers a normal dividend yield. For Sysco, I’ll use the 3-year average forward dividend yield as a proxy for fair value.
Sysco Dividend Yield Theory (SYY Investor Relations and Google Finance)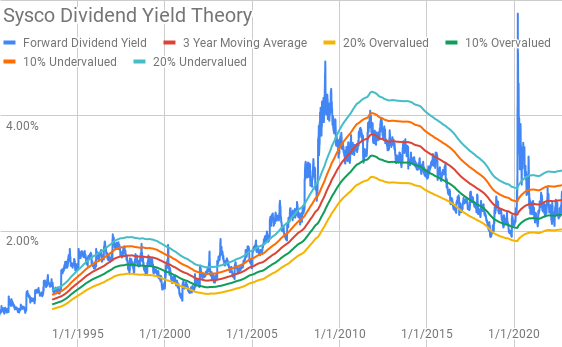
Sysco’s 3-year average forward dividend is 2.55% while shares currently offer a forward dividend yield of 2.74%.
A reverse discounted cash flow analysis can be used to figure out what the current market valuation implies about the expected cash flows the business must generate. In other words, by working backward from the valuation today, you can figure out what kind of growth and margins the business needs to have in order to generate the returns you desire.
I use a simplified DCF model based on revenue growth, an initial free cash flow margin of 1.9% that improves to 2.6% across the forecast period. The terminal growth rate is estimated to be 2.5%.
For the discount rate, I used an estimated after-tax cost of debt of 3.4% with a cost of equity of 10% and 8%. That yields an 8.4% discount rate and a 6.9% discount rate.
Based on those assumptions Sysco needs to grow revenues 8.5% annually through FY 2032 in order to generate the cash flows that would support the current market valuation with a 10% equity return target/8.4% discount rate. With the 8% cost of equity/6.9% discount rate scenario, the required revenue growth declines to 4.0% annually over that same period.
A MARR analysis entails estimating the future earnings and dividends that a business will produce over a given period of time. You then apply a reasonable and conservative terminal multiple on those future earnings to determine a future share price. If the expected returns are greater than your threshold for investment then you can proceed with the purchase.
Analysts expect Sysco to report FY 2023 EPS of $4.19 and FY 2024 EPS of $4.78. They also expect Sysco to be able to grow EPS at a 10.3% annualized rate across the next 5 years. I then assumed that EPS growth would slow to 5.0% annually for the following 5 years. Dividends are assumed to target a 45% payout ratio.
Since Sysco was abnormally affected by the pandemic and ensuing lockdowns I’ve used the 10-year period from March 2010 through March 2020. During that time investors valued Sysco between ~12.5x to ~25.0x TTM EPS.
The following table shows the potential internal rates of return that an investment in Sysco could generate if the assumptions set out above prove to be in the ballpark of how the future plays out. Dividends are assumed to be taken in cash and that Sysco will both pay and increase their dividends along the timeline that has usually followed. Returns assume that shares are purchased at $71.48, Thursday’s close.
| IRR | ||
| P/E Level | 5 Year | 10 Year |
| 25 | 20.3% | 13.9% |
| 22.5 | 18.0% | 12.8% |
| 20 | 15.5% | 11.7% |
| 17.5 | 12.8% | 10.4% |
| 15 | 9.8% | 9.0% |
| 10 | 2.2% | 5.4% |
Source: Author
Alternatively, I’ve used the MARR analysis framework to determine the maximum price I could pay for shares today given the range of terminal multiples. My base hurdle rate is a 10% IRR and I’ll also examine 12% and 8% return targets.
| Purchase Price Targets | ||||||
| 10% Return Target | 12% Return Target | 8% Return Target | ||||
| P/E Level | 5 Year | 10 Year | 5 Year | 10 Year | 5 Year | 10 Year |
| 25 | $112 | $98 | $102 | $83 | $123 | $117 |
| 22.5 | $102 | $90 | $93 | $77 | $111 | $107 |
| 20 | $91 | $82 | $84 | $70 | $100 | $97 |
| 17.5 | $81 | $74 | $74 | $63 | $89 | $88 |
| 15 | $71 | $66 | $65 | $56 | $77 | $78 |
| 10 | $50 | $50 | $46 | $43 | $55 | $58 |
Source: Author
Conclusion
Sysco is a solid business that should continue to thrive over time. Great businesses will use adversity to come out stronger when the chaos dies down. That scenario proved out for Sysco as the pandemic, and ensuing lockdowns, hurt a significant portion of their customers which were forced to close or had limited traffic. Since the pandemic, Sysco has outgrown the total foodservice market by 1.3x and expects to see that rise to 1.35x for FY 2023 and 1.5x by FY 2024.
Dividend yield theory suggests a fair value range between $70 and $85. With a current share price around $71.50 Sysco is trading on the lower end of fair value.
The reverse DCF model shows that 10% returns are not likely given the elevated revenue growth. The 8% return scenario looks more achievable with moderate revenue growth assumptions. However, the reverse DCF models do not account for share repurchases which based on the 3-year average FCFaD Sysco could repurchase around 0.7% of the current outstanding shares. Although their FCFaD is still quite suppressed considering the average from FY 2017 through FY 2019 was much more robust at $828 M.
The MARR analysis suggests that returns are likely to be strong with a purchase near Thursday’s closing price. Assuming a 10% return target 5 years out and a fair terminal multiple between 15x and 20x, the fair value range comes to between $71 and $91.
While trajectory of their debt over the last decade isn’t quite what I’d like to see, Sysco should be able to navigate things just fine. The following chart shows Sysco’s debt maturities compared to a few measures of income, averaged over the last 3 fiscal years. Considering that contains some of the worst environments for Sysco to operate in the situation appears quite manageable.
SYY Debt Schedule and Income Metrics (SYY FY 2022 10-K)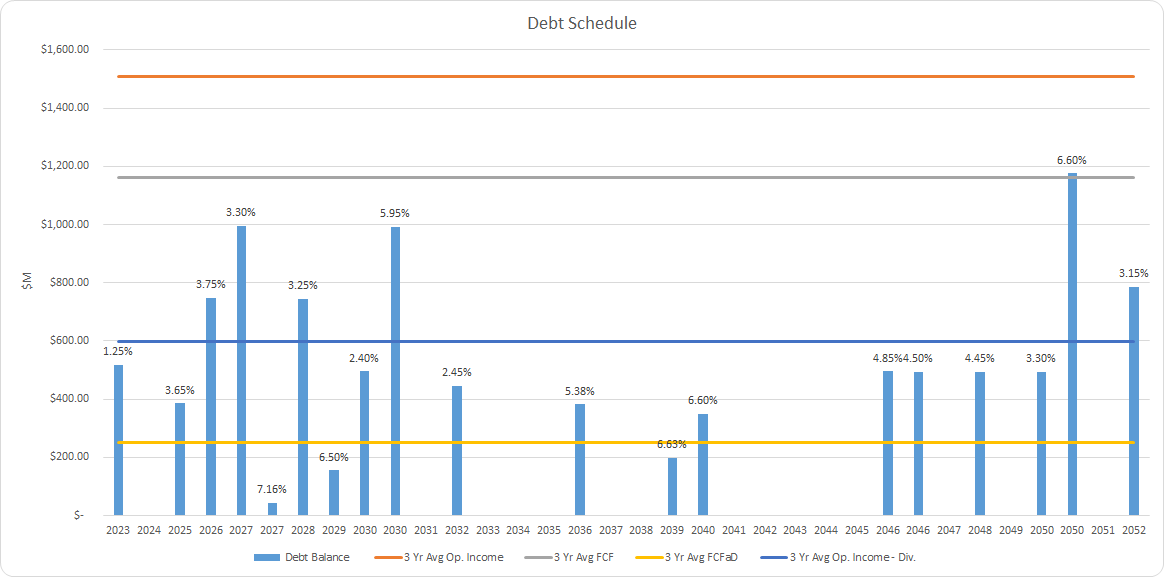
Sysco is a high-quality business that as long as they continue to execute and deliver for customers they should continue to reward shareholders over time. Their end market is still pretty fragmented which allows for continued acquisitions of small and more localized food distributors. In FY 2022 they completed 3 such acquisitions and I expect that to continue over time.
In my opinion, Sysco is a very high-quality business that has very little disruption risk that is trading at a reasonable valuation for investors with a long-term mindset. Two of the valuation models suggest that Sysco is likely trading on the lower end of fair value while the third shows that it’s probably closer to the high end of fair value. For a stable business that has been very shareholder friendly, that’s about all you can ask for. I’ll be considering an investment in Sysco the next time that I transfer funds into my brokerage account.
Be the first to comment