

Swiss Franc, CHF, EUR/CHF, GBP/CHF, AUD/CHF – Talking Points
- EUR/CHF Falls below key support, retesting crucial pivot zone
- GBP/CHF on breakout watch, bull flag formation pending
- AUD/CHF points higher after finding support at 0.6700
EUR/CHF Technical Analysis
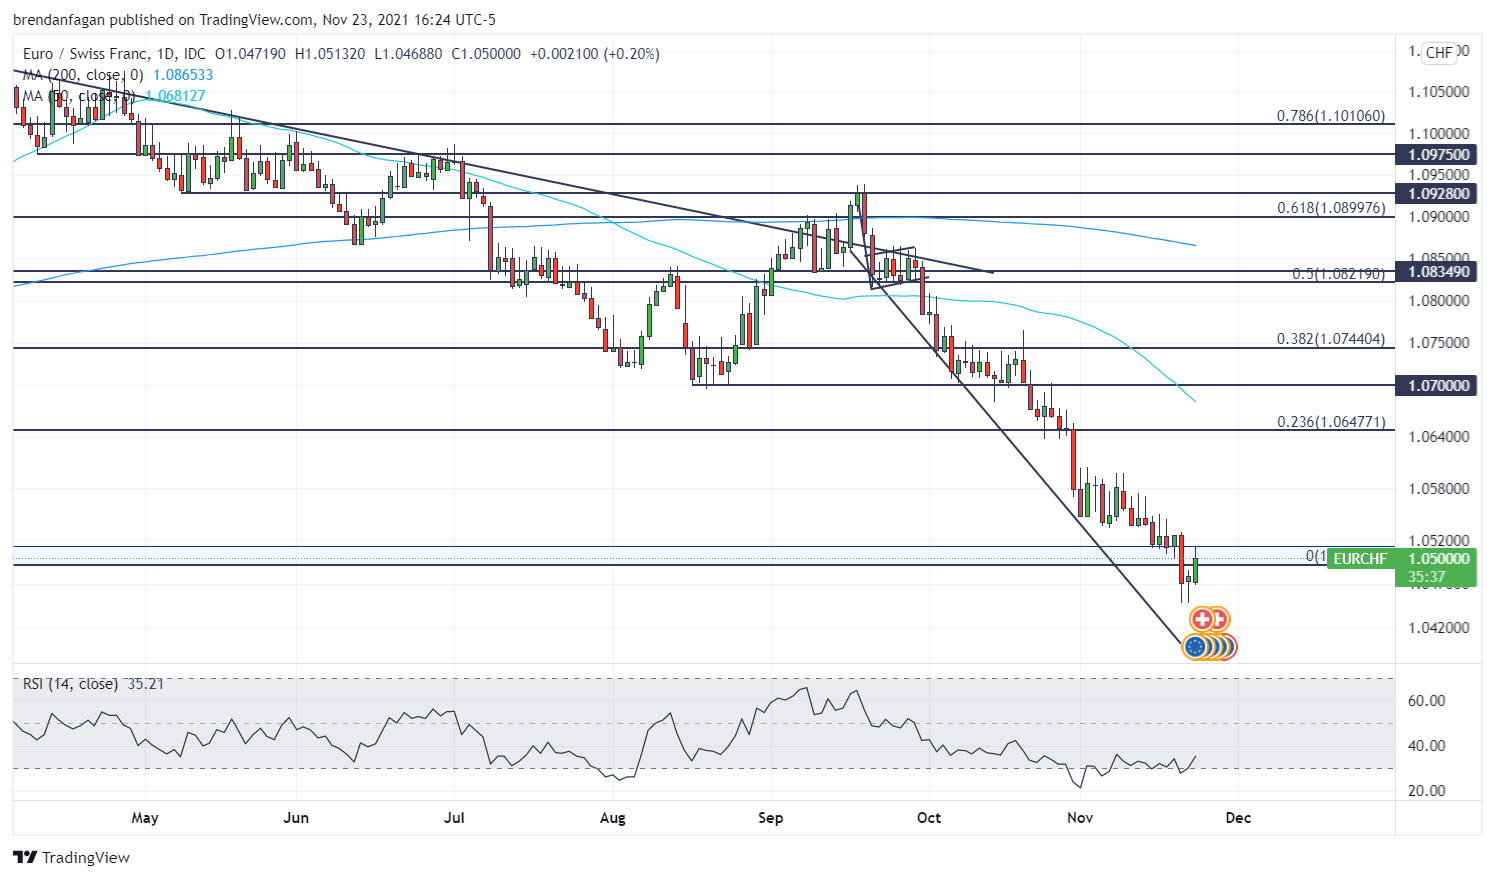
EUR/CHF has shown no signs of bucking its multi-month downtrend, as the pair crashed through key support at 1.050 just last week. Weakness has been the name of the game for many Euro pairs of late, with EUR/CHF no exception. Relative strength just above “oversold” conditions offers a glimpse into the state of the cross, with each key level being taken out on the move lower over the last few weeks.
The most recent level to break was 1.05, which held its ground for multiple sessions. The break that followed saw EUR/CHF make fresh 6-year lows. While we have bounced from those lows, we have simply traded back to the key pivot zone around 1.05. A sustained bounce from these levels could see a retest of the 0.236 Fibonacci retracement level at 1.064. With room to run below, a EUR/CHF break to the downside could manifest a sharp drop with little to no support below.
EUR/CHF Daily Chart
Chart created with TradingView
GBP/CHF Technical Analysis
Contrary to EUR/CHF, GBP/CHF is on breakout watch. Following a sharp sell-off in October and early November, price has rebounded back toward the 1.25 level. This move higher has cooled off of late, with price consolidating below 1.25. This has seen the formation of a bull flag, which on a break of the formation, often sees higher prices trade.
Market participants should be wary of the circumstances, particularly that the flag has just formed, and price has not yet broken higher. Targets on the upside could be found in the 50 or 200-day moving averages. One level of note on the upside is 1.2580, where buyers have often stepped in previously. Price can be propped up by trendline support below, should the bull flag formation break down.
GBP/CHF Daily Chart

Chart created with TradingView
AUD/CHF Technical Analysis
AUD/CHF appears to have put its recent downtrend in the rearview mirror, having carved out a near-term bottom around 0.6700. Price has tested this level twice in November and bounced both times. With marginally improving relative strength, AUD/CHF may look to retest the 50-day moving average on any sustained move higher.
Price has regularly pivoted around the 0.6800 level, so that may represent an ideal target for any breakout. On the downside, price has support at 0.6700. A break below the November swing lows could see a move toward the multi-month descending channel that dates back to the early months of 2021. Price may look to test the upper bound of that channel before making a swan dive back into the trend from earlier this year.
AUD/CHF Daily Chart

Chart created with TradingView
Resources for Forex Traders
Whether you are a new or experienced trader, we have several resources available to help you; indicator for tracking trader sentiment, quarterly trading forecasts, analytical and educational webinars held daily, trading guides to help you improve trading performance, and one specifically for those who are new to forex.
— Written by Brendan Fagan, Intern
To contact Brendan, use the comments section below or @BrendanFaganFX on Twitter
Be the first to comment