

RapidEye/E+ via Getty Images
The modern vehicle is an incredibly complex device. Because of this, many companies have developed over the years that focus on specific niche components in order to facilitate in their construction and continued operation. One such company that has a very small market capitalization of $102.04 million, is Superior Industries International (NYSE:SUP). Fundamentally, performance of the business has been rather volatile in recent years. This includes the time even before the COVID-19 pandemic. Having said that, cash flows have generally been positive, and shares are incredibly cheap. Excluding the company’s preferred stock, leverage for the firm is also not that bad. At the end of the day, this prospect is not without its risks. But for those who want a deep value prospect, the return offered might very well be worth the risk.
A niche component provider
These days, Superior Industries International operates by producing and selling aluminum wheels that are used for vehicles in North America and Europe. The company sells these wheels to OEMs (original equipment manufacturers) and it claims to be one of the largest suppliers of this product on the planet. This is the primary product sold by the company, accounting for 91% of its overall revenue in 2021. These wheels are primarily sold to the aforementioned OEMs with the intention of putting them on new vehicles right off the assembly line. Customers include BMW (OTCPK:BMWYY), Daimler (OTC:DTRUY), Ford (F), General Motors (GM), Honda (HMC), and more. Though the company does focus on selling directly to these major companies, it does also sell aluminum wheels to the European aftermarket under brand names like ATS, RIAL, ALUTEC, and ANZIO.
One bad thing about being a small company in a rather concentrated market is that a significant portion of its revenue comes from just a few key customers. For instance, in 2021, General Motors accounted for 26% of its sales. VW Group (OTCPK:VWAGY) made up 14% of sales. And Ford accounted for 13%. Geographically, 53.8% of the company’s revenue came from North America, with the remaining 46.2% being attributable to its European operations.
Author – SEC EDGAR Data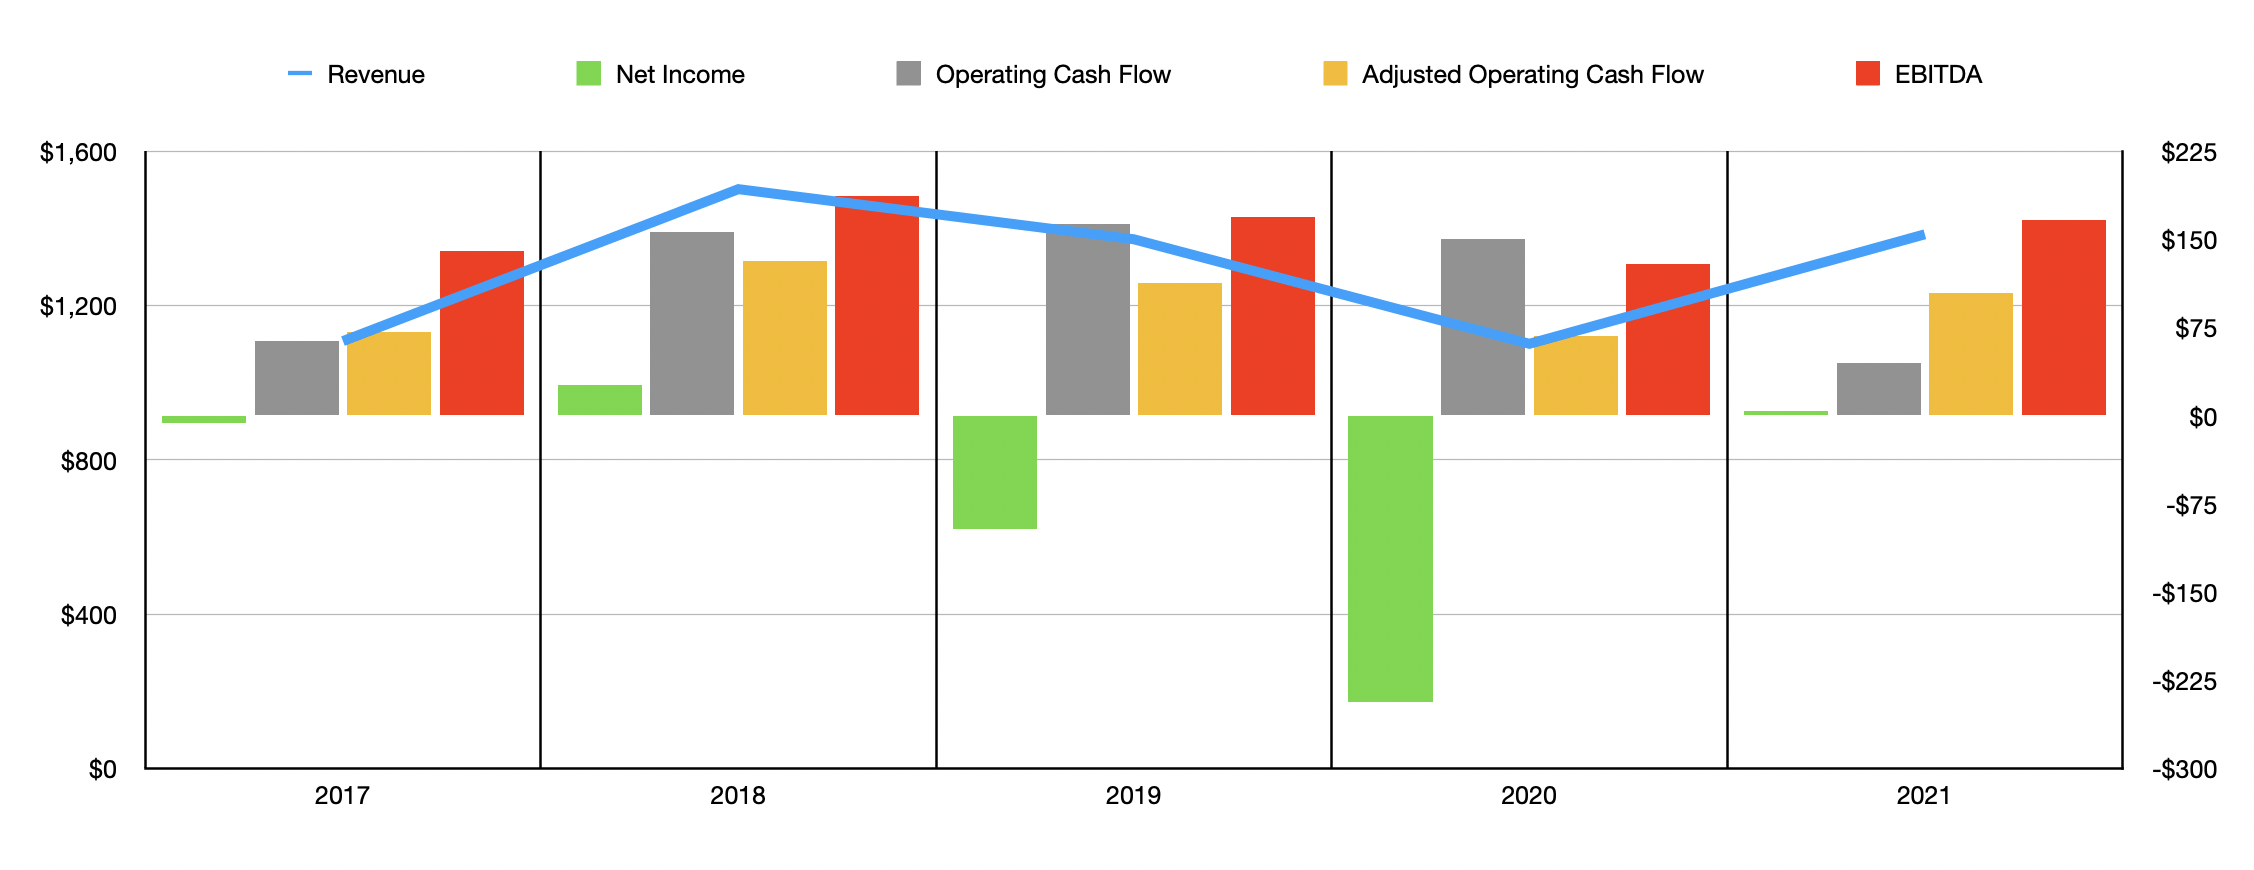
From an operating history perspective, the company’s top and bottom lines have been rather mixed in recent years. For instance, in 2017, sales for the company came in at $1.11 billion. This jumped to $1.50 billion in 2018 before dropping to $1.37 billion in 2019. The COVID-19 pandemic significantly hurt the enterprise, pushing sales down to just $1.10 billion. However, that downturn was short-lived. During the company’s 2021 fiscal year, sales rebounded some to $1.39 billion. According to management, investors should expect sales growth to continue at least in the near term. I say this because, for the firm’s 2022 fiscal year, it’s forecasting revenue of between $1.58 billion and $1.71 billion.
Because of how much of its product is comprised of aluminum, the company does warn that some of its fundamental performance on the top line can vary based on commodity prices. And the company insists that it’s able to pass these price fluctuations onto its customers because of certain contractual arrangements with them. That explains some of the volatility, but not all of it. A big driver of revenue fluctuations from year to year would be the number of units the company sells. For instance, in 2017, the company sold 17 million units worldwide. This number jumped to 21 million in 2018 and declined in 2019 and 2020, eventually bottoming out at 15.2 million. In 2021, units shipped increased slightly to 16.1 million and management is forecasting units sold for 2022 of between 16.4 million and 17.7 million.
Author – SEC EDGAR Data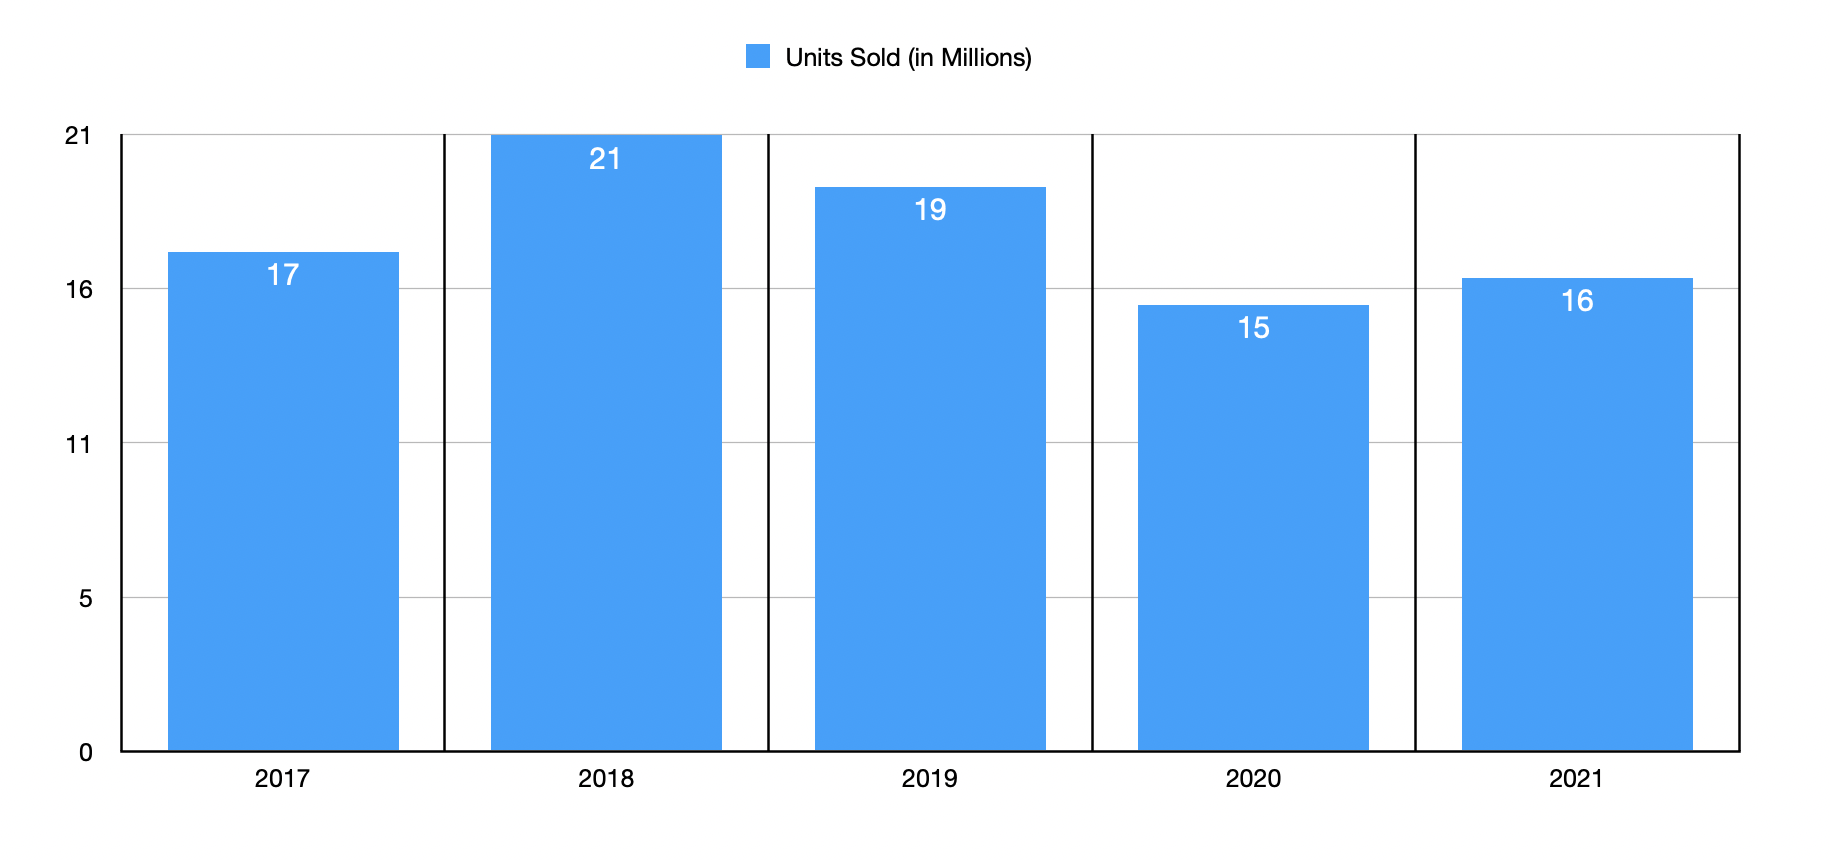
Just as revenue has been volatile, the same can be said of profitability. The company’s net profits have been all over the place, ranging from a low of negative $243.6 million in 2020 to a high of $26 million two years before that. In 2021, the company generated a net profit of $3.8 million. I would make the case that net income is not a very good determinant of the company’s value. Instead, investors should pay attention to other cash flow metrics. For instance, in 2017, the company generated operating cash flow of $63.7 million. This jumped to $156.1 million in 2018, ultimately staying in a fairly narrow range that spanned about $12.7 million through 2020. Then, in 2021, cash flow dropped to $44.9 million. However, if we ignore changes in working capital, it would have come in during 2021 at $104.8 million. Similar volatility could be seen when looking at EBITDA. This metric ultimately totaled $166.7 million last year. That was up from the $129.4 million in 2020 but down from the five-year high of $186.6 million in 2018.
When it comes to the 2022 fiscal year, management anticipates EBITDA of between $160 million and $190 million. Meanwhile, management is forecasting operating cash flow of between $105 million and $150 million. At the midpoint, these cash flow metrics should be $175 million and $127.5 million, respectively. Taking these figures, we can effectively price the company. Using the firm’s 2021 results, the company is trading at a price to operating cash flow multiple of 1.1. As a note, I strip out preferred distributions from operating cash flow to arrive at this calculation. This number drops to just 0.9 if we rely on 2022 estimates. Meanwhile, the EV to EBITDA multiple of the company should decline from 5.4 if we use the 2021 results to 5.1 if we use 2022 estimates. In addition to being cheap, the company also has leverage that’s not all that high. The net leverage ratio of the company, using 2021 results, is 2.97. And this number drops to 2.83 if we rely on 2022 estimates.
Author – SEC EDGAR Data
To put the pricing of the company into perspective, I decided to compare it to five similar firms. On a price to operating cash flow basis, these companies ranged from a low of 6.5 to a high of 127.4. In this case, Superior Industries International was, by far, the cheapest of the group. Meanwhile, using the EV to EBITDA approach, the range was from 5.3 to 15.4. In this case, only one of the five companies was cheaper than our target.
| Company | Price / Operating Cash Flow | EV / EBITDA |
| Superior Industries International | 1.1 | 5.4 |
| Standard Motor Products (SMP) | 11.1 | 6.6 |
| Tenneco (TEN) | 6.5 | 5.3 |
| LCI Industries (LCII) | 127.4 | 7.7 |
| Visteon Corp (VC) | 46.3 | 13.7 |
| Dorman Products (DORM) | 30.0 |
15.4 |
Takeaway
At this point in time, Superior Industries International seems to offer investors attractive value prospects. The company looks incredibly cheap pretty much any angle you look at it from. Leverage is not all that bad, and management is expecting a robust 2021 fiscal year. Long term, the company’s volatility is somewhat disconcerting. But so long as management continues to do well, there could exist some nice upside.
Be the first to comment