

onurdongel/iStock via Getty Images
There is an old saying that a bird in hand is worth two in the bush. This is especially true with markets experiencing extreme volatility in recent days. I believe Suburban Propane Partners L.P. (NYSE:SPH) is a good safe haven to park your money and earn an 8.5% distribution yield while waiting out the market volatility.
Suburban Propane History
Suburban Propane has an interesting origins story. As the company tells it, in 1928, a couple, Mark and Adele Anton, wanted to build a home in West Orange, N.J. To their surprise, there were no gas lines near their new house, so they learned to cook with propane gas. One day, Mr. Anton was thumbing through trade journals when he saw an advertisement for propane gas home installations from Rock Gas, and he ordered the equipment for his home. Soon, he realized others in the developing suburbs might enjoy the same convenience of cooking with propane gas, and so he ordered more equipment and installed them in the neighbourhood. Thus, the Suburban Gas Company was born.
From these humble beginnings, Suburban Gas expanded, first as a wholesale customer for Phillips Petroleum’s propane gas distribution plants in New Jersey, then later, the company acquired Phillips’ 13 eastern propane properties and combined it with the assets of Suburban Gas Company to form the Suburban Propane Gas Corporation. Through mergers and acquisitions in the following decades, Suburban Gas expanded to California, Maryland, Texas, and the Midwest. Today Suburban Propane is a Master Limited Partnership serving approximately 1.1 million residential, commercial, industrial and agricultural customers through more than 668 locations in 41 states.
MLP 101 – The Basics
Before delving into Suburban’s business and valuation, I think it is important to give a brief overview of master limited partnerships (MLPs), for those investors unfamiliar with the structure. An MLP is a limited partnership whose interests (“units”) are traded on public exchanges, like common stocks. MLPs primarily engage in active businesses in the energy industry. A limited partnership has one or more general partners who manage the partnership; and limited partners, who provide capital to the partnership but has no role in its management. When an investor buys units in an MLP, she becomes a limited partner.
Investing in MLPs may have important tax implications. For example, MLPs, like all partnerships, is a pass-through entity which pays no tax itself. The unitholder, as a limited partner, is treated for tax purposes as if she is directly earning his share of the MLP’s income. Hence, each unitholder is allocated a proportionate share of the MLP’s income, gains, deductions, losses, and credits. This is reported annually on the K-1 form. Distributions is considered a return of capital and are not taxed when received. Instead, the basis in the partnership units are lowered by the amount of the distribution.
Investors interested in MLPs can go to the Energy Infrastructure Council for more information and should consult with a tax professional before investing, as individual tax situations may differ.
The Propane Distribution Market
Suburban engages in the retail marketing and distribution of propane, renewable propane, fuel oil and refined fuels, as well as the marketing of natural gas and electricity. SPH’s primary business is in propane marketing and distribution, where it generates over 90% of its gross profits.
Figure 1 – SPH Gross Margin segments (Suburban Propane)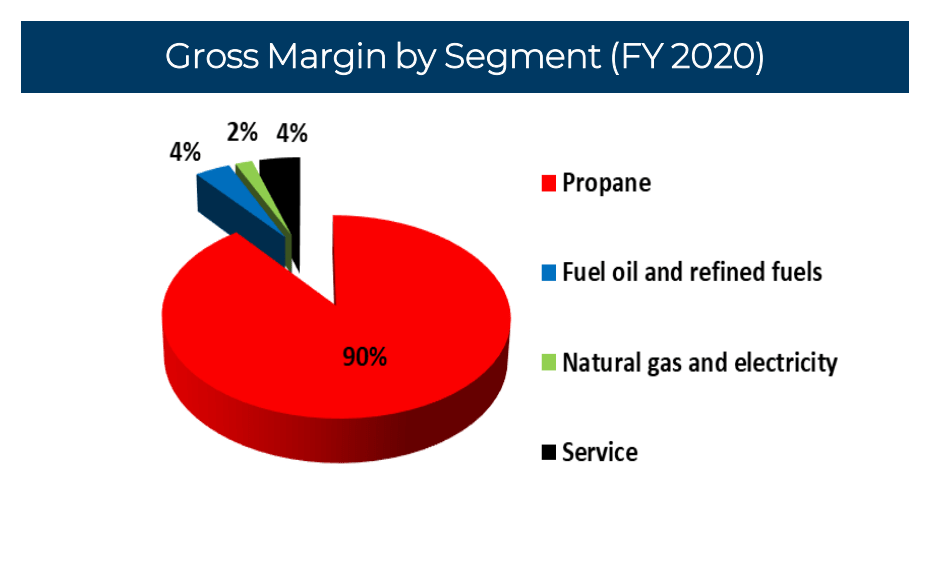
Propane is primarily used for heating, cooking, and agricultural purposes. Historically, approximately 5% of a household’s energy use comes from propane (Figure 2).
Figure 2 – Household energy source (Suburban Propane)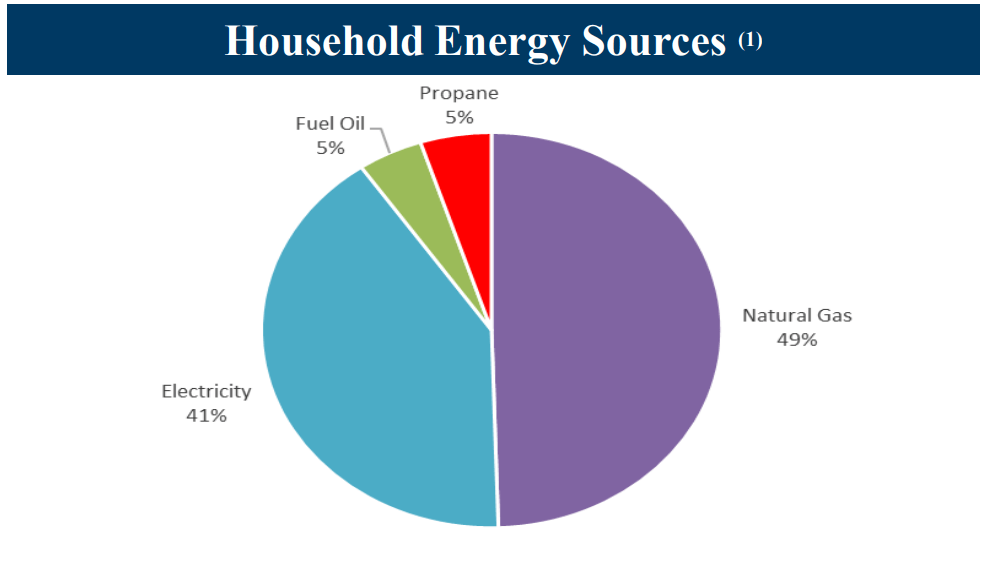
A common use case is the fuel for domestic barbeque grills that can be found in backyards all across America (Figure 3). Larger retail tanks can also be used to fuel water heaters, stovetops, dryers, and even backup generators.
Figure 3 – A common use case for propane gas is propane tanks for bbq grills (Amerigas)
The US propane distribution market is highly fragmented, with the top 4 players (Suburban is # 3 with 5% market share) commanding only 26% market share. Aside from the top 4 players, there are over 5,000 independent retailers distributing propane gas (Figure 4).
Figure 4 – SPH has 5% market share (Suburban Propane)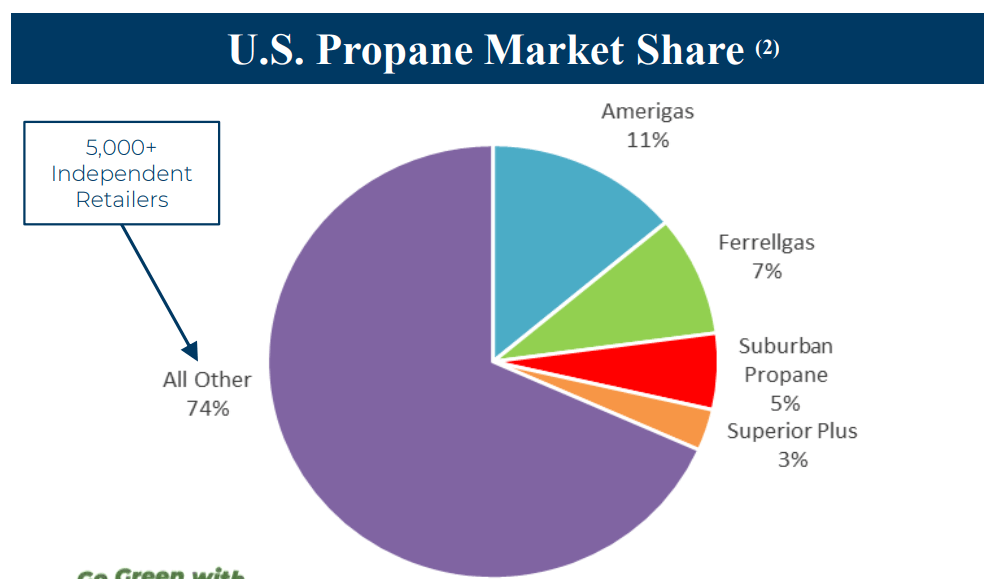
Suburban Business Analysis
As with all commodity businesses, I typically begin my analysis by looking at the gross profit and gross margin, as commodity revenues are volatile and dependent on external factors. SPH’s gross margin and gross profit are shown in Figure 5. As we can see, gross margin for the propane business is highly attractive, averaging 50% over 30 years.
Figure 5 – SPH has strong gross margins (created by author with data from roic.ai)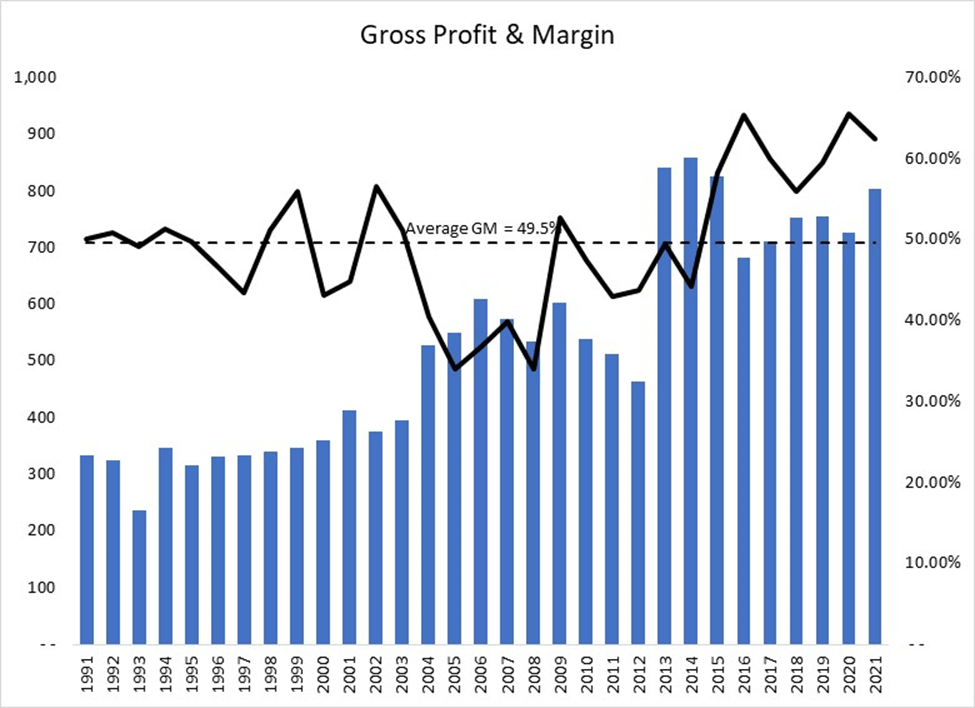
Next, I want to analyze operating income, to see how the company performs, especially during economic downturns. Figure 6 shows SPH’s historical operating margins. While operations were volatile before 2002, they have been very stable during the past decade, with average operating margins of 10.9%. Going through the company’s 10-Ks, 2012 was negatively impacted by several one-time expenses related to its acquisition of Inergy L.P.’s retail propane operations for $1.8 billion.
Figure 6 – Operating margins have been very strong. (created by author with data from roic.ai)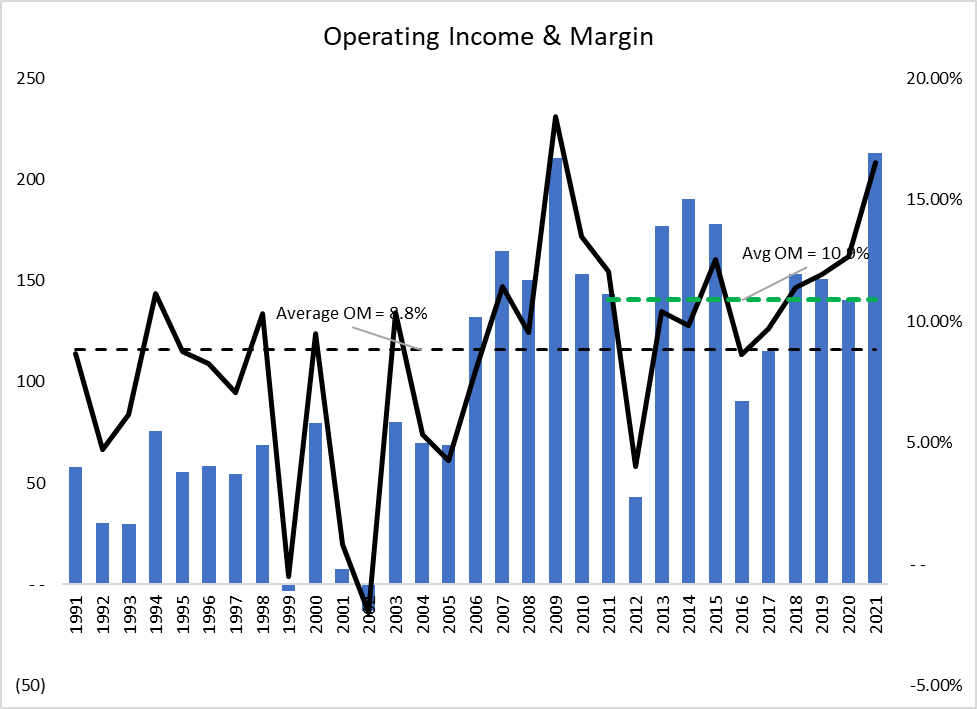
Stability of Distribution
Since my investment thesis on SPH hinges on its attractive distribution yield, we must analyze its history of distribution payments to get a sense of its stability and growth. Figure 7 shows Suburban’s quarterly distributions since inception.
Figure 7 – SPH’s distribution steadily grew until 2017. (Koyfin)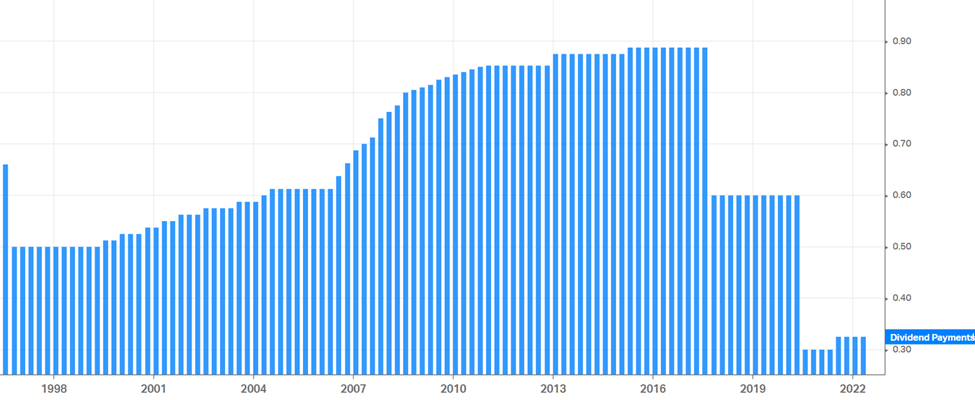
From an annual distribution of $2.25 in 2002, the quarterly distribution was steadily increased to an annual $3.55 in 2017 (at an implied 3.1% CAGR), before it was abruptly cut to $2.40 on October 26, 2017. What happened?
Management’s explanation for the distribution cut was to blame changing customer demands and two abnormally warm winters in a row. From our analysis of the gross and operating margins above, I have some doubts about this explanation.
For example, 2016 gross profit was $683 million, while 17% lower than 2015’s $825 million, it came with a 65% gross margin, hardly a disaster. Similarly, in 2017, SPH had gross profit of $711 million on 60% gross margin.
A simpler explanation could be that management had increased the distribution too aggressively in prior years, and left little margin of safety for normal business fluctuations such as weather.
This hypothesis is confirmed by the following analysis that looks at operating cash flows less distributions and capex. As can be seen in Figure 8, although the core business is highly profitable with strong operating margins, operating cash flows were not sufficient to cover the increasing distributions for 6 of the 7 years from 2011 to 2017. Only after the distribution cut in 2017 did this metric improve.
Figure 8 – CFO vs. Capex & Distributions (created by author with data from roic.ai)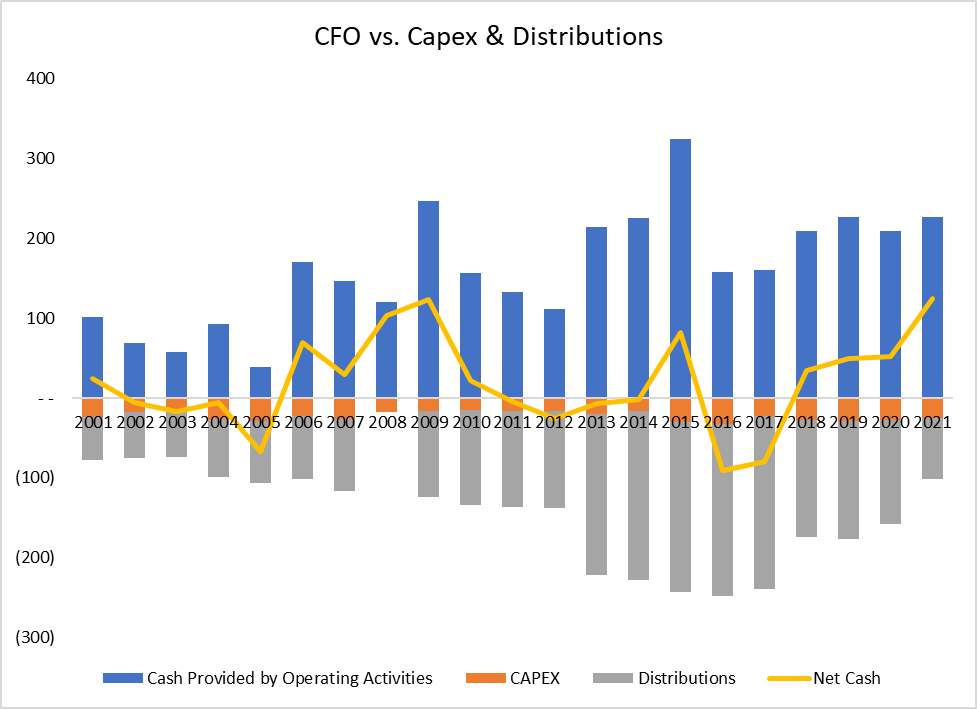
Fortunately for current and prospective investors, it appears the distribution cut enacted in 2017 rightsized the distribution relative to the cash flow from operations and capex.
Furthermore, there was a subsequent distribution reduction on July 23, 2020, this time due to Covid uncertainty, bringing the annualized distribution down to $1.20. Since the second cut, management has begun increasing the distribution again, beginning in July of 2021, now targeting an annual $1.30.
Valuation
While distribution cuts are concerning, our analysis above does confirm that the current distribution of $1.30 / sh is well covered. The next step in our analysis is to value the distributions and arrive at an estimate of intrinsic value for LP units.
In the case of Suburban, I believe a dividend discount model is the most appropriate method to value the units. SPH’s propane distribution business is a mature and stable business that should grow at roughly the same rate as GDP, barring some technological advance or change in energy consumption patterns.
I estimate an equity cost of capital of 9% for Suburban. While the business is mature and stable, SPH is highly indebted ($1.1 billion of long-term debt; Consolidated leverage ratio of 3.87x), hence a higher than normal equity cost of capital is warranted.
As we saw above in the distribution analysis, a 3% distribution growth CAGR appeared too aggressive for SPH in the early 2000s. Hence I believe going forward, management will be more conservative in raising the distribution, so I will use a 2% distribution growth rate in the model. Using these two simple assumptions, I arrive at a per unit value of $19, indicating modest upside in the unit value (Figure 9).
Figure 9 – A simple dividend discount model for SPH units (created by author)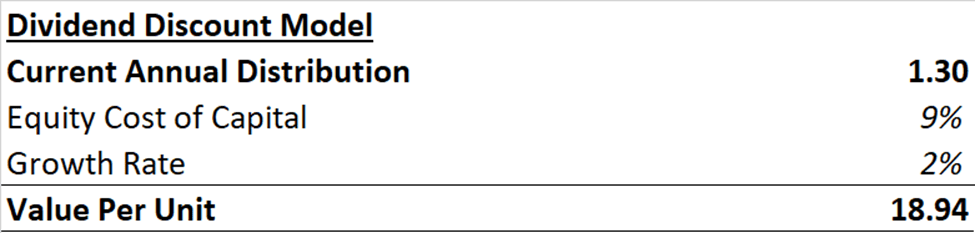
Key Risks To The Suburban Story
While we believe Suburban Propane Partners is a good investment at current prices, it isn’t without risks. Below, I will lay out some of the key risks worth considering.
Highly Levered Balance Sheet
As we mentioned briefly above, Suburban is a highly leveraged company with $1.1 Billion in long-term debt (Figure 10). A large part of the debt was incurred in 2012 to fund the Inergy transaction. Having a large debt balance could be detrimental to Suburban, particularly if the economy experiences a downturn as debt interest and principal payments must be paid to avoid a default.
Figure 10 – SPH long term borrowing profile (Suburban Propane)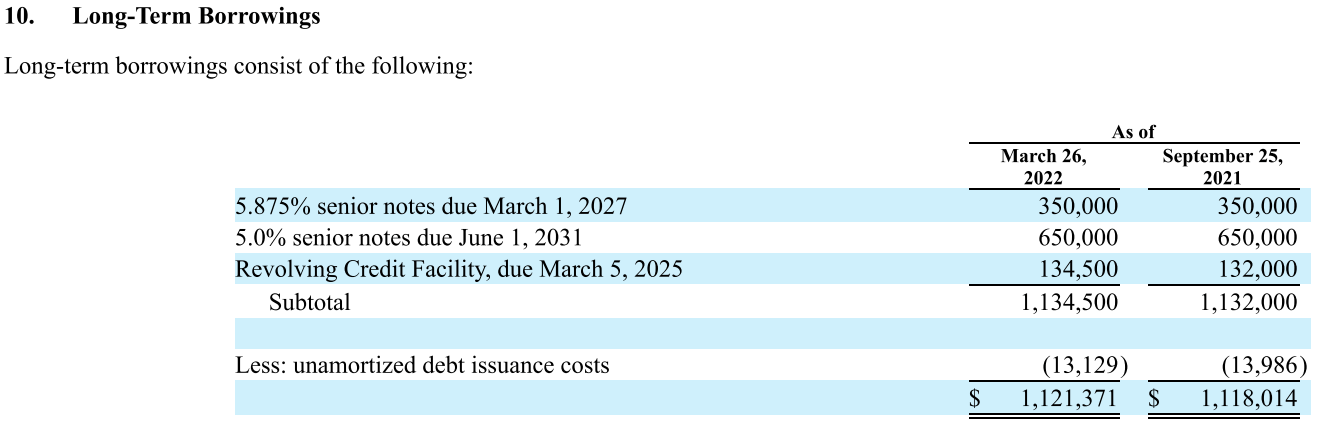
Debt could also have onerous covenants that constricts SPH’s flexibility in responding to changing business environments. In many instances, when the business environment gets difficult, companies must cut their distributions in order to conserve cash and satisfy debt covenants. The leverage overhang was likely one of the primary drivers for a distribution cut in 2017 and 2020. For Suburban Propane, there are two key covenants: consolidated interest coverage > 2.5x and consolidated leverage < 5.75x. At the moment, both of these covenants are well covered and unlikely to be triggered.
Finally, as it is unlikely that Suburban can generate sufficient cash flow to repay the debt in its entirety before maturity, there is a risk that SPH may not be able to refinance the debt, or may refinance the debt at less favourable interest rates. For example, if the prevailing interest rates in 2027 are higher than when the debt was incurred, then the 5.875% senior notes may need to be refinanced at higher interest rates, increasing the interest burden to the company.
Volatile commodity prices
As with all commodity businesses, Suburban is highly exposed to fluctuating commodity prices. Fortunately, SPH appears to be very competent in managing margins, as we have demonstrated above in our gross margin analysis. The following figure is from a recent investor presentation for SPH, and shows that Suburban Propane has been able to maintain strong unit margins despite fluctuating propane prices.
Figure 11 – SPH has strong unit economics (Suburban Propane)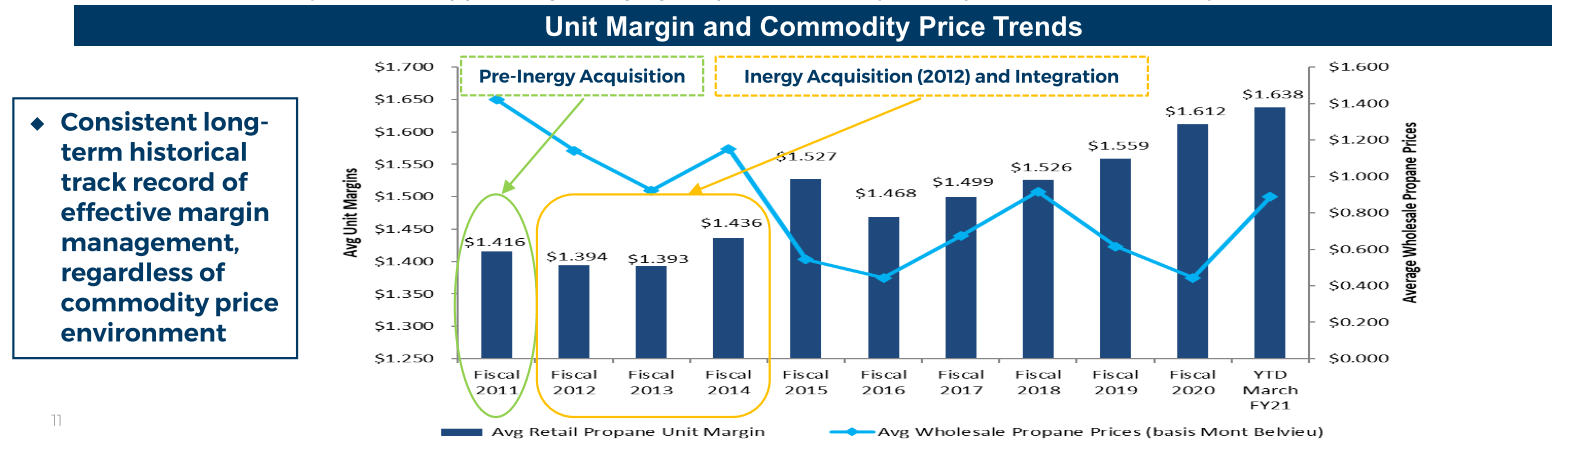
Ongoing Energy Transition
Finally, a key risk in our opinion is the ongoing energy transition to alternative energy sources such as solar and wind. We are already seeing the impact of the energy transition in many industries, such as electric vehicles gaining mainstream adoption and households installing solar panels to generate electricity. While in the near to medium (1 to 5 years), I do not believe the energy transition will have a large impact on Suburban’s propane distribution business, in the long run (10-20 years), it is inevitable that propane consumption will decrease as consumers transition to alternative energy sources.
Recent Price Action & Technical Analysis
Year to date, Suburban Propane has returned 4.6% in price appreciation and $0.65 / unit in distribution, for total returns of approximately 9%. This has outperformed the S&P 500 Index’s -18% return YTD with a nominal 1.5% annual dividend. Suburban Propane has also outperformed it’s utility peers, with the Utilities Select Sector SPDR Fund (XLU) returning -3.6% in price YTD and sporting a skinny 2.9% dividend yield.
Technically, we see that SPH is trading inside of a wide up-channel from the Covid lows. It has recently tested the lower end of the channel around $14.50.
Figure 12 – SPH bouncing from uptrend (created by author with chart from stockcharts.com)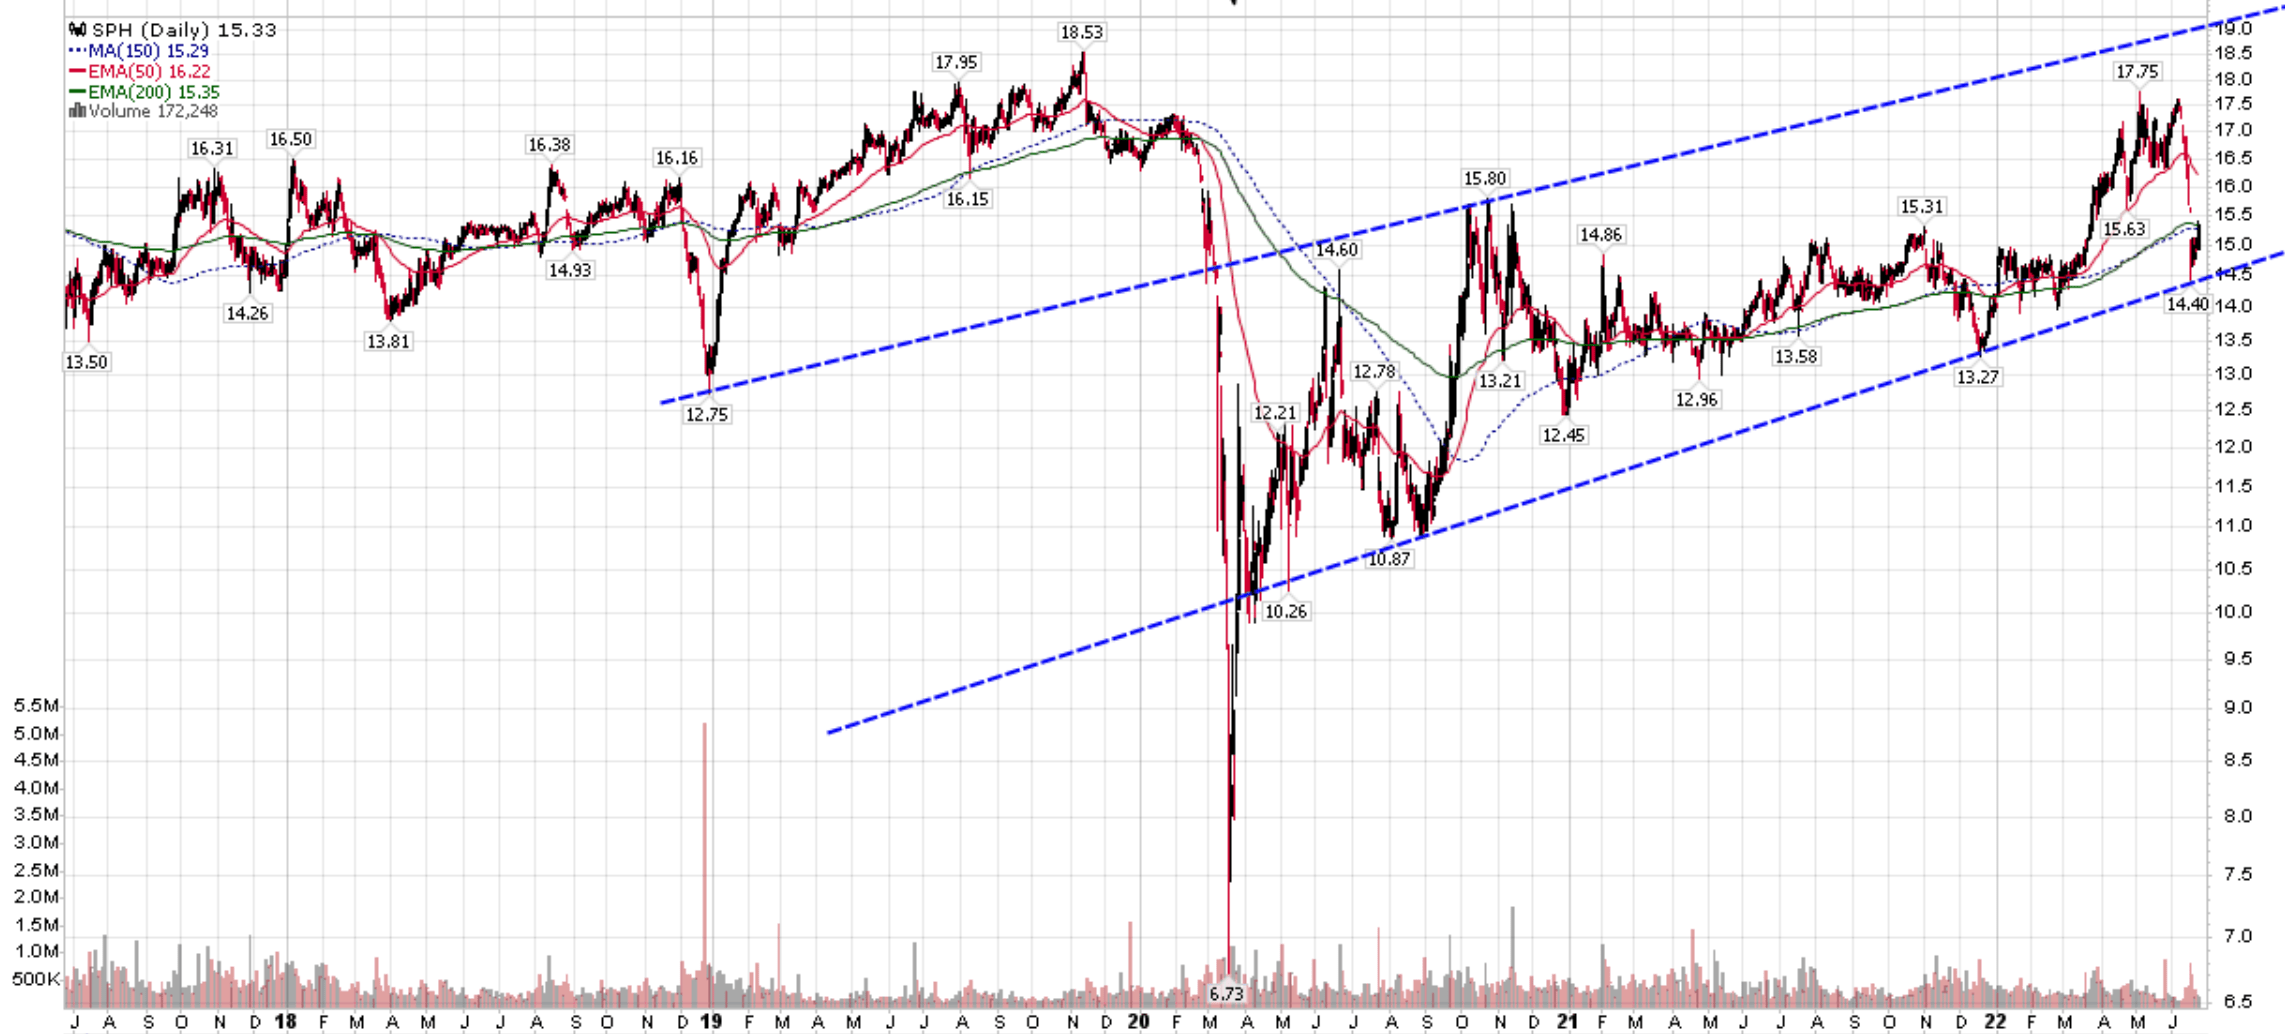
Conclusion
In the current time of uncertainty, I believe the Suburban Propane Partners L.P. is an excellent investment opportunity, with an 8.5% distribution yield that appears safe from my analysis. YTD, SPH has vastly outperformed the S&P 500 and its utilities peer group and I expect the outperformance to continue as investors continue to look for safe havens while equity markets experience volatility. I would recommend investors accumulate units of SPH, as it is currently trading at substantially less than my estimate of intrinsic value.
Be the first to comment