

sankai

Please excuse the excel spreadsheet, but it’s the easiest way for me to track the data and keep it logical. Not having a publishing department or an editor, I’m left to update the data, pound out the blog post, and move on to the next task.
Readers should note the recovery in “value” from 9/30/22. Those YTD returns as of last night had to be re-checked. It was surprising even as crude oil has been relatively flat.
Also surprising was the outperformance of “equal weight” versus market-cap weight. To hedge the 2001-2002 type of market risk, RSP was added to client accounts in 2020 and 2021, managing the capital gains within taxable accounts, and by 12/31/21, RSP had made it into the top 10 client positions.
RSP has done its job this year exactly as hoped. Now waiting for the breakout in the Russell 2000 (IWM) and biotech has been like Waiting for Godot i.e. much talked about, but never seems to arrive.
Two data points to note:
- Looking at the middle section of the spreadsheet, i.e. the annualized returns, large-cap growth (the first line) is still out of whack in terms of above-average returns, with the rest of the large-cap value down through small-cap value asset classes. While large-cap growth, which is really dominated by mega-cap stocks, given their influence, large-cap growth could tread water for ’23, even as the other asset classes outperform.
- Note too the S&P 500 (SPY) versus RSP and QQQ versus the QQQE: while the SPY improved its YTD return 8.8% from 9/30 to 10/15, the RSP improved its return 11.5%, so the RSP is outperforming in both up and down periods this year. QQQ improved its return 559 bps from 9/30/22 to 11/15, while QQQE rose 9.38% or 938 bps.
Summary/conclusion: It was long anticipated the “non large-cap growth” asset class would eventually assert itself in terms of market leadership and revert to the mean (so to speak) but in 2022, it just did less worse than the S&P 500 and the mega-cap stock space, rather than positive returns, but that’s all 2022 offered really across US domestic, international and emerging markets. Everything was negative in 2022 (so far) except energy.
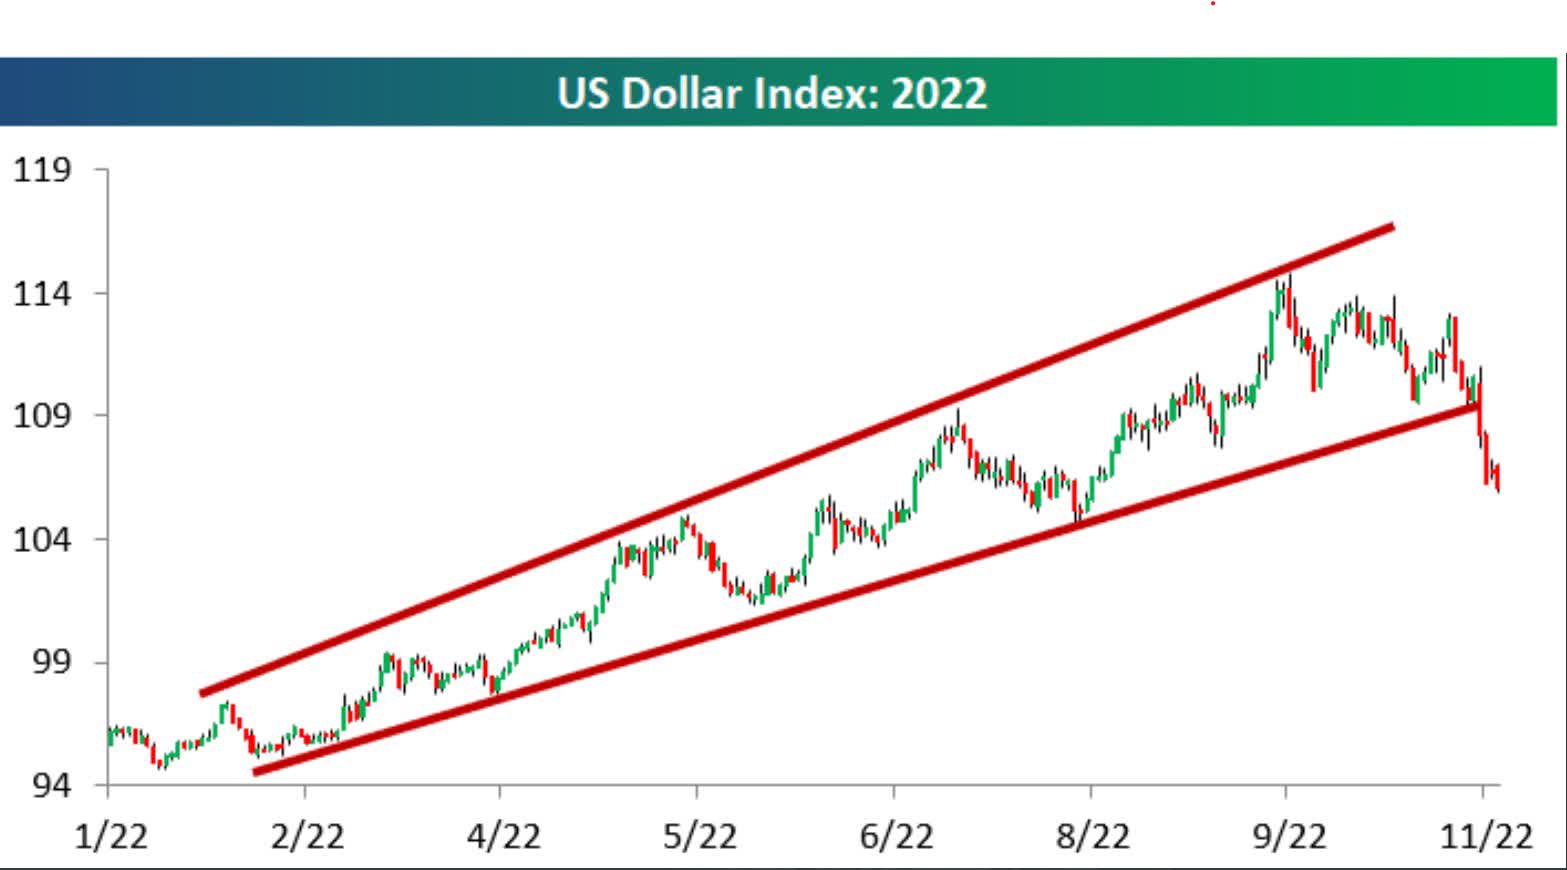
The sudden dollar weakness has driven good volume in some of the EM ETFs like EMXC and the Vanguard ETF like VEU which is the FTSE All-World Ex-Us ETF. The dollar looks broken as this Bespoke chart from yesterday indicates. Pay attention to your favorite Non-US, International and EM funds and ETFs.
International has lagged from a return perspective for some time, taking the asset class as a whole.
Take all this with substantial skepticism. Past performance is no guarantee of future results. While the style box update arrives every 6 weeks, it may contain different emphasis each time. This information and data may not be updated.
Thanks for reading.
Editor’s Note: The summary bullets for this article were chosen by Seeking Alpha editors.
Be the first to comment