

Hyatt (H) is a global upscale and luxury hotel chain owner. They have about 900 properties in their portfolio with a combined total of 227 thousand rooms. Over fifteen thousand of those rooms are directly owned (or leased) and operated by Hyatt for its own risk & return. This may seem like a small number compared to the overall number of rooms, but that statistic is much more extreme for its peers. Major competitors Marriott International (MAR) and Hilton (HLT) own a much smaller percentage of their properties. The idea is that an asset-light model allows for higher returns on capital and faster expansion. That is also exactly where the opportunity lies as Hyatt also owns a lot of valuable, but underappreciated real estate.
I must admit that liking Hyatt for its real estate is not very novel and the company itself made quite clear how much it wants to sell in the next years. Still, I think that there is a compelling case to be made for the low leverage, strong EBITDA/cash flow generation, and growth that Hyatt’s brand managed to produce.
Introduction
A notable long-term trend among hotel chains was to sell their real estate and pursue the model of franchising or managing hotels for a fee. For a long time Hyatt hung on to a lot of real estate but is slowly moving to the capital-light model.
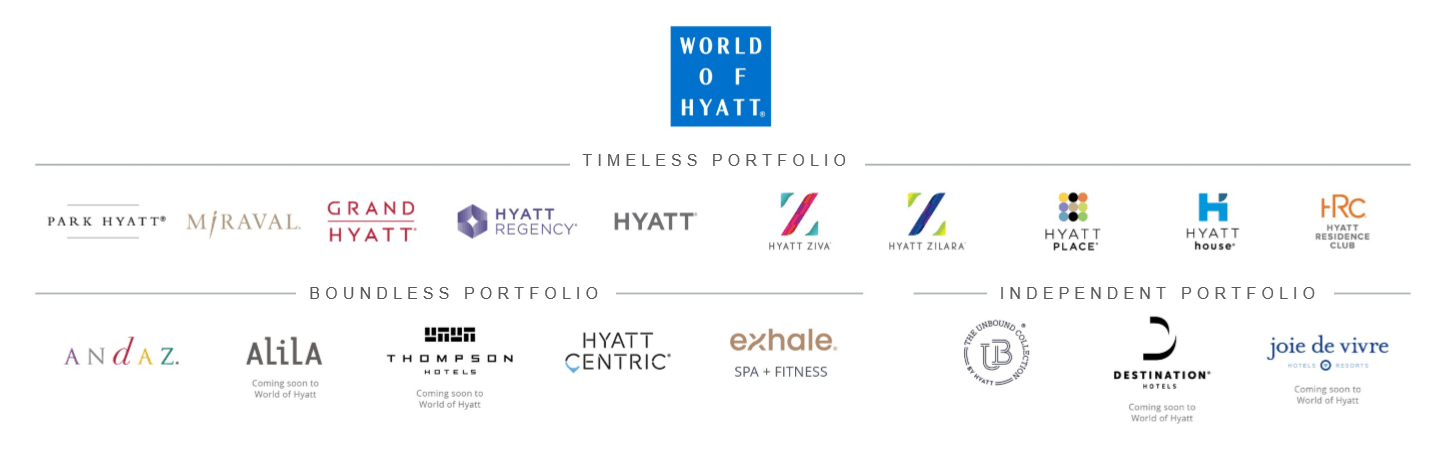
Hyatt manages a decent selection of brands most of which many have the Hyatt name. The company has a strong presence on the American continent with two thirds of its rooms, and Asia-Pacific comes in second with one fifth of rooms.
Hyatt brands. Source: Investor presentation.
For individual hotel owners it is attractive to let hotels be managed by a larger chain as these have a global brand which helps with pricing and global marketing coverage which also helps to negotiate favourable deals with travel agencies, including OTAs like Booking Holdings (BKNG). The upside for Hyatt is the revenue share and performance fees, which are approximately 5% of a single hotel’s revenue.
Company performance
Operationally, there are two things that matter most, which is room growth and RevPAR (revenue per available room). Hilton, Marriott and Hyatt each have a sizeable pipeline to grow rooms and have grown their room count in the past as you can see in the figure below.
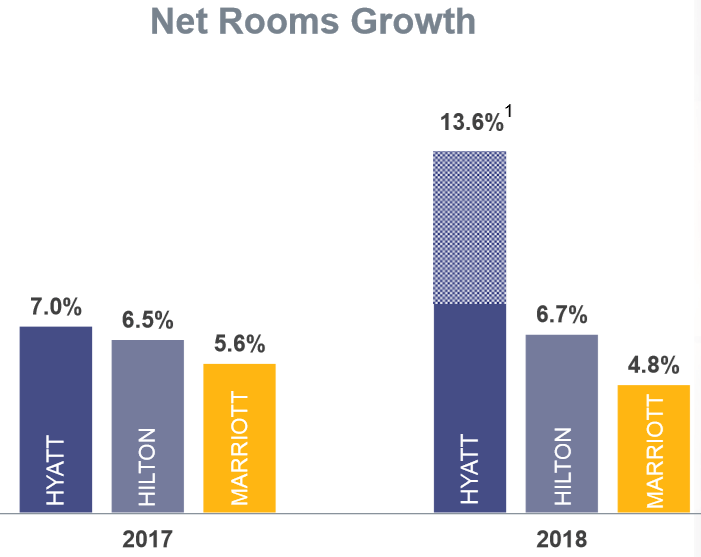 Note 1: excluding the Two Roads acquisition, Hyatt’s net rooms grew 7.2% in 2018. Source: Hyatt 2019 Investor Presentation.
Of course, every hotel will always present itself as the fastest growing chain and I’m sure that Marriott and Hilton would either choose different peers, focus on absolute room growth or take a slightly different metric instead. My point is that growth, in relative terms, is roughly the same, maybe a bit higher for Hyatt which would make sense as it is the smallest player among the three. The picture is the same when we look at the pipelines of the companies. Hyatt’s last pipeline update was 101 thousand rooms, or a potential growth of 44.5% versus its current franchised/managed room count. Marriott and Hilton have similar pipelines of 36.3% and 39.8%, respectively.
On a revenue per available room-basis, Hyatt has not been doing that great in 2019 or in Q4 with comparable RevPAR of -0.5%, but neither has Hilton which underperformed Hyatt in Q4 with a RevPAR of -1%. Marriott is a different story as it has not published Q4 results yet, while most pain was in Q4 for both Hyatt and Hilton. Hyatt cited Hong Kong as a source of underperformance.
Adjusted EBITDA
Usually it is smart to ignore ‘adjusted x’ earnings metrics that companies produce. This time, however, I would like to spend some time at Hyatt’s Adjusted EBITDA, displayed in the table below.
There are many items Hyatt wants to adjust for and in most cases, I find that justified. Take for example costs and reimbursement revenues for managed and franchised properties. This is an item where Hyatt does not have any economic exposure except small timing differences of cash flows and earnings. It is quite misleading to count the reimbursement as revenue to begin with. Gains on real estate are also a great item to filter out.
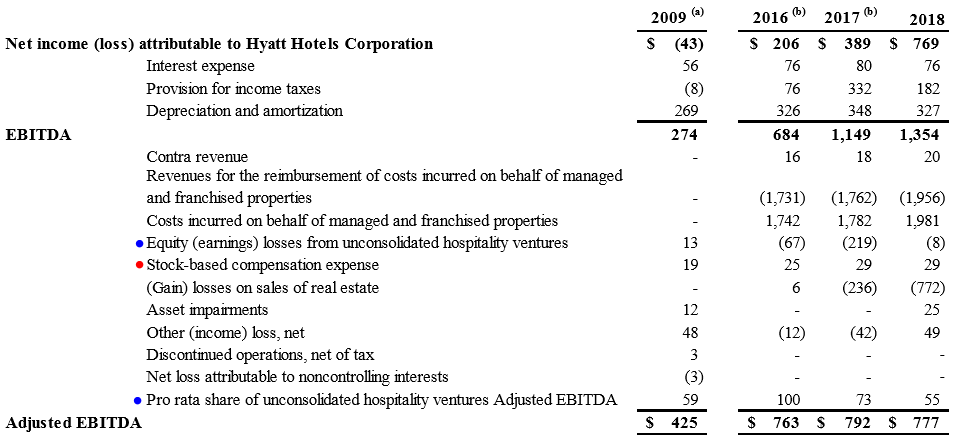
Hyatt reconciliation of Non-GAAP to GAAP Financial Measures Net Income, EBITDA, Adjusted EBITDA ($ in millions). Source: Hyatt Investor Presentation. Blue and red dots added by author for emphasis.
Another notable adjustment is that the company adds EBITDA from unconsolidated investments and subtracts earnings (both marked with blue dot). Still that is an ambiguous item as it is perhaps also reasonable to add unconsolidated debt to EV or perhaps to filter it out altogether and just use equity value on balance sheet.
The one item I will adjust the adjusted EBITDA for is stock-based compensation as this is an unambiguous real expense to shareholders. From hereon, when I speak about adjusted EBITDA, I am referring to adjusted EBITDA as defined by the company minus stock-based compensation. For Hyatt that adjusted EBITDA was $748m in 2018 and $719m in 2019.
Peers & Asset sales
Another reason behind bringing adjusted EBITDA up is so we understand the dynamics behind the numbers, enabling us to proceed with comparing the EBITDA of Hyatt with Marriott and Hilton. All three have a roughly similar way of calculating adjusted EBITDA, except that Marriott also adjusts for merger-related costs and charges, which I added back to keep it consistent with Hyatt.
The company expects to sell another $1bn of assets ($0.5bn of which is already announced), which, in its March 2019 investor presentation, said it would do at EBITDA multiples of 13x to 15x. The precise remaining amount of assets is to sell stands at $1.04bn and dividing that by 14 comes down to an implied EBITDA loss of $74m in the owned properties segment, equal to about 22% of the segment EBITDA. However, we should assume that Hyatt continues to receive revenue from managing these assets. I estimate the revenue take rate at 4%, based on intra company eliminations for base and incentive revenue. In 2019, owned & leased revenue was $1,848m, 4% of 22% of that is $16m remaining revenue for Hyatt. If we also suppose that the EBITDA margins are the same as they are for the rest of the company, the expected EBITDA is $14m. This is reflected in the asset sale impacts on H.
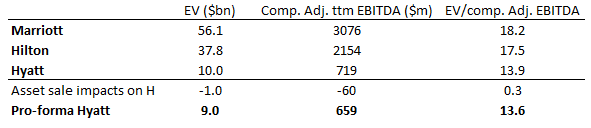
Source: author’s own calculations based on available ttm figures. The ND portion of EV is taken from Seeking Alpha. Market values are based on intra-day prices of the 24th of Feb.
As the calculation in the table shows, Hyatt looks cheap on trailing adjusted EBITDA, also after shedding more assets – or perhaps especially after shedding more assets. Considering that Hyatt has shown solid growth in the Managed & Franchised segments over the past years and has a good growth outlook, the comparison makes Hyatt look favorable. This is further illustrated by the chart below which shows that despite asset sales totalling about $1.9bn from 2017 to 2019 ($1.45bn from slide 10 in this investor presentation plus $0.45bn in Q3 2019), Hyatt has been able to keep its EBITDA stable.

(Grouped) segment EBITDA in USD mln. Source: author’s own calculations based on Hyatt’s reporting.
If we just look at the valuation difference between Hilton and Hyatt, then Hyatt could be worth $2.5bn more at an EV/EBITDA of 17.5, translating to an equity upside of 25%-30%.
There is still one caveat, EBITDA is least useful for the Owned & Leased segment as this segment depreciates hotel furniture and other equipment that needs to be replaces every so many years. I would therefore like to zoom in on the cash flow generation of Hyatt.
The company doesn’t explicitly forecast free cash flow, but we can use the EBITDA reconciliation below and capital expenditure guidance to make our own educated guess.
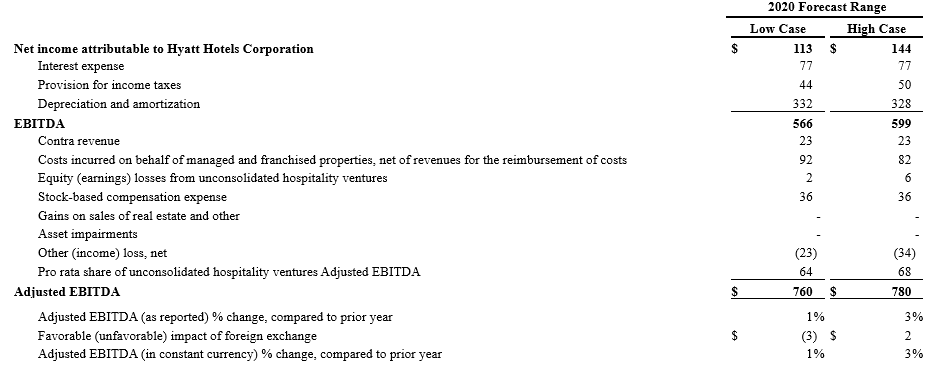
Source: Hyatt Q4 2019 release.
If we start with $770m adjusted EBITDA, subtract stock-based compensation of $36m, taxes ($44m), interest ($77m), and the CapEx outlook of $250m, we are left with $363m. This represents a FCF yield of 4.2% on the $9bn market cap. I don’t think that’s too bad, especially considering that a lot of the CapEx will be spent on driving the 6.5%-7% room growth Hyatt expects in 2020. Last year only $93m was spent on maintenance related CapEx and a further $137m on enhancing existing properties (which will become a less burdensome item as more properties are sold). Shedding assets improves the cash flow yield further in my view.
To get back to the growth component, Hyatt’s 2020 outlook forecasts -0.5 to 1.5% RevPAR growth, adding that to room growth, we have a total growth of the base revenue potential of 7.5%. This looks like an attractive level to me.
Longer term, I think that it is fair to expect a long-term RevPAR equal to inflation (let’s take 2%), add to that the room growth of 6%-7% which can be fuelled by the pipeline for years and we have a solid growth case on our hands that also generates cash and sheds assets to buy back shares. Among its peers, Hyatt is clearly the growth-at-a-reasonable-price-play. Hyatt also has a positive tangible book value per share of $28.9, versus steeply negative P/TB values for Hilton and Marriott.
Real estate
The book value, still doesn’t fully credit the value of the real estate. Because real estate is depreciated, the gross balance sheet value is more relevant than the net balance sheet value, in my opinion. At Hyatt this adds up to about $4.5bn (at the end of 2018, disregarding the positive value of furniture and other equipment). Another datapoint we have is the realized gains, which point to values that are much higher still. If we take as an example the September sale which brought in about $460m, of which about $375m was booked as ‘gain on sale’, we can tell that the property sold for 5 times book value (460/(460-375). A similar calculation for 2018 shows that real estate sold for 2.3x book value in that year.
 Pool area of Grand Hyatt Seoul, which was recently sold. Source: Booking.com
Of course, Hyatt cherry-picks what it will sell so these sales are do not necessarily represent the portfolio. I think that at a minimum, the portfolio is worth $5bn, which could easily prove to be $6bn or more. Many of Hyatt’s properties are located in city centres of major cities, such as the Park Hyatt in Paris. Paris has quite severe building restrictions making land in the city centre very valuable and this has pushed real estate prices up for the past years for that reason. Hyatt bought the property 14 years ago, and I have no doubt it is worth substantially more today than it was back then based on the market.
Below is the Americas property list of Hyatt. As most American readers will see, many properties are located in attractive areas or cities that have done well over the past years.
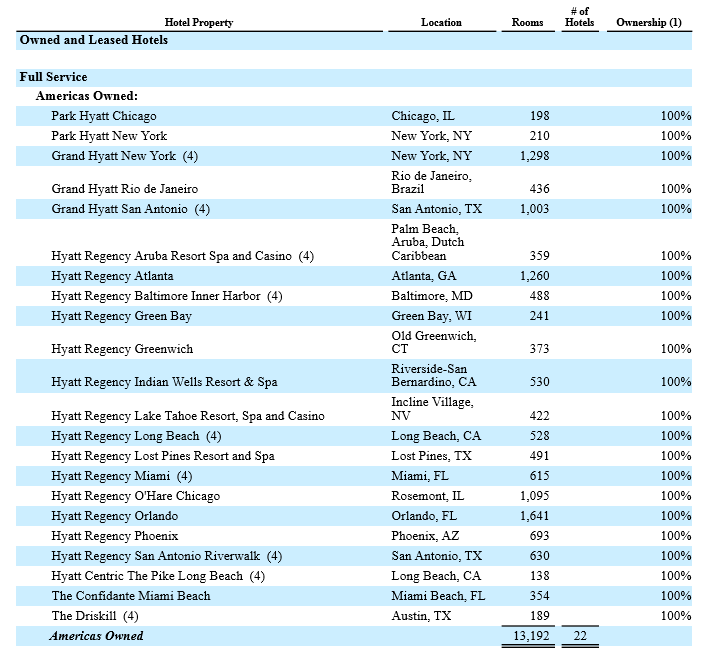
Source: 2018 10-K.
If we take another approach to the valuation of Hyatt, one could argue that over 50% of the stock price consists of real estate value while the brand and hotel operating know-how are the company’s most important properties. From a financial perspective, it is almost a missed opportunity that Hyatt has such modest leverage compared to peers as its balance sheet is great collateral for cheap financing.
Coronavirus troubles
The one thing that keeps me from touting Hyatt as an amazing investment is the coronavirus which will have a direct negative effect on the bottom line of Hyatt in 2020. I think it is quite probable that even as other stocks shake-off the troubles from the coronavirus, Hyatt will still be hurt by a decline in global tourism and business trips. I think that we will see great buying opportunities ahead for investors with a longer term view once the stock faces more serious declines.
Final thoughts
The stock has done well right after its recent Q4 earnings release. I think that this is justified as the company has shown it is unambiguously back to EBITDA growth despite asset sales. In my view, Hyatt has considerable long-term upside as they are slowly selling their valuable real estate. Opportunistic investors could do well by buying this stock once more financial pain from the coronavirus is priced into the stock.
Disclosure: I am/we are long BKNG. I wrote this article myself, and it expresses my own opinions. I am not receiving compensation for it (other than from Seeking Alpha). I have no business relationship with any company whose stock is mentioned in this article.
Be the first to comment