


Emrah Onder/iStock via Getty Images
Star Bulk Carriers (NASDAQ:SBLK) has been one of the top performers in the transportation industry and marine subsector over the last 12 months, but a reversal lower could be approaching. Several months ago, many of my momentum formulas were signaling the high probability of flat to higher pricing. However, some cracks are appearing in the technical picture. In addition, rising interest rates in the macroeconomy, tanking retail sector stocks in 2022, and noteworthy slippage in the marine shipping indexes like the Baltic Dry Index are worrisome.
Star Bulk is a shipping firm, engaged in the ocean transportation of dry bulk cargoes worldwide. The company’s vessels transport a range of commodities including iron ores, coal, and grains, as well as minor bulks, such as bauxite, fertilizers, and steel products. At the end of 2021, it operated a fleet of 128 vessels with an aggregate capacity of approximately 14.1 million deadweight tons, including 17 Newcastlemax, 24 Capesize, 7 Post Panamax, 41 Kamsarmax, 2 Panamax, 20 Ultramax, and 17 Supramax designs. Star Bulk was incorporated in 2006 and is based in Marousi, Greece.
The Good News
Including dividends, SBLK has gained over +129% for investors over the past year, and this result has been truly terrific vs. a flat transportation sector. Below is a graph of its relative strength.
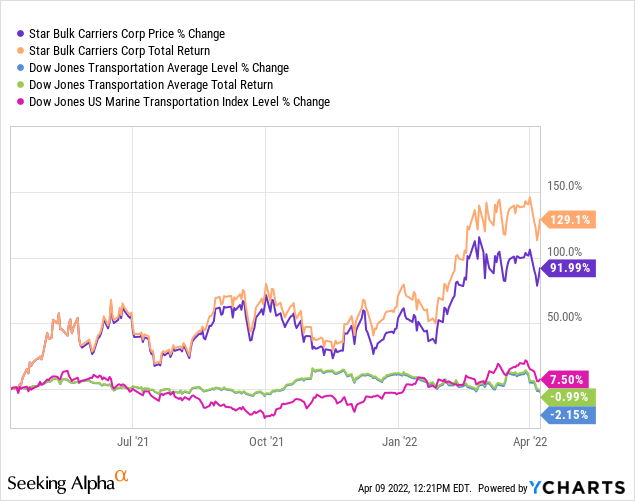
12-Month Performance Chart, YCharts
In addition, over a longer-term span, Star Bulk has been one of the top performers in the dry bulk shipping group. A number of peers and competitors are pictured below on a 3-year graph. Honestly, SBLK’s 3-year total return of +347% trounced general U.S. equity market indexes and nearly every Big Tech favorite over this period.
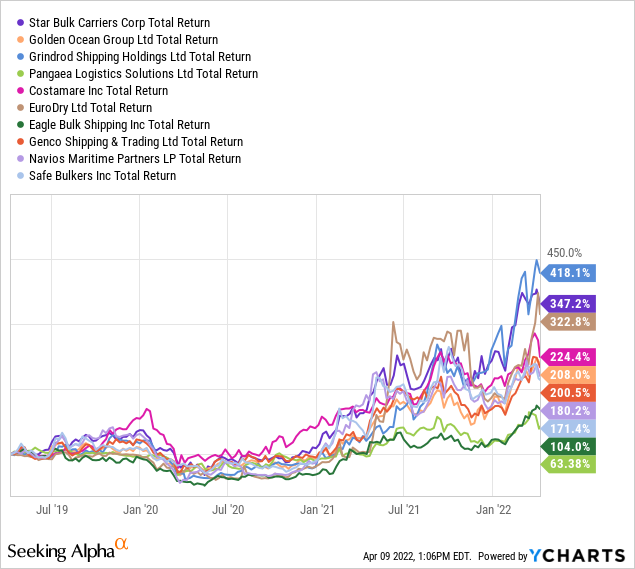
3-Year Performance Chart, YCharts
The Bad News
Expectations for 2022-23 by investors are incredibly high in the shipping industry, but today’s valuation is already preparing for an inevitable downcycle in shipping rates and volumes. The best time to buy shippers is during a recession like the 2020 pandemic panic sell-off. Conversely, the smartest time to sell or avoid them is when business is super-profitable, while few are expecting operating issues anytime soon. This bullish outlook by investors perfectly describes the April 2022 setup for SBLK and others in the marine sector.
You can see Wall Street analysts are predicting a peak for earnings and cash flow is happening during 2022 for the dry bulk shippers, and SBLK could be a leader on the downside soon.
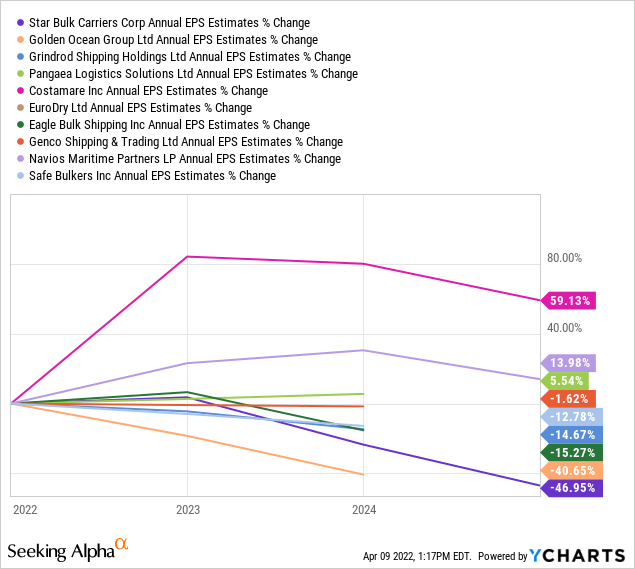
Earnings Estimates, YCharts
While the current valuation on earnings and cash flow looks cheap, on sales and book value SBLK is far from a bargain. On a decade chart of ups and downs, Star Bulk Carriers might even be considered “expensive” today, especially if earnings are peaking.
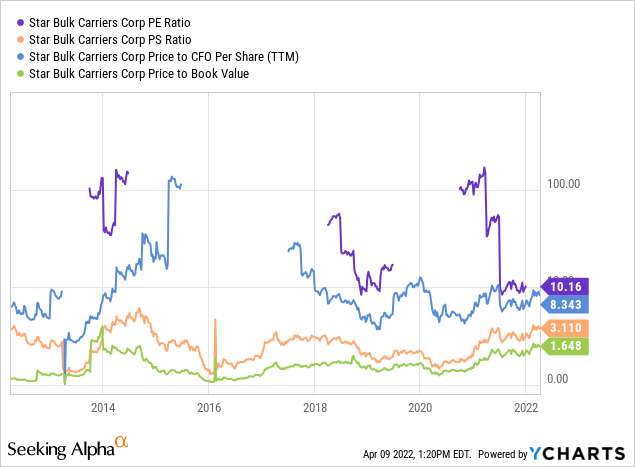
10-Year Valuation Graph, YCharts
The most bearish argument to avoid or even sell Star Bulk is industry-wide shipping rates have been turning lower since October. Below is a 5-year of the Baltic Dry Index, with 50-day and 200-day moving averages. As shipping and charter contracts can be priced for years at a time, spot rates are often forward leading by 6-12 months for individual company results.
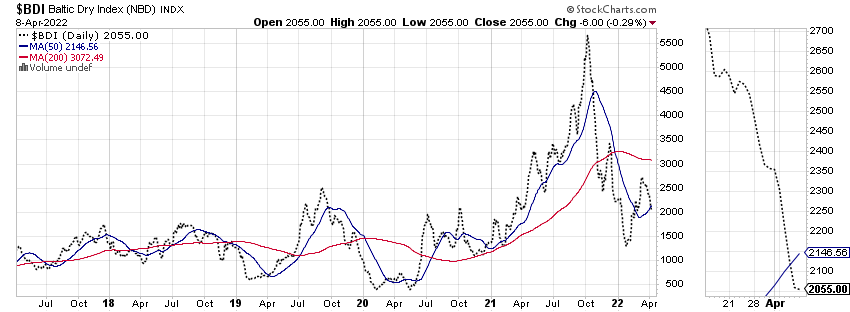
5-Year Baltic Dry Index, StockCharts.com
A chart for SBLK over the same period is drawn below. You can see the early 2022 upmove might be a final gasp higher in price momentum, if shipping rates for the industry turn lower from weaker consumer spending and business manufacturing trends (caused by the spike in inflation and interest rates still ongoing).
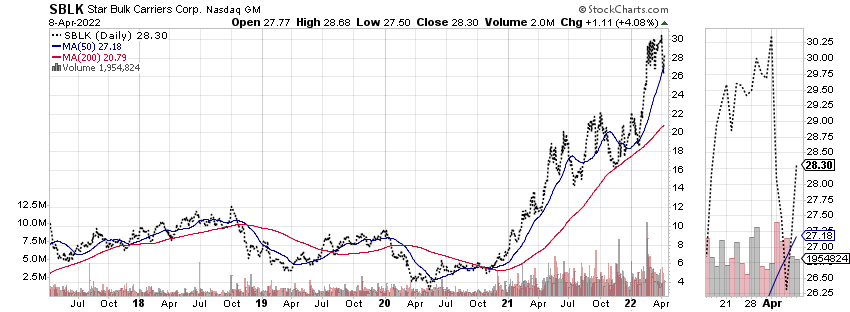
5-Year SBLK Daily Price/Volume, StockCharts.com
Reviewing an 18-month chart of daily trading, a drop below $26 (from $28.30 on Friday) could be the early warning tripwire signal to get out of the way of an impending downturn. This price level would mark a new multi-month low and be well below the important 50-day moving average.
Numerous momentum indicators are struggling to stay above water in 2022, and this is the opposite situation of extremes in bullish momentum outlined in early 2021. The Accumulation/Distribution Line peaked in September, circled in blue on the chart. On Balance Volume has not made any headway since June, circled in red. Plus, the heavy buying action of January-March 2021 (boxed in gold) that launched the current intermediate upmove has been absent and failing to confirm the last six months of price advance, as measured by the Chaikin Money Flow indicator. CMF looks at money flow changes daily as a function of the closing price inside each sessions trading range.
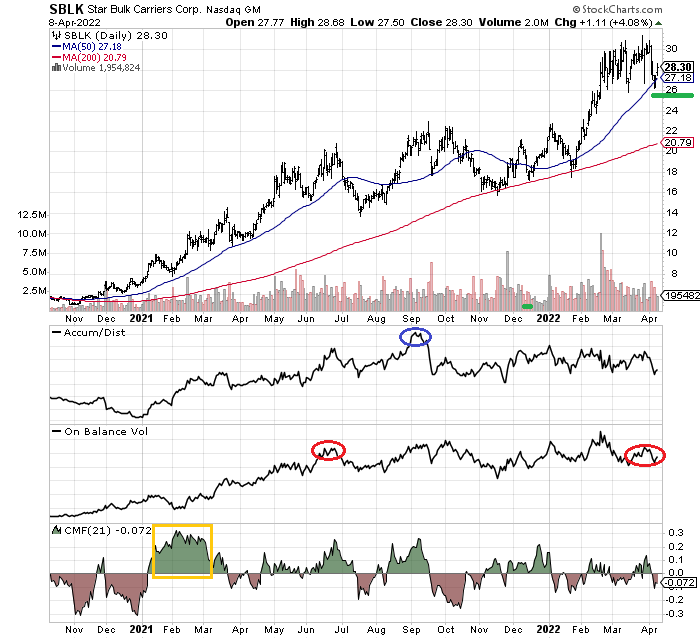
18-Month SBLK Chart, Author Reference Points, StockCharts.com
Final Thoughts
The technical chart pattern appears to be exhausting all upside momentum in early 2022. The downturn in the Baltic Dry Index argues for caution in Star Bulk. And, the macroeconomic picture for the economy could worsen quickly as rising interest rates crush home and car purchase enthusiasm in the months ahead. Then the demand for bulk commodities could turn south later in the year pushing shipping rates into reverse.
Believe it or not, the movements in the various markets are following a typical economic cycle headed for recession. Many Wall Street firms have been coming out with slowing growth forecasts in March and April for 2022-23, partly from the negative implications of the brutal Russia/Ukraine war. When you throw this new monkey wrench into the supply chain problems caused by COVID-19 and restrictive monetary policies from central banks popping up almost everywhere in the world, getting nervous about the economy is only logical. What if we just experienced a 7 or 8-year economic upturn compressed into 24-30 months, measured from the time “unlimited QE” was announced by the Federal Reserve in March 2020.
Adding together these economic headwinds, one last piece of the “recession” puzzle would be a sharper downdraft in global equity markets. A significant global contraction in both bond and stock markets simultaneously has not happened since 2008, during the Great Recession. Of course, an even weaker stock market future during 2022 will not help Star Bulk’s value either. In a worst-case scenario, I am modeling SBLK trading well under $20, perhaps as low as $15 in 12-18 months, if an economic recession plays out.
The upside appears to be very limited to $35, assuming Russia agrees to a compromise with Ukraine soon, and interest rates stop climbing. Under this rosy scenario, shipping rates stabilize and may even rise a little during the rest of the year. Remember, management has slated strong dividends for this year, which is a big bonus for investors in a low-yield environment.
In terms of investment risk vs. reward, I think upside and downside are relatively balanced for the time being. Yet, any further decline in bonds and stocks could easily push the economy into recession. Such would send Star Bulk’s quote into a downward spiral. In the past, rapid price drops have been the norm during recessions. So, I currently rate the stock between a Hold and an Avoid, with a price trigger to Sell if (when) $25-$26 a share is breached in the coming weeks.
Thanks for reading. Please consider this article a first step in your due diligence process. Consulting with a registered and experienced investment advisor is recommended before making any trade.
Be the first to comment