

Pgiam/iStock via Getty Images
Star Bulk Carriers Corp. (NASDAQ:SBLK), a global shipping company transporting commodities on their fleet of dry bulk vessels, has had a very strong performance in the stock market in the last five years. The company has been rewarded for its rising profitability. Industry-wide supply trends support possible further improvements in profitability and long-term improvements in rates.
Overview of the Business
Star Bulk Carriers operates a fleet of 128 new and secondhand vessels, with an average age of around 10.4 years, and a total deadweight tonnage of 14,072,068. The fleet has a carrying value of $3 billion, as of the end of last year, a rise from $2.877 billion in 2020. The company has three kinds of vessels: Panamax/Kamsarmax, which makes up 29.8% of the fleet, Newcastlemax/Capesize, which makes up 54.6% of the fleet, and Ultramax/Supramax, which makes up 15.6% of the fleet. The company plans on having 97% of its fleet fitted with BWTS by the end of the year.
Source: Financial Results Q2 2022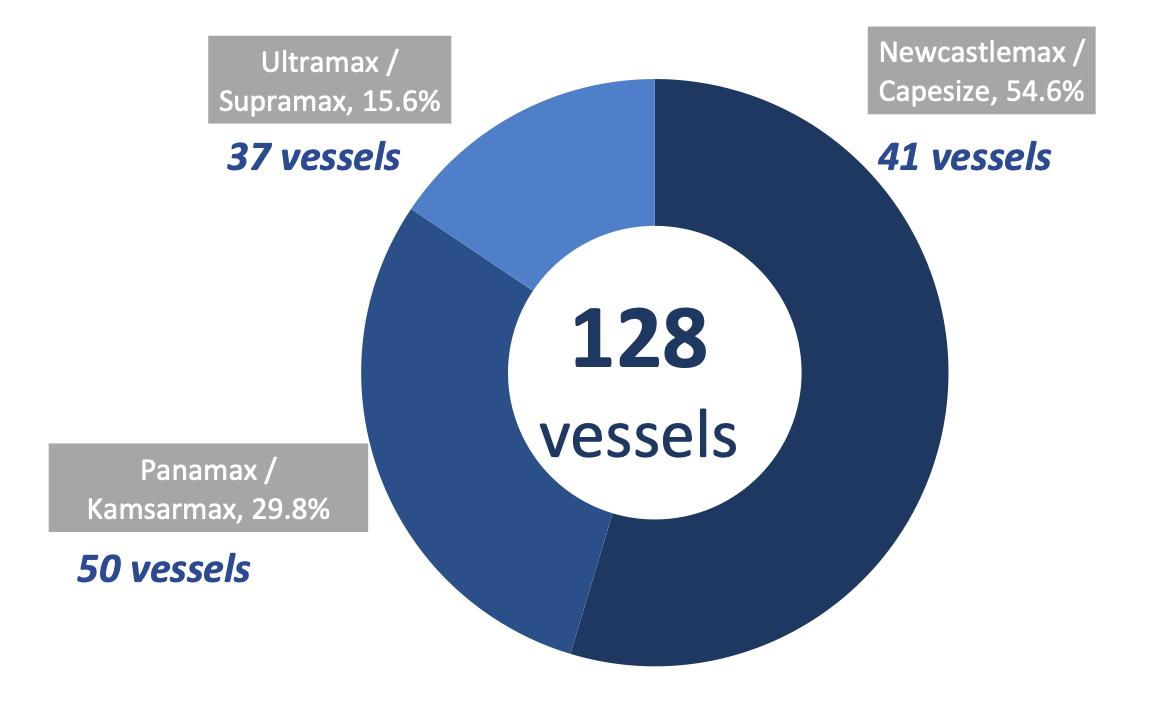
Star Bulk Carriers has the largest dry bulk fleet among its U.S. and European listed peers.
Stock Market Performance
Over the last five years, Star Bulk Carriers’ share price has risen more than 95%, compared to nearly 36% for the Russell 3000. In the year-to-date, the company has continued to outperform the Russell 30000, although both are down, with Star Bulk Carriers down more than 13.5%, and the Russell 3000 down nearly 26%.
Source: Google Finance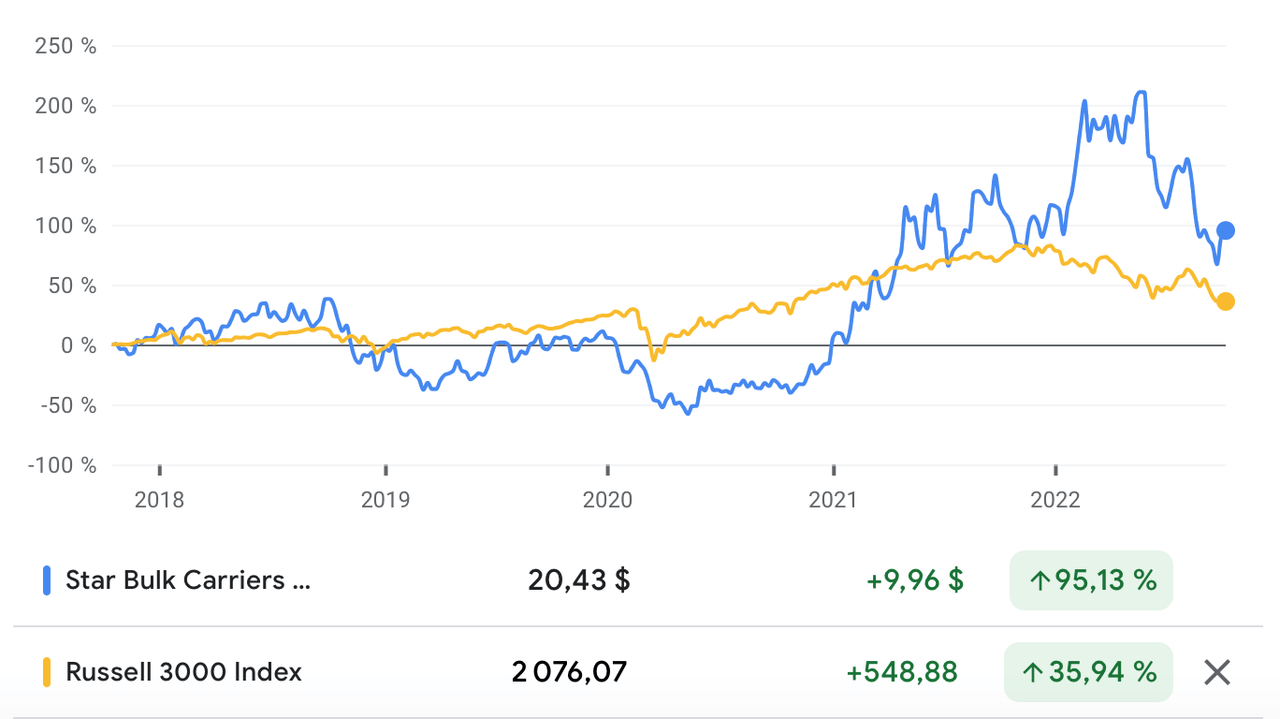
The company’s strong stock market performance reflects the company’s strong financial performance.
Strong Financial Performance
Star Bulk carriers have grown revenue from $331.98 in 2017, to nearly $1.43 billion in 2021, for a 5-year revenue compound annual growth rate (CAGR) of 33.87%. According to Credit Suisse’ The Base Rate, between 1950 and 2015, just 1% of businesses had a similar rate of growth. In the trailing twelve months (TTM), revenue has grown to nearly $1.7 billion.
Source: Credit Suisse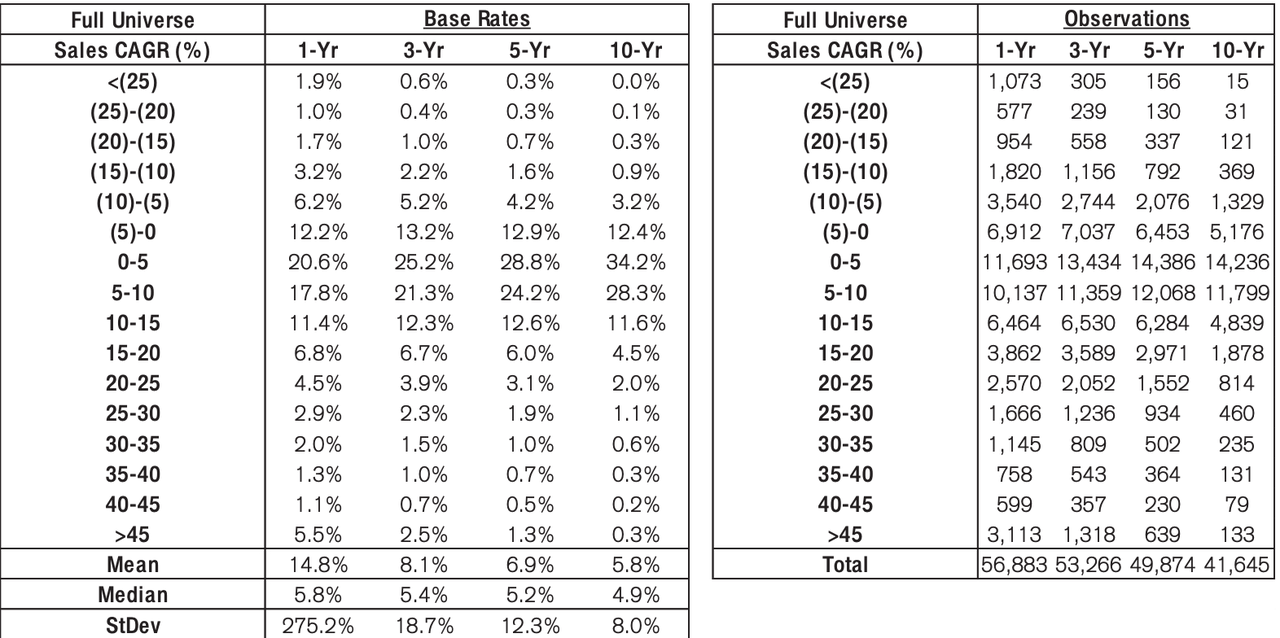
Revenues emanate from three streams: time charters, voyage charters, and pool revenues. Time charters are for specific periods of time, and are charged either at a specified daily fixed rate, or an index-linked charter hire rate. Voyage charters require the charterer to have a minimum amount of cargo. The charterer is responsible for any short loading or cargo or dead freight. A fraction of the company’s revenue is derived from pool revenues, which a vessel is pooled between a group of charterers.
Source: 2021 Annual Report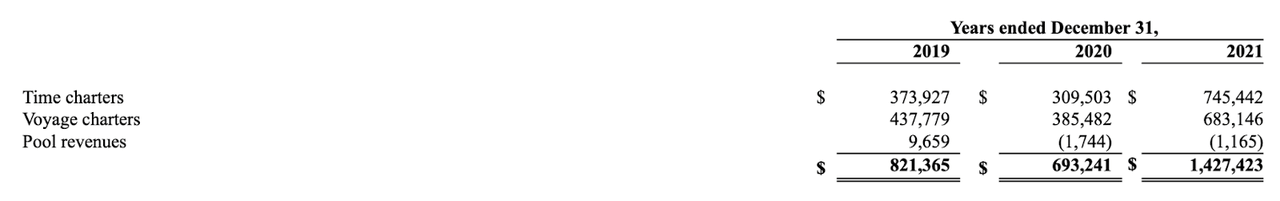
Star Bulk Carriers’ gross profitability has risen from nearly 0.073 in 2017, to 0.25 in 2021. This is still short of the 0.33 threshold that Robert Novy-Marx’ research found was attractive for stocks. In the TTM period, gross profitability has risen to 0.32, inching closer to that 0.33.
Operating margin has risen from 0.117 in 2017, to 0.518 in 2021. In the TTM period, operating margin has risen to 0.557. According to Aswath Damodaran’s research, operating margin for the shipping & marine industry is 0.1671.
Net income has risen from -$9.77 million in 2017, to $680.53 million in 2021. To avoid unreal values, let’s say in 2017, the company earned $0.1 million in net income, then that would give the company a 5-year net income CAGR of 484.21%. That gives us a base rate of just 0.5% of businesses in the 1950 to 2015 period. In the TTM period, the company earned a net income of $891.07 million.
Source: Credit Suisse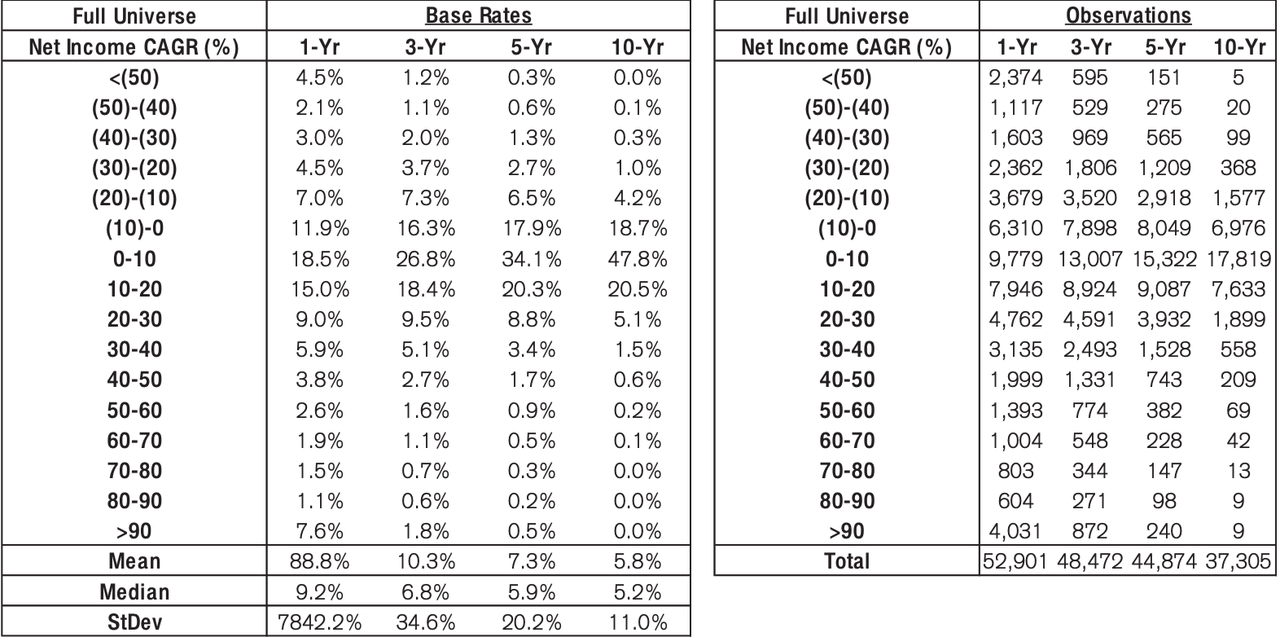
The company’s fattening profitability is not just about higher rates, but also about the company’s declining operating expenses ((opex)). The company’s average daily OPEX in Q2 2022, was $4,674, lower than all but one of its closest peers.
Source: Financial Results Q2 2022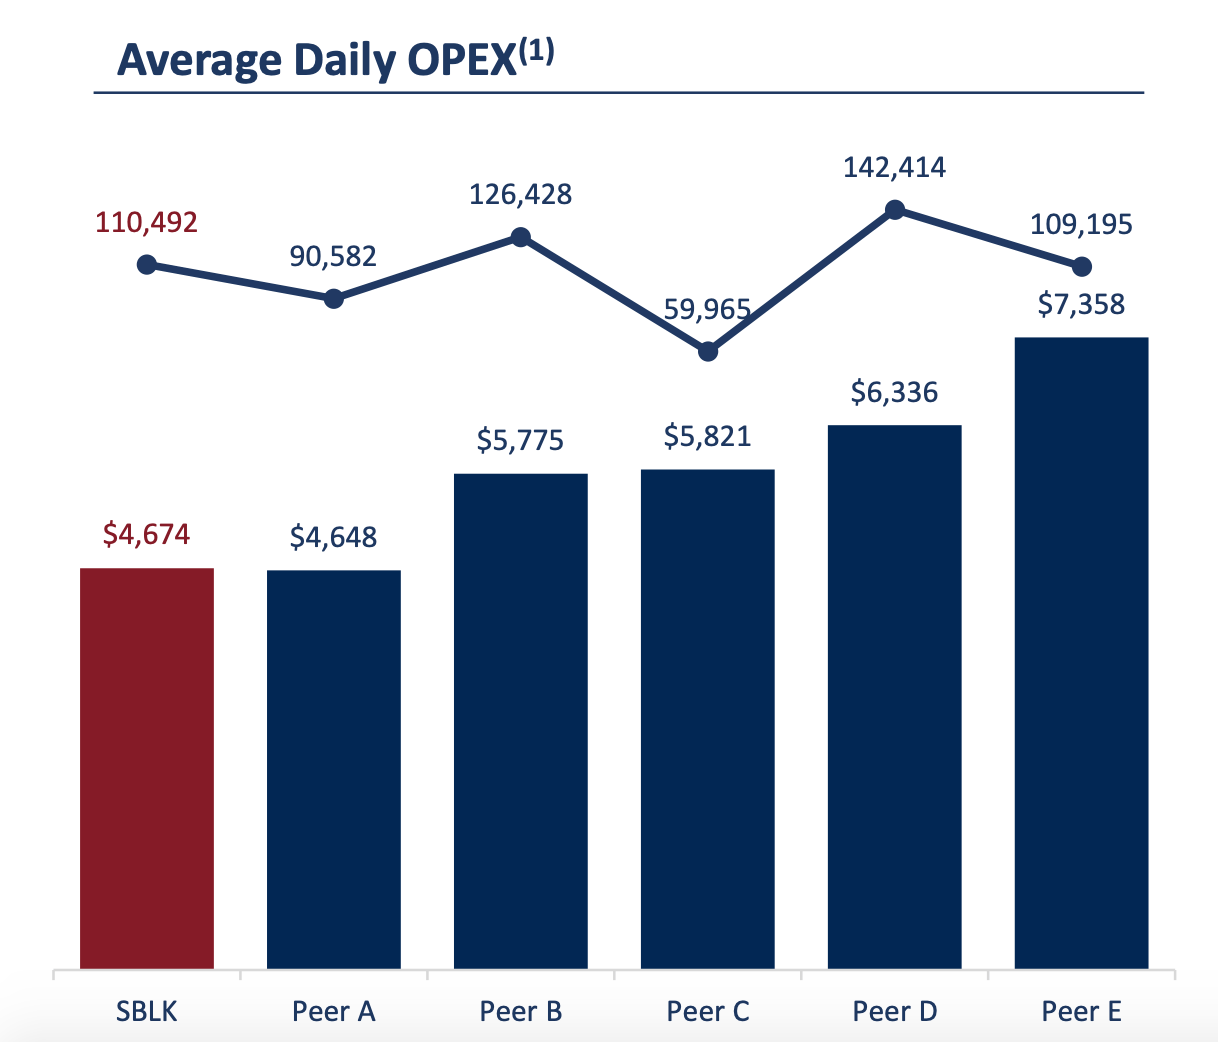
The company has grown free cash flow (FCF) from -$45.73 million in 2017, to $636.92 million in 2021. In the TTM period, FCF has risen to $990.41 million.
Return on invested capital (ROIC) has risen from 1.5% in 2017 to 16.6% in 2021. This reflects what we have learnt so far: improving profitability and stronger economics. In the TTM period, ROIC has risen to 21.1%. This tells us that the company’s future stock market performance is likely to be as good.
Supply Remains Tight
There is an inverse relationship between asset growth and future returns. This phenomenon, known as the asset growth effect, is important for choosing the direction of returns within an industry. The shipping industry, it turns out, has supply-side issues that are unlikely to go away in the near-term.
There remains a global shipping-container shortage, and a number of other supply chain issues, and this has forced many companies, such as sugar and rice traders, to use dry bulk vessels as a way of reducing the supply chain problems they face.
Dry bulk shipping spot rates have collapsed since their pandemic heights, however, even this year, spot rates reached some of their highest levels since 2018, despite recessionary pressures. In recent weeks, dry bulk shipping spot rates have shown strength, despite weaknesses in the steel market.
Source: Statista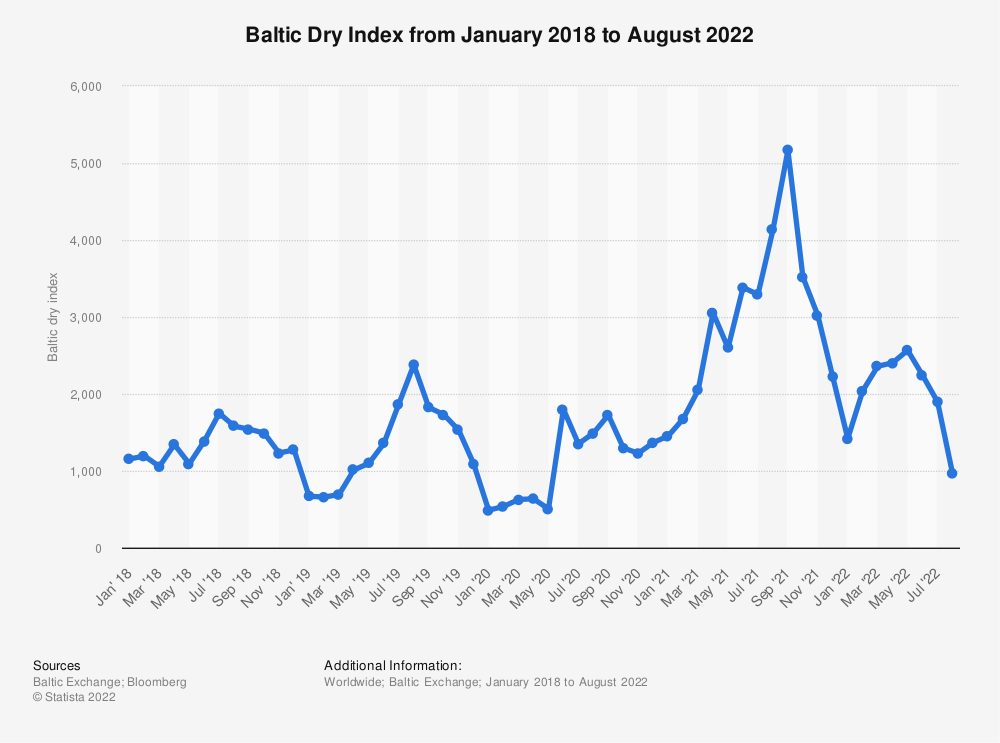
Supply remains tight for ships, especially given regulatory challenges and low newbuilding order books. Globally, there are just 13,105 vessels, and that fleet is expected to grow by just 2.8% this year, and by just 0.8% in 2023. Compare that level of growth with the high of 14.8% in 2011. The global fleet of Panamaxes is expected to grow 3.6% this year, and 1.6% in 2023, compared to a growth rate of 12.2% in 2011. The capesize fleet is expected to grow 2.2% in 2022, and 0.3% in 2023, compared to a growth rate of 19% in 2011. The handysize fleet is expected to grow 2.6% in 2022, and 2.1% in 2023. In 2022, the dry bulk orderbook is 960 vessels, compared to 799 in 2021, compared to a 2009-high of 4,158.
The company’s data shows that the global dry bulk net fleet has grown at around 3% in the TTM period leading up to their Q2 results. The order book’s 7.1% of the fleet is an industry low. The company cites environmental regulations, rising shipbuilding costs, and limited shipyard capacity, have kept the order book low.
Source: Financial Results Q2 2022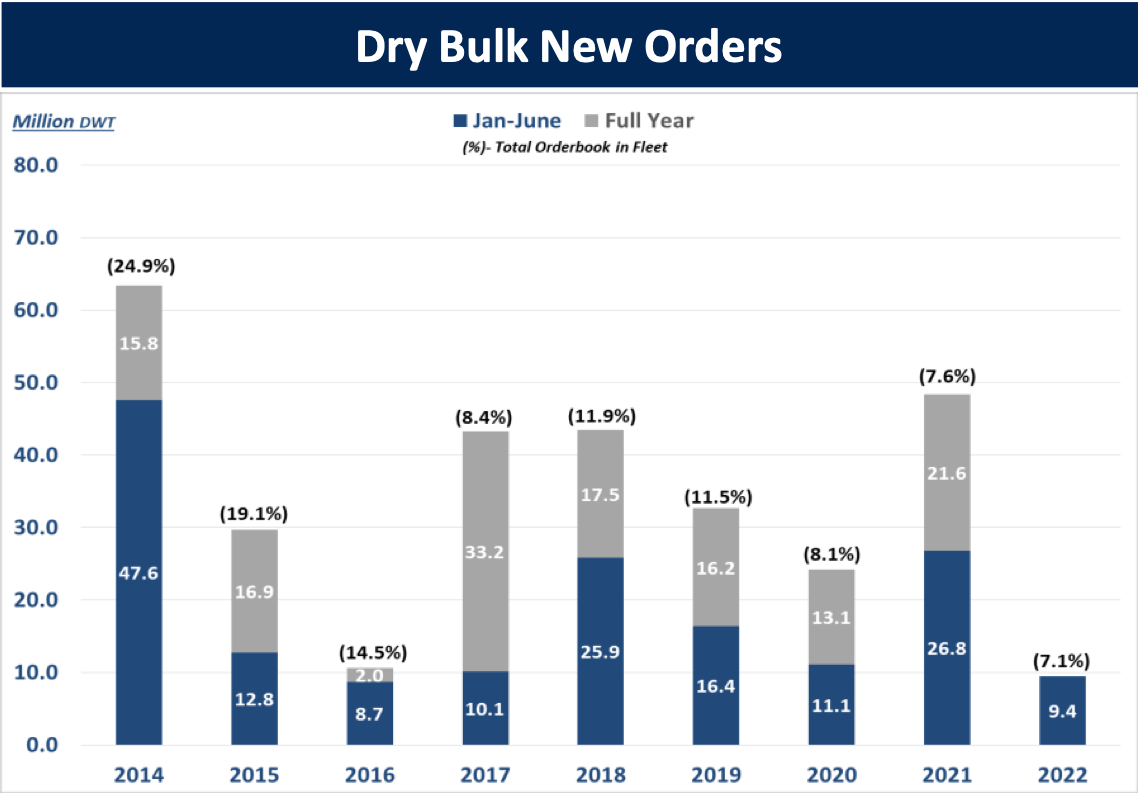
Vessels older than 15 years old are now 18.2% of the fleet, reflecting the supply difficulties faced by the industry. Star Bulk Carriers believes that net fleet growth is not likely to go beyond 2% between 2022 and 2024.
This suggests that rates will rise in the future as a result of shipping industry supply constraints, and this may elevate Star Bulk Carriers’ already rising profitability.
Risks
Any investment strategy that relies on supply trends carries the risk that the thesis may only pay off years into the future. This is why investors diversify. The first risk is simply that an investor may not see this thesis bear fruit in the near-term. If in that time, the supply constraints are eased, then the thesis may never play out.
The threat of a global recession is high. The World Bank believes there is a strong possibility of a global recession in 2023, and Ned Davis Research believes that a global recession has a 98.1% likelihood. A recession could ease demand for commodities, and this could reduce Star Bulk Carriers’ profitability.
Valuation
In the TTM period, Star Bulk Carriers had a FCF of $990.41 million, and currently has an enterprise value of $3.17 billion. This gives us a FCF yield of 31.24%. Compare this with the FCF yield of 1.5% for the 2000 largest listed firms in the United States, as measured by New Constructs.
Conclusion
In the last five years, Star Bulk Carriers’ stock market performance has been far superior to the general market. This reflects the company’s strong financial performance at that time. Underlying industry-wide supply trends could support the company’s future profitability. This is important because the company continues to improve its profitability, so investors have to know that this profitability trend is sustainable.
Be the first to comment