

aydinmutlu/E+ via Getty Images
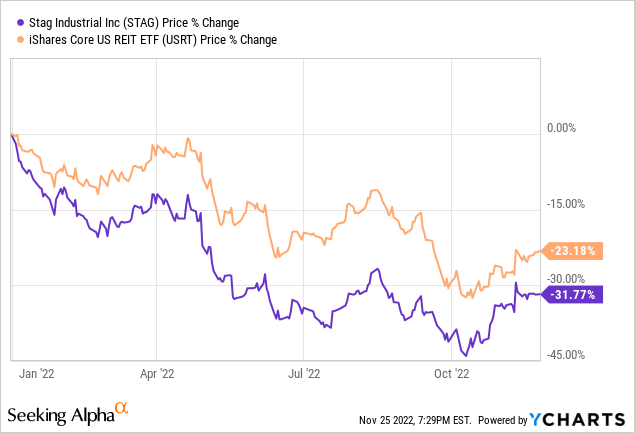
STAG Industrial (NYSE:STAG) has fallen harder than the iShares Core U.S. REIT ETF (USRT) year to date (“YTD”) in a higher interest rate environment.
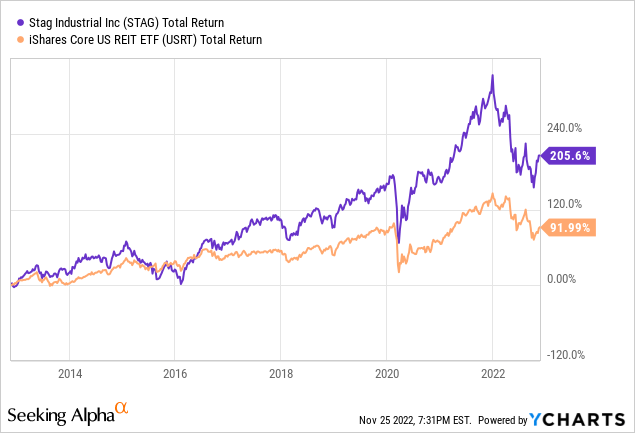
However, STAG has outperformed in the last 3, 5, and 10 years, and it offers a higher dividend yield than USRT. So, it could be a good buy-the-dip opportunity in STAG.
The Pullback
The correction of almost one third YTD has to do with the market being concerned about rising interest rates leading to a higher cost of capital that translates to lower returns for acquisitions. It means that the REIT will be more selective in its acquisitions which will likely lead to less deals happening. The same goes for developments.
To get a sense of the impact of higher interest rates on STAG, the company reported in its 2021 annual report that “as of December 31, 2021, approximately 57.1% or $1.3 billion of [its] outstanding debt had variable rates…”
So far, interest rate hikes haven’t affected STAG yet. Its 2019 interest rate was about 3.65% versus 3.64% now. However, further interest rate hikes would lead to higher borrowing costs. Even though the U.S. has been experiencing disinflation, the recent rate of 7.7% is still much higher than the Federal Reserve’s target of about 2%. So, if anything, in the near term, interest rates are unlikely to fall. At some point (not any time soon), rates could be more or less stagnant before it started falling again.
STAG Industrial: The Business
STAG Industrial has grown in scale over time. Today, its 111.6 million square feet portfolio has about 563 industrial real estate properties across 41 U.S. states. The weighted average lease term is just under five years.
Lease renewals provide opportunities for rent increases. Its Q3 leasing spreads was about 25% while same-store net operating income (“SSNOI”) growth has been north of 5.0%.
Corporate Presentation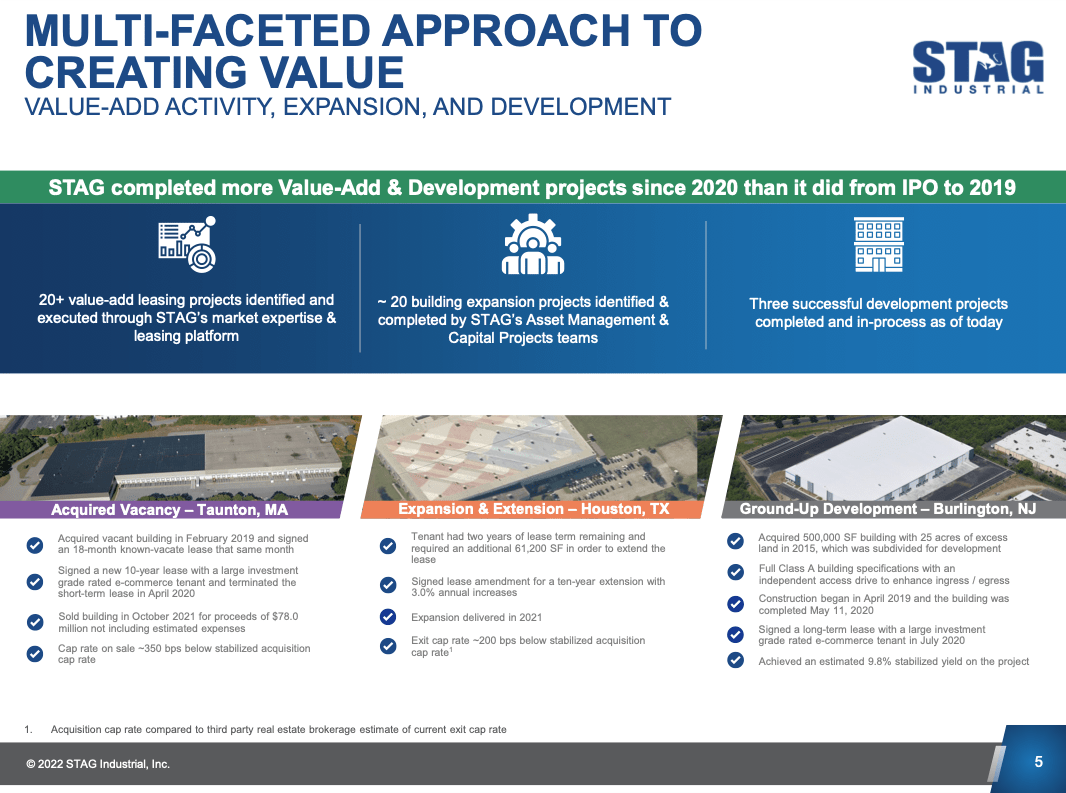
STAG is involved in value-add, expansion, and development projects. In its November presentation, it highlighted that “STAG completed more Value-Add & Development projects since 2020 than it did from IPO to 2019.”
Based on a tenant survey in 2021, roughly 40% of STAG’s portfolio handles e-commerce activity. According to the industrial outlook from CBRE-EA, e-commerce currently makes up about 14.5% of retail sales in the U.S. Wall Street Research expects that the e-commerce penetration rate to reach 30% by 2030.
Management sees trends in accelerating re-shoring and near-shoring to continue to drive demand in warehouse space in the U.S.
Reshoring is the process of returning the production and manufacturing of goods back to the company’s original country. (Investopedia)
Near-shoring is the transfer of a business operation to a nearby country, especially in preference to a farther location.
Recent Results
In the first nine months of the year, STAG saw its cash NOI rising 18.6% to $383.8 million, SSNOI increase 5.0% to $314 million, core funds from operations (“FFO”) climb 18.9% to $302.2 million, and its core diluted FFO per share rise 7.1% to $1.66. Cash available for distribution also rose 16.9% to $256.6 million.
Year to that, it acquired 25 buildings totaling 4.6 million square feet for $459 million to help drive growth. This portfolio has a weighted average lease term of 6.7 years and a cash cap rate of 5.2%. STAG has more buildings under consideration in its pipeline that could drive further growth should they get funneled into an actual acquisition.
Corporate Press Release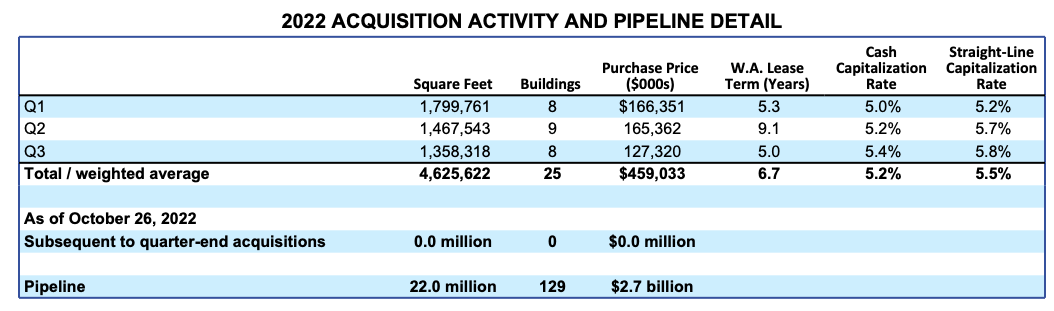
Dividend
STAG Industrial stock has a track record of increasing its dividend. Its dividend growth has slowed with a five-year dividend growth rate of <1%. Simultaneously, its FFO payout ratio improved from 83% to 70% between 2017 and 2021, as its FFOPS growth rate was close to 5.5% in the period.
F.A.S.T. Graphs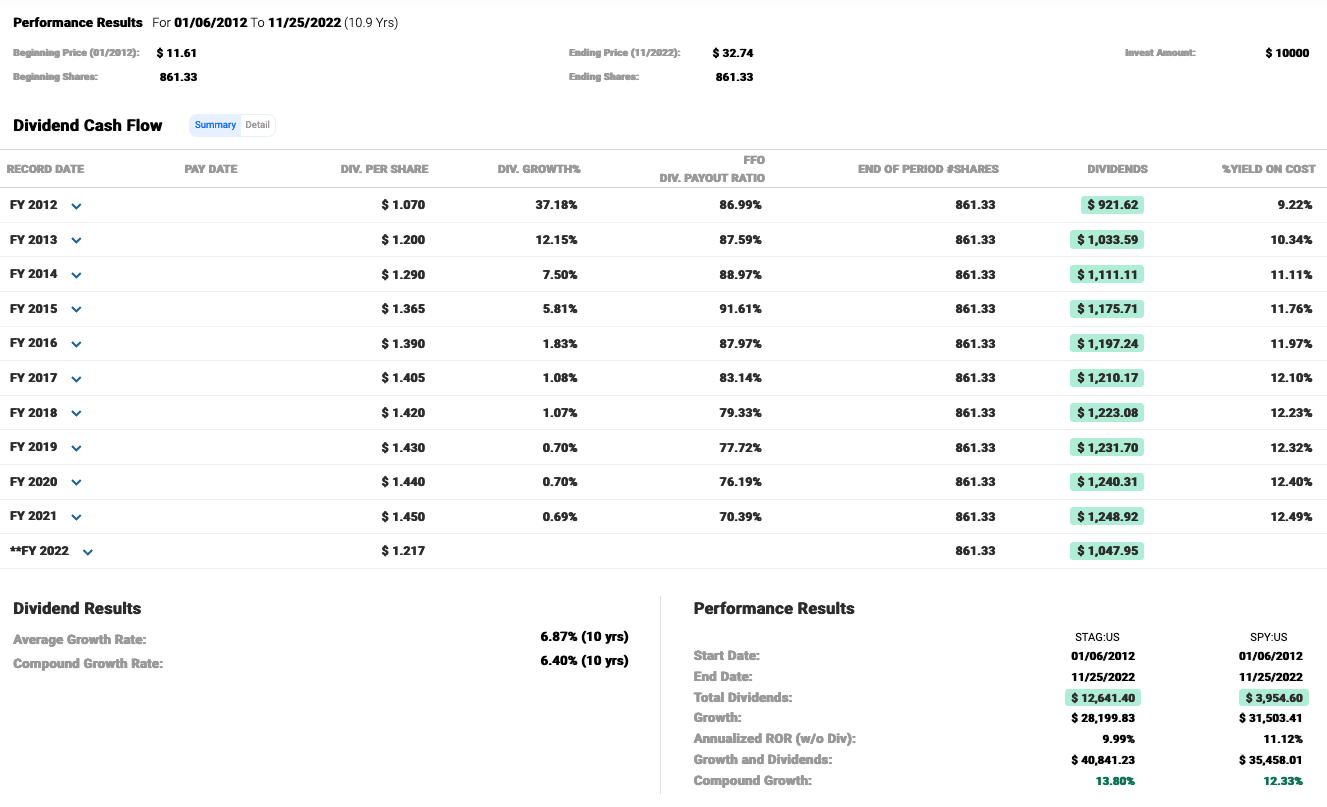
This year, its FFO payout ratio is anticipated to be about 66%. The lower payout ratio indicates a safer dividend. Its dividend yield is close to 4.5% at the current quotation.
Valuation
After the stock bottomed and reported solid Q3 results in October, it had popped approximately 20%. At $32.74 per share, it now trades at about 15x FFO, which is a fair valuation based on the industrial REIT’s trading history. Additionally, it’d be more rational to not expect it to trade at a premium valuation of over 15x FFO any time soon since its growth is expected to slow.
F.A.S.T. Graphs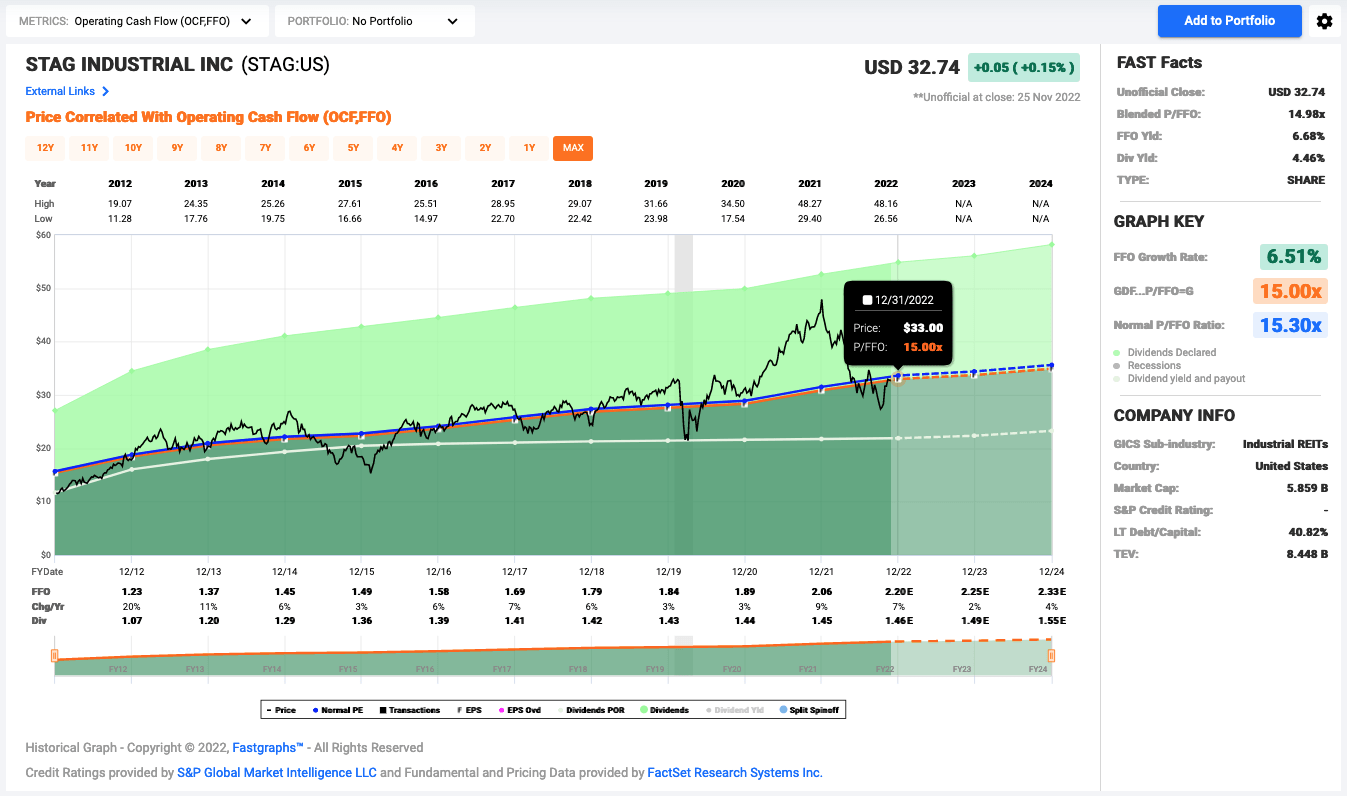
Investor Takeaway
At the end of 2019, STAG’s long-term debt-to-equity (“D/E”) ratio was 65%. At the end of Q3, its long-term D/E ratio increased to 68%, which is nothing eye-popping.
STAG’s five-year FFOPS growth rate is 5.45%. Currently, analysts forecast slower FFOPS growth of 2% and 4% in 2023 and 2024, respectively. Assuming a more conservative growth rate of 4% through 2027 in a higher interest rate environment and a target P/FFO of 15, the dividend stock could deliver annualized returns of about 7.7%. This is not a far-off estimate from its five-year annualized return of approximately 7.5%.
Given STAG’s slower growth outlook, little room for valuation expansion, but having prospects to deliver still solid stable total returns, we rate it as a Hold at current levels.
Seeking Alpha news noted that Wells Fargo analyst Blaine Heck recently downgraded the industrial REIT but favored the coaster market operators Rexford Industrial (REXR) and Prologis (PLD). Investors interested in STAG should also research REXR and PLD.
Be the first to comment