


wellesenterprises/iStock via Getty Images
Earnings of S&T Bancorp, Inc. (NASDAQ:STBA) will likely somewhat increase this year thanks to the top line’s high sensitivity to interest rate changes. Further, strength in the job market will likely drive loan growth, which will, in turn, support the bottom line. Meanwhile, provisioning will likely return to a normal level for the last three quarters of 2022 after an unusual provision reversal reported in the first quarter of the year. Overall, I’m expecting S&T Bancorp to report earnings of $2.87 per share for 2022, up 2% year-over-year. The December 2022 target price suggests a high upside from the current market price. Further, S&T Bancorp is offering a high dividend yield for a bank-holding company. Based on the total expected return, I’m adopting a buy rating on S&T Bancorp.
Loan Mix is Well-Positioned for a Rate Hike
S&T Bancorp’s net interest margin is positively correlated with interest rates to a large extent, mostly because of a highly rate-sensitive loan portfolio. Floating-rate loans made up 52% of total loans, while adjustable-rate loans made up 22% of total loans at the end of March 2022, as mentioned in the earnings presentation. Therefore, the majority of the loan portfolio will re-price this year.
The asset side’s re-pricing will outweigh the re-pricing on the liability side. Interest-bearing transactional accounts, including money market, savings, and interest-bearing demand, made up 52.5% of total deposits at the end of March 2022, according to details given in the 10-Q filing. These deposits will re-price soon after every rate hike. The remaining deposits will make the average deposit cost stickier.
The management’s interest-rate sensitivity analysis given in the 10-Q filing shows that a 200-basis points hike in interest rates can boost the net interest income by up to a hefty 18.7% over twelve months. Considering these factors, I’m expecting the margin to increase by 30 basis points in the last nine months of 2022 from 3.14% in the first quarter of the year.
Regional Economic Factors to Help Normalize Loan Growth
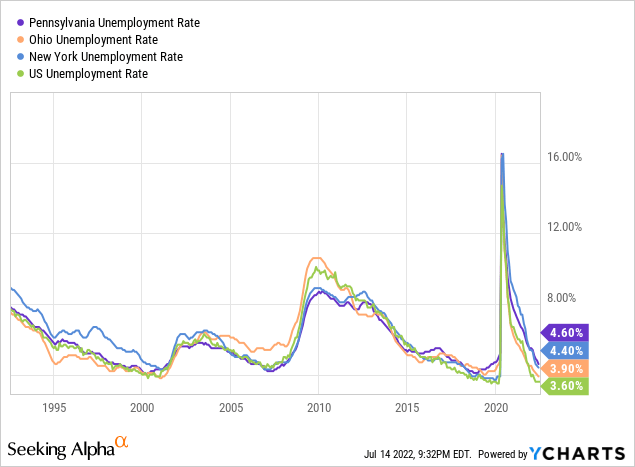
S&T Bancorp’s loan portfolio size declined by 0.5% in the first quarter of 2022. This reduction was partly attributable to elevated payoffs, as mentioned in the conference call. Going forward, the loan portfolio will likely trend upwards again thanks to strong job markets in S&T Bancorp’s operating regions. The company operates mostly in Pennsylvania and Ohio with some presence in New York too. Although all three states have worse unemployment rates than the national average, their unemployment rates are currently close to multi-decade lows. Strong job markets bode well for consumer and residential mortgage loans.
S&T Bancorp’s historical loan growth, excluding mergers and acquisitions, has remained in the low-single-digit range in the past. Given the existing job market situation, I believe loan growth can return to the historical average during the last three quarters of 2022. Overall, I’m expecting the loan portfolio to increase by 2.5% by the end of December 2022 from the end of 2021. Meanwhile, other balance sheet items will likely grow in line with loans during the last three quarters of 2022. The following table shows my balance sheet estimates.
| FY18 | FY19 | FY20 | FY21 | FY22E | |
| Financial Position | |||||
| Net Loans | 5,886 | 7,075 | 7,108 | 6,901 | 7,072 |
| Growth of Net Loans | 3.2% | 20.2% | 0.5% | (2.9)% | 2.5% |
| Other Earning Assets | 770 | 914 | 933 | 1,768 | 1,834 |
| Deposits | 5,674 | 7,037 | 7,421 | 7,997 | 8,202 |
| Borrowings and Sub-Debt | 604 | 416 | 228 | 161 | 151 |
| Common equity | 936 | 1,192 | 1,155 | 1,206 | 1,233 |
| Book Value Per Share ($) | 26.8 | 34.4 | 29.6 | 30.9 | 31.5 |
| Tangible BVPS ($) | 18.5 | 23.3 | 19.8 | 21.2 | 21.8 |
|
Source: SEC Filings, Author’s Estimates (In USD million unless otherwise specified) |
High Allowance Level to Keep Provisioning from Rising Above Normal Amid Recessionary Threats
S&T Bancorp’s allowance coverage increased to multi-year highs by the end of March 2022. The allowance-to-nonperforming loan ratio stood at 190% at the end of March 2022, which was the highest level in the last four years (year-end comparison), according to details given in the presentation. Due to the high allowance coverage, I’m not too worried about a recession’s impact on provisioning for expected loan losses.
S&T Bancorp released some of its loan loss reserves during the first quarter of 2022. I’m not expecting similar reserve releases for the last three quarters of 2022 because of the threats of a recession in the high interest-rate environment. Given the high allowance level and the economic outlook, I’m expecting provisioning to return to a normal level for the last three quarters of 2022. However, due to the first quarter’s performance, the provisioning will remain below normal for the full year. I’m expecting S&T Bancorp to report a net provision expense of 0.20% of total loans for 2022. In comparison, the net provision expense averaged 0.24% of total loans from 2017 to 2019.
Expecting Flattish Earnings Growth for 2022
The net interest margin’s high sensitivity to interest rate changes will likely be the chief driver of earnings growth this year. The bottom line will likely receive further support from subdued loan growth. Moreover, the provisioning expense will likely be lower this year compared to last year because of the big provision reversal during the first quarter of this year. On the other hand, operating expenses will likely remain heightened due to a tight labor market as well as the management’s investment plans mentioned in the conference call.
Overall, I’m expecting S&T Bancorp to report earnings of $2.87 per share for 2022, up by just 2% year-over-year. The following table shows my income statement estimates.
| FY18 | FY19 | FY20 | FY21 | FY22E | |||||
| Income Statement | |||||||||
| Net interest income | 234 | 247 | 279 | 276 | 291 | ||||
| Provision for loan losses | 15 | 15 | 131 | 16 | 14 | ||||
| Non-interest income | 49 | 53 | 60 | 65 | 62 | ||||
| Non-interest expense | 145 | 167 | 187 | 189 | 198 | ||||
| Net income – Common Sh. | 105 | 98 | 21 | 110 | 112 | ||||
| EPS – Diluted ($) | 3.01 | 2.82 | 0.53 | 2.81 | 2.87 | ||||
|
Source: SEC Filings, Earnings Releases, Author’s Estimates (In USD million unless otherwise specified) |
|||||||||
Actual earnings may differ materially from estimates because of the risks and uncertainties related to inflation, and consequently the timing and magnitude of interest rate hikes. Further, the threat of a recession can increase the provisioning for expected loan losses beyond my expectation. The new Omicron subvariant also bears monitoring.
High Total Expected Return Calls for a Buy Rating
S&T Bancorp is offering a dividend yield of 4.4% assuming it maintains its dividend at the current quarterly rate of $0.30 per share. The earnings and dividend estimates suggest a payout ratio of 41% for 2022, which is in line with the five-year average of 38% (excluding the outlier of 2020). Therefore, I’m not expecting an increase in the dividend level in the remainder of this year.
I’m using the historical price-to-tangible book (“P/TB”) and price-to-earnings (“P/E”) multiples to value S&T Bancorp. The stock has traded at an average P/TB ratio of 1.67x in the past, as shown below.
| FY18 | FY19 | FY20 | FY21 | Average | ||
| T. Book Value per Share ($) | 18.5 | 23.3 | 19.8 | 21.2 | ||
| Average Market Price ($) | 42.5 | 38.2 | 25.4 | 30.8 | ||
| Historical P/TB | 2.29x | 1.64x | 1.29x | 1.46x | 1.67x | |
| Source: Company Financials, Yahoo Finance, Author’s Estimates | ||||||
Multiplying the average P/TB multiple with the forecast tangible book value per share of $21.8 gives a target price of $36.4 for the end of 2022. This price target implies a 34.9% upside from the July 14 closing price. The following table shows the sensitivity of the target price to the P/TB ratio.
| P/TB Multiple | 1.47x | 1.57x | 1.67x | 1.77x | 1.87x |
| TBVPS – Dec 2022 ($) | 21.8 | 21.8 | 21.8 | 21.8 | 21.8 |
| Target Price ($) | 32.1 | 34.2 | 36.4 | 38.6 | 40.8 |
| Market Price ($) | 27.0 | 27.0 | 27.0 | 27.0 | 27.0 |
| Upside/(Downside) | 18.7% | 26.8% | 34.9% | 43.0% | 51.1% |
| Source: Author’s Estimates |
S&T Bancorp’s P/E multiple has had some extreme outliers during 2020 and 2021, as shown below.
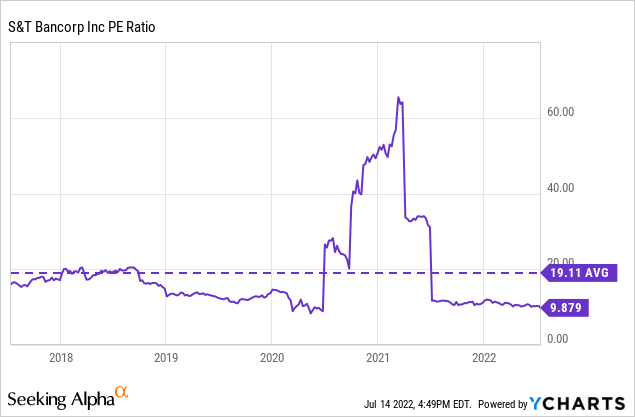
Excluding the anomaly, the stock has traded at an average P/E ratio of around 12.9x in the past, as shown below.
| FY18 | FY19 | FY20 | FY21 | T. Average | ||
| Earnings per Share ($) | 3.01 | 2.82 | 0.53 | 2.81 | ||
| Average Market Price ($) | 42.5 | 38.2 | 25.4 | 30.8 | ||
| Historical P/E | 14.1x | 13.6x | 48.0x | 11.0x | 12.9x | |
| Source: Company Financials, Yahoo Finance, Author’s Estimates | ||||||
Multiplying the trimmed average P/E multiple with the forecast earnings per share of $2.87 gives a target price of $37.0 for the end of 2022. This price target implies a 37.0% upside from the July 14 closing price. The following table shows the sensitivity of the target price to the P/E ratio.
| P/E Multiple | 10.9x | 11.9x | 12.9x | 13.9x | 14.9x |
| EPS 2022 ($) | 2.87 | 2.87 | 2.87 | 2.87 | 2.87 |
| Target Price ($) | 31.2 | 34.1 | 37.0 | 39.9 | 42.7 |
| Market Price ($) | 27.0 | 27.0 | 27.0 | 27.0 | 27.0 |
| Upside/(Downside) | 15.7% | 26.4% | 37.0% | 47.6% | 58.3% |
| Source: Author’s Estimates |
Equally weighting the target prices from the two valuation methods gives a combined target price of $36.7, which implies a 36.0% upside from the current market price. Adding the forward dividend yield gives a total expected return of 40.4%. Hence, I’m adopting a buy rating on S&T Bancorp.
Be the first to comment