

Falcor
It’s been a volatile year for investors in the Gold Miners Index (GDX) and an even more frustrating two years, with the index shedding ~50% of its value despite a mere 21% correction in the gold price. While a few names have managed to buck the trend, and SSR Mining (NASDAQ:SSRM) was a clear outperformer following its merger with Alacer, this outperformance has flipped to underperformance in FY2022, which I warned could occur due to very difficult comps ahead after a phenomenal year in FY2021.
Unfortunately, these tough comparisons it had to lap were exacerbated by a temporary suspension of operations at Copler, the company’s breadwinner in Turkiye. Adding insult to injury, Marigold has seen delays in leach recovery due to finer ore from the north pits at Marigold (Nevada). The result is that SSR Mining is tracking miles behind its initial FY2022 guidance mid-point of 740,000 GEOs. In fact, FY2022 production is now forecasted at ~638,000 ounces (mid-point) at ~$1,330/oz, with costs more than 12% above the guidance mid-point. Let’s take a closer look below:
Copler Operations (Company Presentation)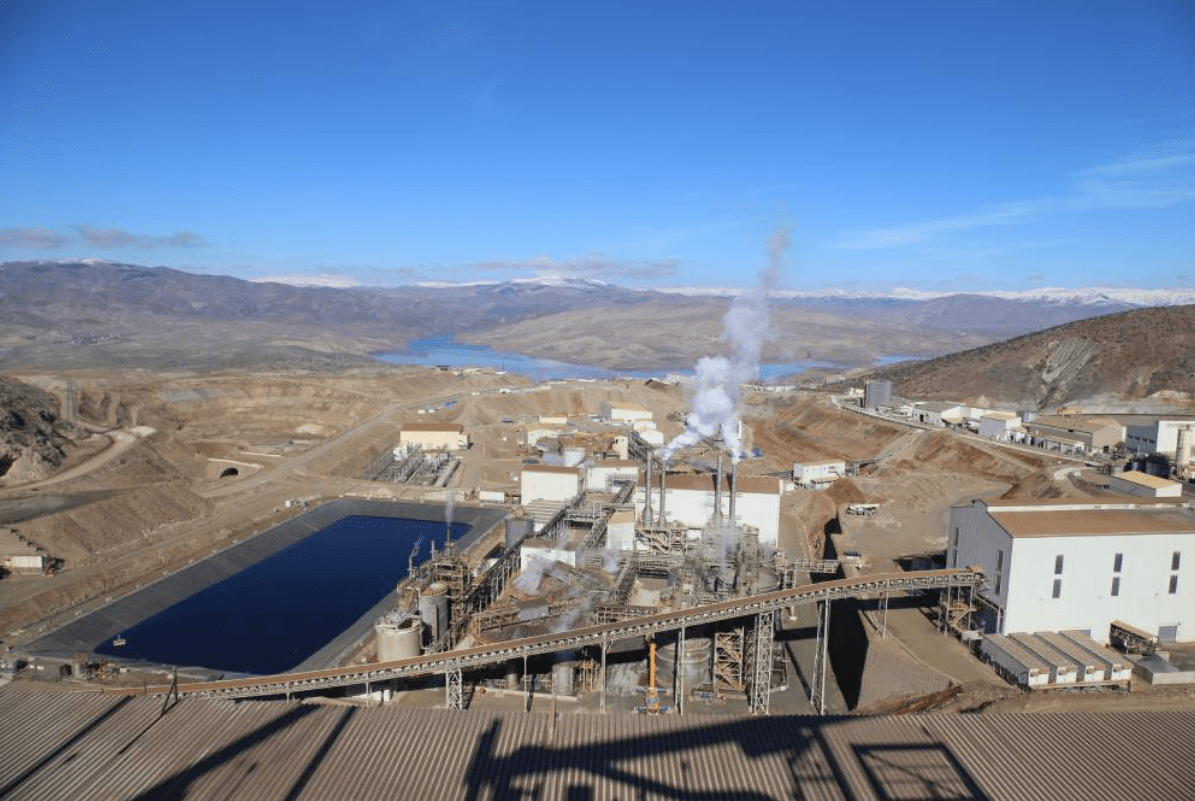
Q3 Production & Sales
SSR Mining released its Q3 results last month, reporting quarterly production of ~106,900 gold-equivalent ounces [GEOs], representing a sharp decline from the year-ago period. This ~43% decline in production year-over-year was partially due to being up against difficult comps but mostly related to the June to September suspension of operations at its Copler Mine, leading to limited contribution (~3,700 ounces vs. ~83,000 ounces) from this key asset in Q3 2022 vs. Q3 2021. Meanwhile, despite a very solid year thus far in Saskatchewan, grades were lower at Seabee in Q3, with production down 9% to ~20,500 ounces.
SSR Mining – Quarterly Production by Mine (Company Filings, Author’s Chart)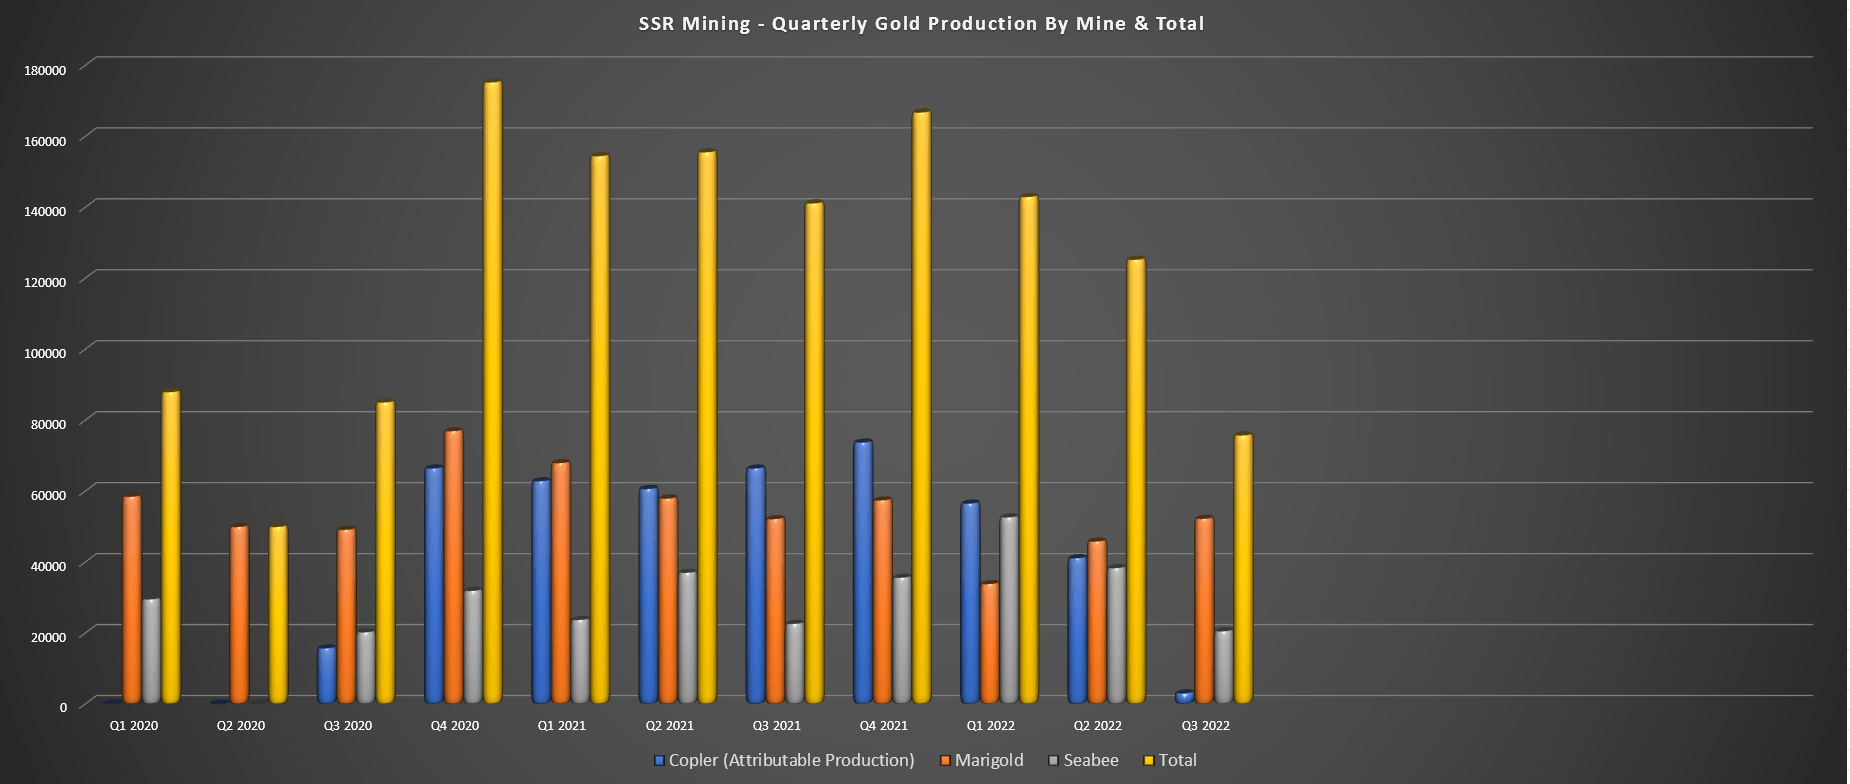
Looking at the quarterly gold production by mine, we can see that this was the fourth consecutive sequential decline in production for SSR Mining, with a further headwind from a less favorable (rising) gold/silver ratio, which weighed on GEO contribution from Puna, the company’s silver asset. As for Marigold, production was up slightly on a year-over-year, but production is down sharply on a year-to-date basis (~131,800 vs. ~177,900) and is expected to decline substantially in FY2022. However, this is partially related to reduced shovel availability, and some of the high-grade material stacked in Q4 now being expected to be recovered next year vs. in Q4.
So, what’s the good news?
Outside of the exploration success recently reported at Marigold, which points to a very bright future for this asset, the mine had an outstanding month in October, stacking ~48,000 ounces on the pads. Meanwhile, the company purposely pulled maintenance forward at its Copler Mine with the relining of face bricks in Autoclave 1, setting the asset up for a solid Q4 and the ability to maximize plant availability with no shutdowns. Meanwhile, Seabee should enjoy much higher grades in Q4, with production on track to double on a sequential basis (Q4 vs. Q3) based on guidance, with costs actually lower on a year-over-year basis (FY2022 guidance: $730/oz).
Meanwhile, from a strategic standpoint, SSR Mining acquired another 30% of the Kartaltepe Mining Joint Venture for $150 million in cash, bringing its ownership from 50% to 80%. This deal was done with zero share dilution due to being a cash deal and provides added exposure to Cakmaktepe, the Cakmaktepe Extension (Ardich) that will begin production next year, and the Mavialtin Porphyry Belt, where additional targets have been identified. Following this deal, SSR Mining will control 80% of the Copler District with minority partner Lidya, providing a nice boost to production and future growth at this high-margin asset with an industry-leading mine life (20+ years).
Overall, I like this deal a lot, with this bolstering SSR Mining’s organic growth potential at its largest contributor, Copler, on top of an already bright future at Marigold (New Millennium, Trenton Canyon, Buffalo Valley oxide targets), and the potential for production growth at Seabee (Taiga Gold acquisition & Porky target). It’s worth noting that the company also has potential growth with its high-grade Copper Hill greenfield discovery in Turkiye, suggesting that the company could grow production to 1.0+ million GEOs this decade just from its existing assets. In summary, the exploration success and bolt-on deals are quite encouraging, upgrading SSR Mining’s growth profile.
Margins & Financial Results
Unfortunately, while SSR Mining’s transactions over the past year and exploration success have been solid, the Q3 margins and financial results were hideous and significantly different from what investors have been accustomed to over the past two years. This was evidenced by all-in sustaining-cost margins [AISC] plunging from $844/oz (Q3 2021) to [-] $105/oz in Q3 2022, impacted by a weaker average realized gold price, inflationary pressures, and limited contribution from Copler due to the temporary suspension. On a full-year basis, margins will be better but will likely come in below $500/oz with cost guidance of $1,330/oz at the mid-point.
SSR Mining – AISC Margins (Company Filings, Author’s Chart)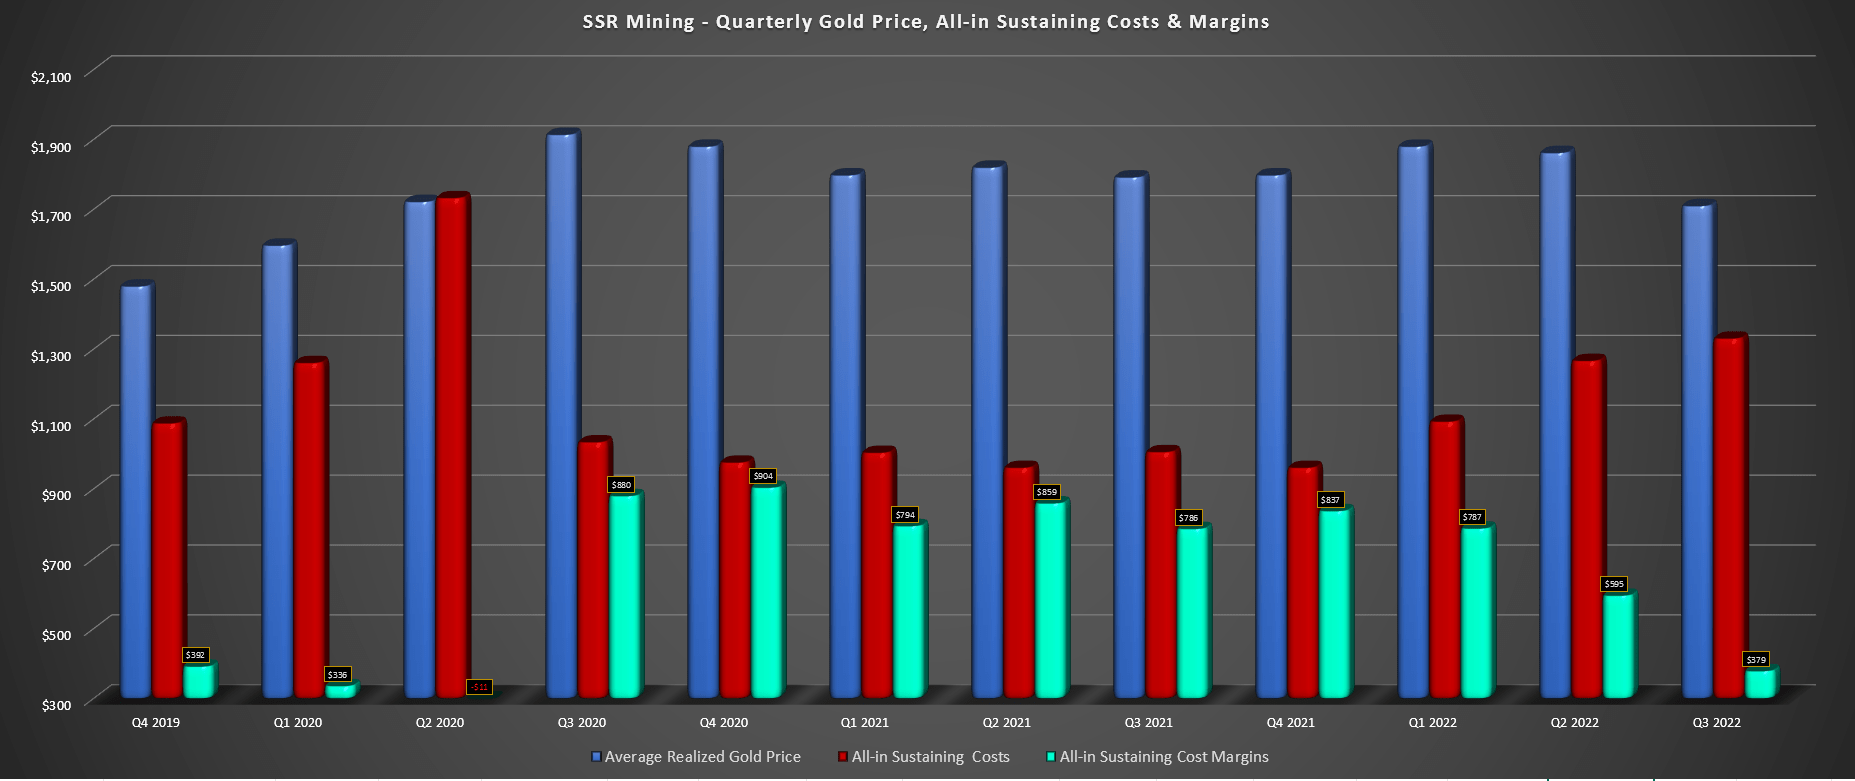
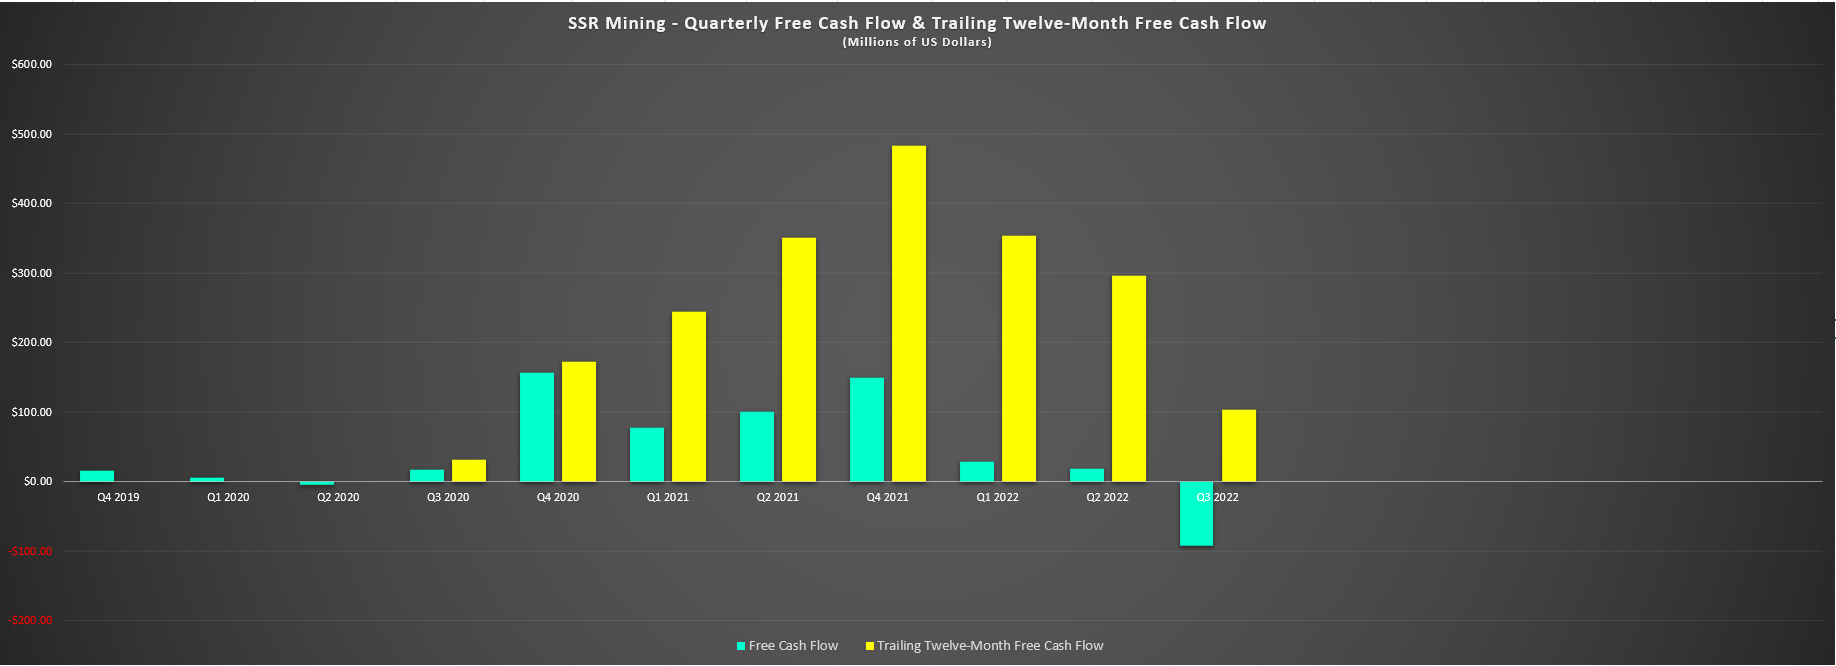
Given the lower average realized gold price ($1,710/oz vs. $1,792/oz), lower sales than production, and much lower volume due to the limited contribution from Copler, quarterly revenue fell off a cliff. During Q3, revenue came in at just $166.6 million vs. $322.8 million in the same period last year, and we saw a free cash outflow of $92 million vs. positive free cash flow of $125.4 million in Q3 2021. The result is that free cash flow is in negative territory year-to-date vs. positive free cash flow of nearly ~$300 million in the same period last year.
SSR Mining – Quarterly Revenue (Company Filings, Author’s Chart) SSR Mining – Quarterly Free Cash Flow & Trailing-Twelve-Month Free Cash Flow (Company Filings, Author’s Chart)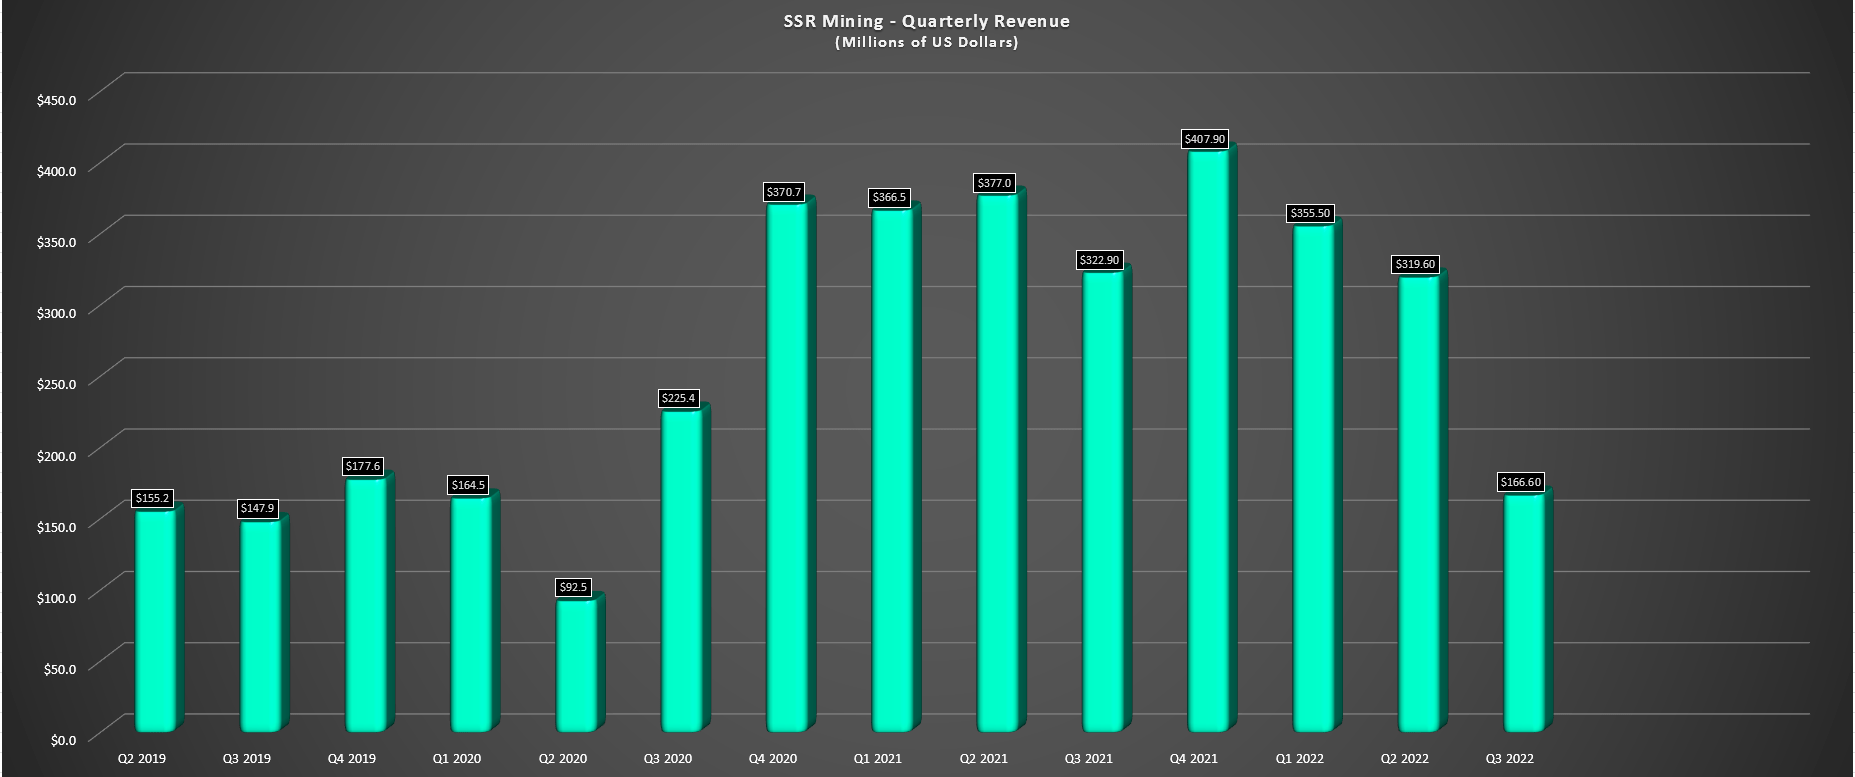
While the sharp decline in free cash flow is disappointing, the most recent quarterly results are not reflective of SSR Mining’s long-term potential nor even regular operations, with higher sustaining capital year-over-year, elevated costs due to inflationary pressures, and no help from Copler. So, I don’t see any reason to put weight into the Q3 results or to judge the company on what’s been a challenging and unusual year for a company that delivered near-flawless results in the first 18 months post-merger.
In fact, I think it’s smart that the company has been aggressively buying back shares, with over ~6.0 million shares repurchased since June at an average price of $16.53. Finally, it’s worth noting that despite ~$200 million in share repurchases, dividends paid to shareholders, and $53 million in debt repayment, the company still has one of the best balance sheets sector-wide, sitting on ~$750 million in cash at quarter-end (pre-Copler District consolidation for $150 million), and ~$465 million in net cash or just over $300 million post-Copler District consolidation.
Valuation
Based on an estimated year-end fully diluted share count of 215 million shares and a share price of $15.85, SSR Mining trades at a market cap of ~$3.41 billion. If we compare this figure to an estimated net asset value of ~$3.85 billion, SSRM continues to trade at a steep discount to net asset value at near 0.89x P/NAV, but this is based on conservative long-term gold price assumptions. From a cash flow standpoint, SSR Mining is valued at ~7.4x FY2023 cash flow estimates ($2.13 per share) vs. a 10-year average multiple of 8.7x.
The estimated share count for fully-diluted shares includes the 2019 Convertible Notes.
SSR Mining – Historical Cash Flow Multiple (FASTGraphs.com)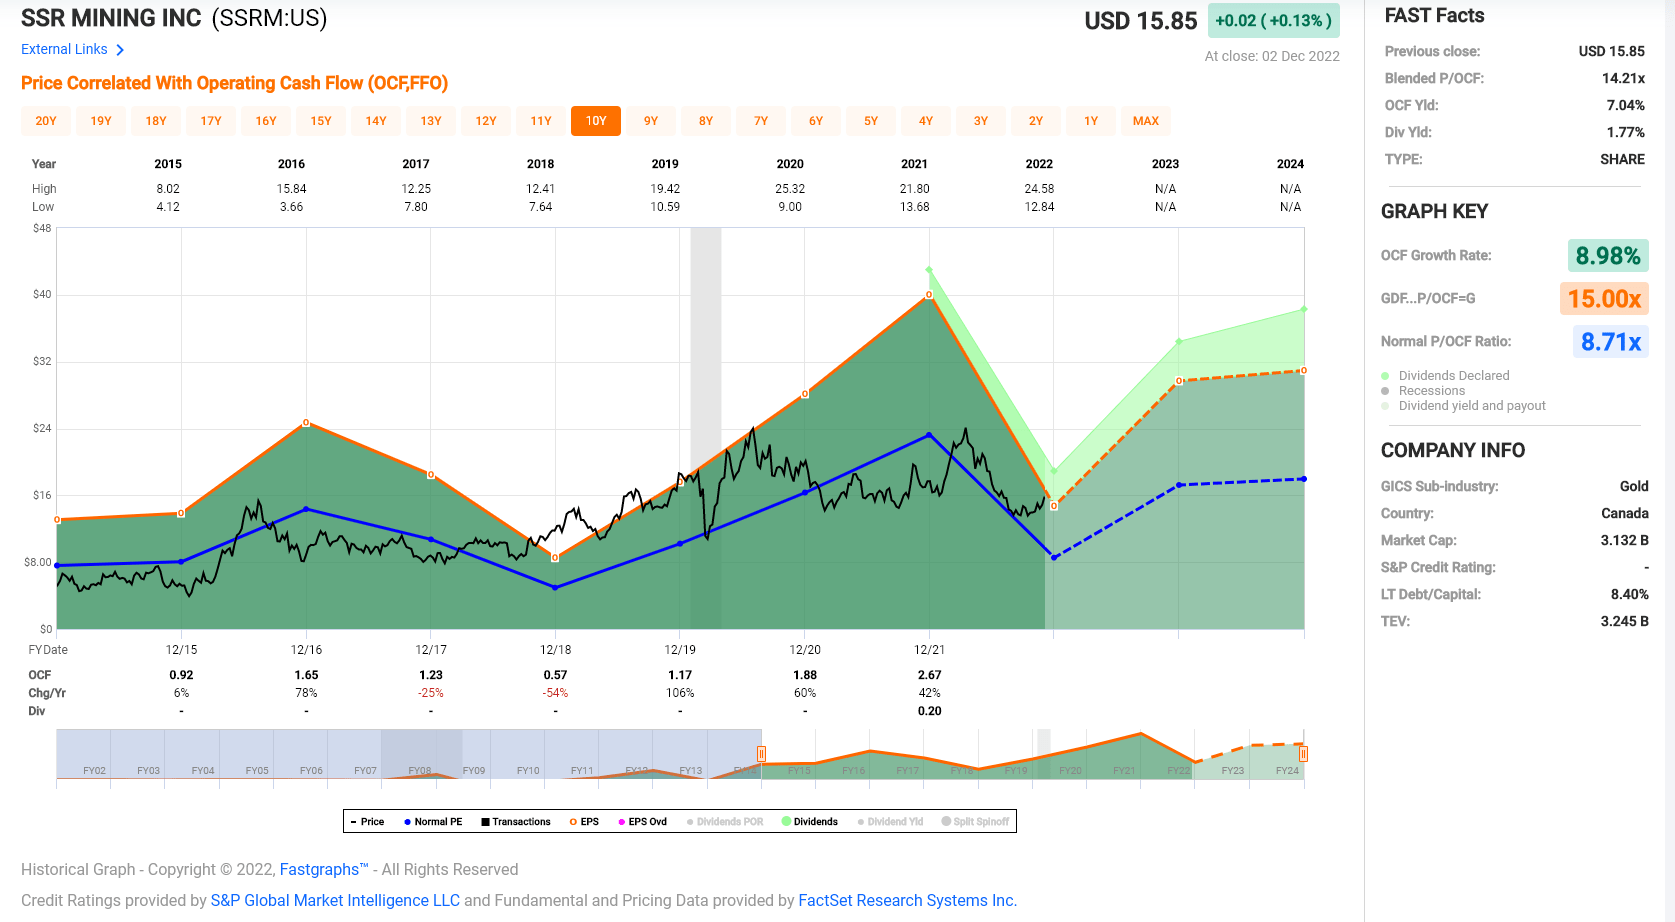
If we compare these multiples to the mid-tier and intermediate producer space, SSR Mining continues to trade at a premium, well ahead of Eldorado Gold (EGO) and Centerra Gold (CGAU) at less than 0.70x P/NAV and even slightly ahead of Kinross Gold (KGC) in the senior producer space. I believe this premium to be mostly justified given that SSR Mining has a very enviable portfolio with organic growth potential leveraging off existing assets and has done a much better job of returning capital to shareholders than its peers. Based on what I believe to be a fair multiple of 9.0x cash flow and conservative FY2023 annual EPS estimates of $2.13, I see a fair value for the stock of $19.20 per share.
Although this price target points to a 21% upside from current levels and doesn’t incorporate upside in the gold price above $1,800/oz, I am most interested in those miners trading at a deep discount to fair value with a significant margin of safety baked into them. One example is Sandstorm Gold (SAND) which trades at just 0.90x P/NAV despite a much higher-margin and lower-risk business model and industry-leading diversification (multiple producing assets with less than 45% of NAV from top-5 assets). So, if I were looking to put new capital to work in the sector, I currently see Sandstorm as a more attractive bet.
Technical Picture
Moving to the technical picture, SSR Mining has now rallied near the mid-point of its support/resistance range, with strong support at $12.30 and strong resistance at $20.40. This doesn’t mean that the stock can’t go higher, but it’s no longer in a low-risk buy zone like I highlighted in my most recent article when the stock was hanging out below $14.00 per share. So, while I would not be surprised to see further upside for the stock as it benefits from higher cash flow generation and an improvement in sentiment following a rough Q3 2022, I’m not in a rush to add exposure to the stock unless it dips below $13.90 per share where it would trade at a 30%+ discount to fair value.
SSR Mining Weekly Chart (TC2000.com)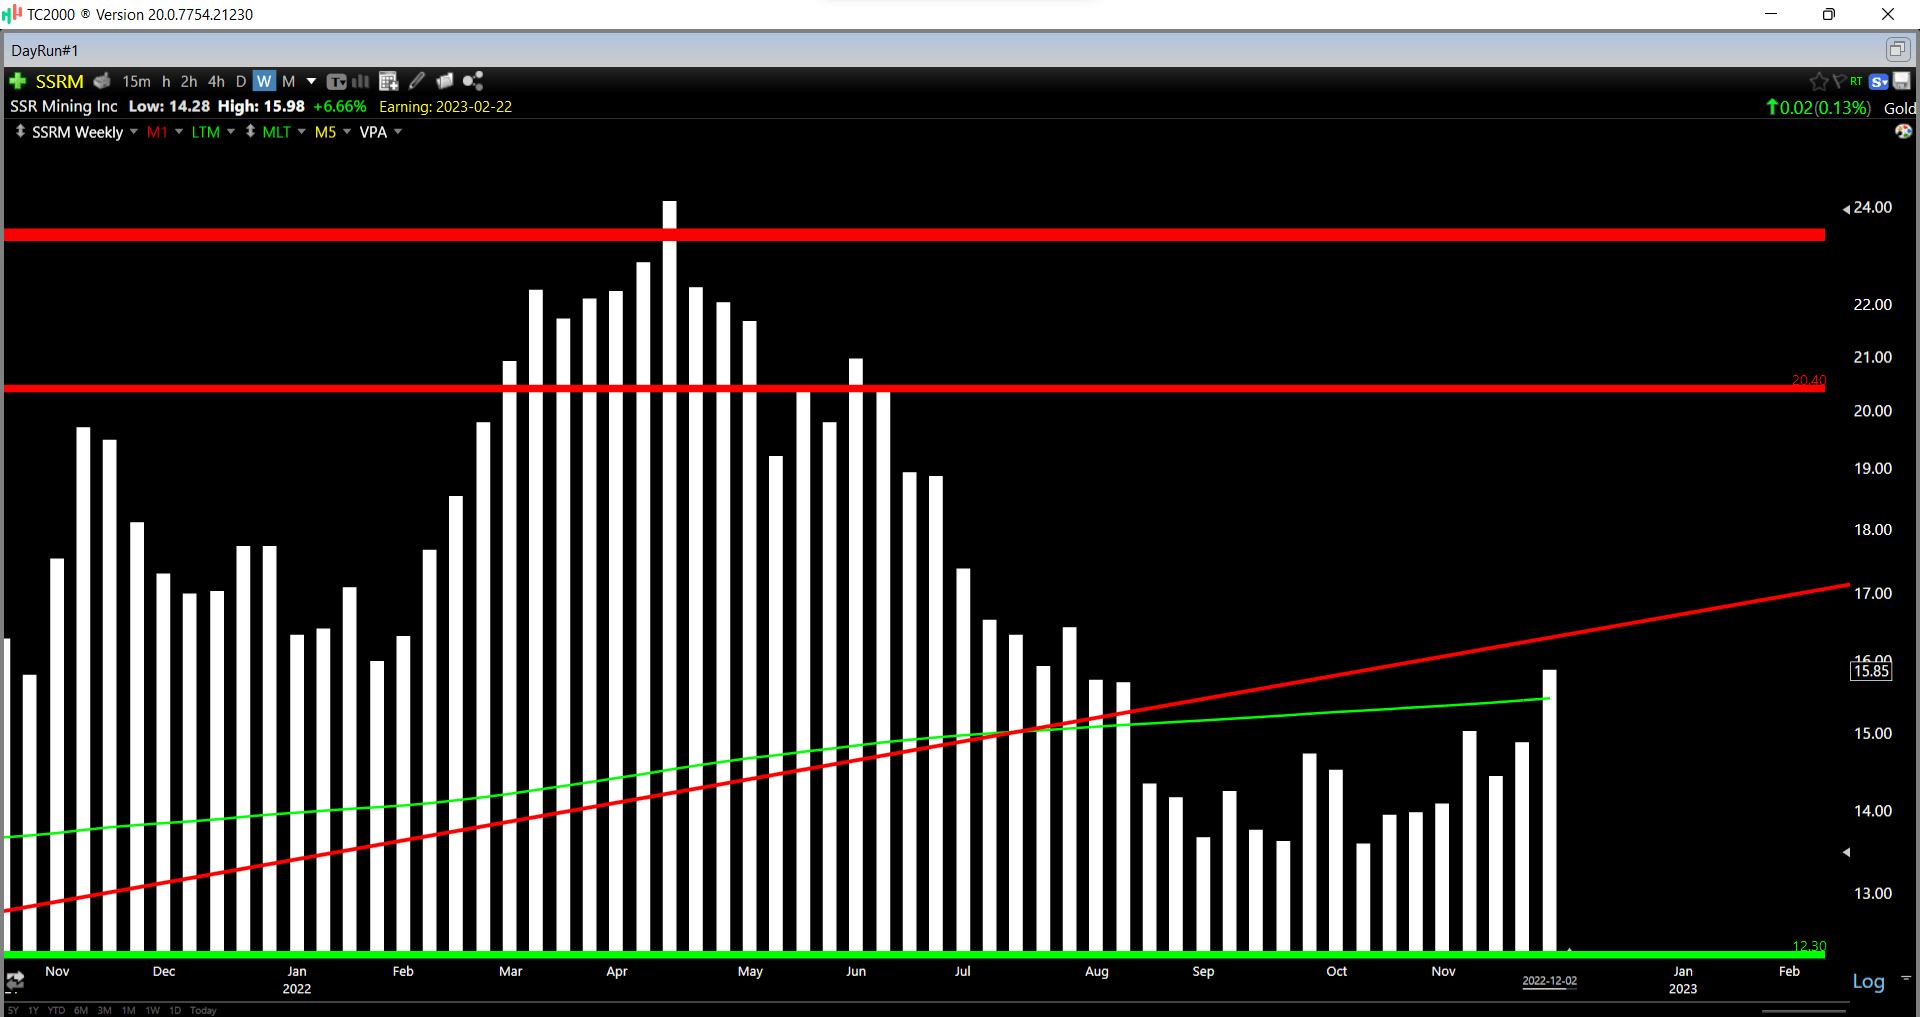
Summary
SSR Mining’s headline results might leave a lot to be desired. Still, the company continues to offer industry-leading shareholder returns, has continued to be disciplined (small and strategic acquisitions that leverage off existing infrastructure), and has enjoyed exploration success across its portfolio. This points to a very bright future for the company and potentially a path to ~1.0 million GEOs per annum by the end of this decade. That said, I see the ideal buy zone for the stock being below $13.90, so I am not long the stock currently.
Be the first to comment