

John Moore/Getty Images News
Summary
The key driver for further share performance is LCE (lithium carbonate equivalent) prices. However, given that LCE prices increased 170% in 2022 (to US$80k per ton from US$30k) the market focus is on when and how far LCE prices decline. While this may sound odd or counterintuitive, this is market psychology. It appears that investors deem current LCE prices wholly unsustainable. But are they? I looked at EV battery and EV automaker margins as a sanity check and found reasonable absorption that may suggest LCE prices could stay higher for longer. Finally, I conducted a sensitivity analysis for declining LCE price scenarios on Sociedad Química y Minera de Chile’s (NYSE:SQM) share valuation.
SQM has outperformed Albemarle (ALB) and Contemporary Amperex Technology or CATL, the top global EV battery maker.
SQM share price performance vs ALB and CATL (Created by author with data from Capital IQ)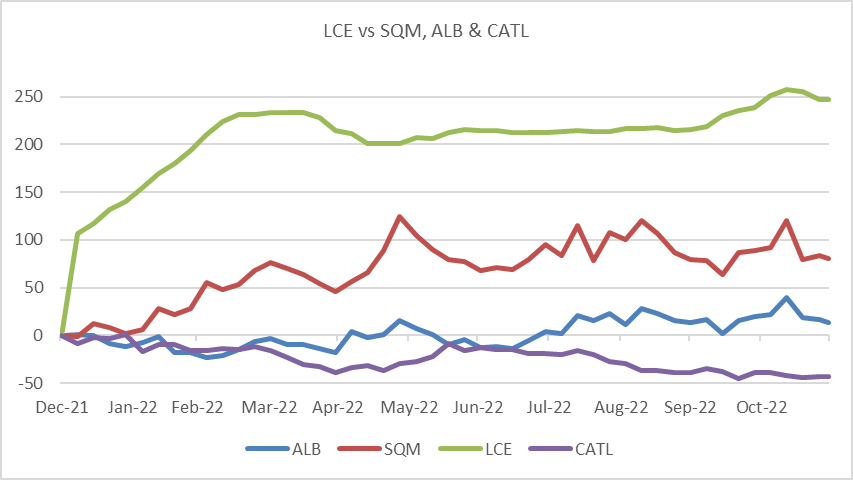
Sanity Check: LCE Cost Impact on the Supply Chain
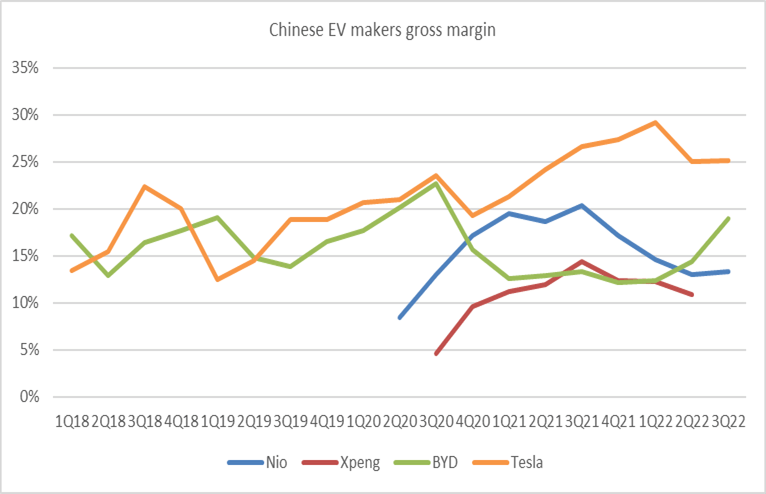
The largest EV market is China, and the largest battery maker is CATL. I looked at the company’s gross margins to gauge how LCE prices (as well as other battery metals) may have impacted its cost structure. This provides an idea of the supply chain’s ability to absorb LCE prices. If margins were under 10% it becomes clear LCE prices are not sustainable. However, the picture points to a different situation. Gross margins declined from 35% to 14% as LCE prices rose, and then we see a recuperation in margins as the battery maker passed on higher costs to the EV makers. In turn, the top EV makers also saw a dip in margins and a recuperation in 3Q22. This suggests that demand and pricing power is strong, with 3-month delivery waiting periods.
It seems that a redistribution of margins from battery and EV makers to raw material providers is or has been achieved without significant stress to the end consumer, so far.
EV Battery gross margins vs LCE prices (Created by author with data from Capital IQ) Chinese EV maker gross margin evolution (Created by author with data from Capital IQ)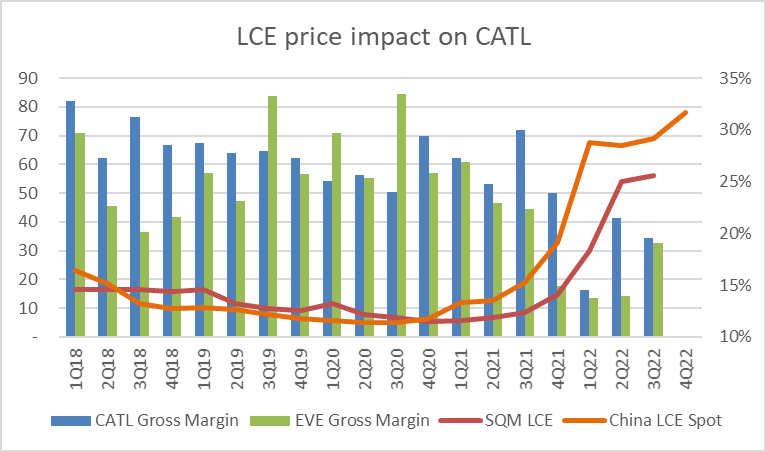
The Chinese EV battery industry is expected to increase capacity by 30% in 2023 according to BofA, or 3x 2020 capacity. This bodes well for raw material suppliers, especially with current prices well absorbed by the supply chain and consumers. The main short-term risk is if China cuts or reduces EV purchase subsidies more than already expected.
.
Chinese EV Battery Capacity Expansion (Image by BofA)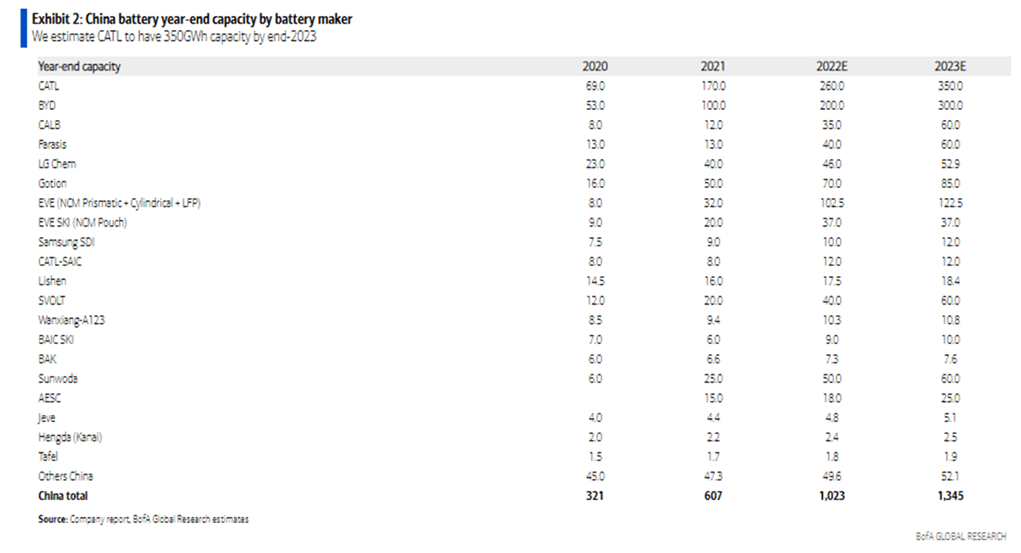
The demand supply equation favors raw material suppliers for now and may continue for a longer time frame than the market may expect. This depends on how fast EV and battery production grows vs LCE capacity. The data is not easy to come by, but SQM and ALB seem to be very comfortable moving to market or spot pricing vs long-term fixed price contracts. It’s very likely they have better visibility as to the demand and supply equation than financial markets.
LCE Prices Forecasts are Dispersed
My guess is that LCE prices may decline to US$30k ton by the end of 2023 and stay in that range for several years as new capacity struggles to keep up with demand. However, I do not believe prices will collapse to US$10k ton since the cost curve indicates that many new raw lithium sources from clay, spodumene, mica, etc. are above that level. While at the same time demand growth is exponential as the global automakers are forced to rush to production of EVs as they face literal extinction of the internal combustion engine. One may argue that the government mandates may need to be pushed back due to the lack of supply chain, especially in battery production. Both scenarios bode well for the raw material suppliers in the medium term.
LCE Cost Curve (Image by Pan Asia Metals)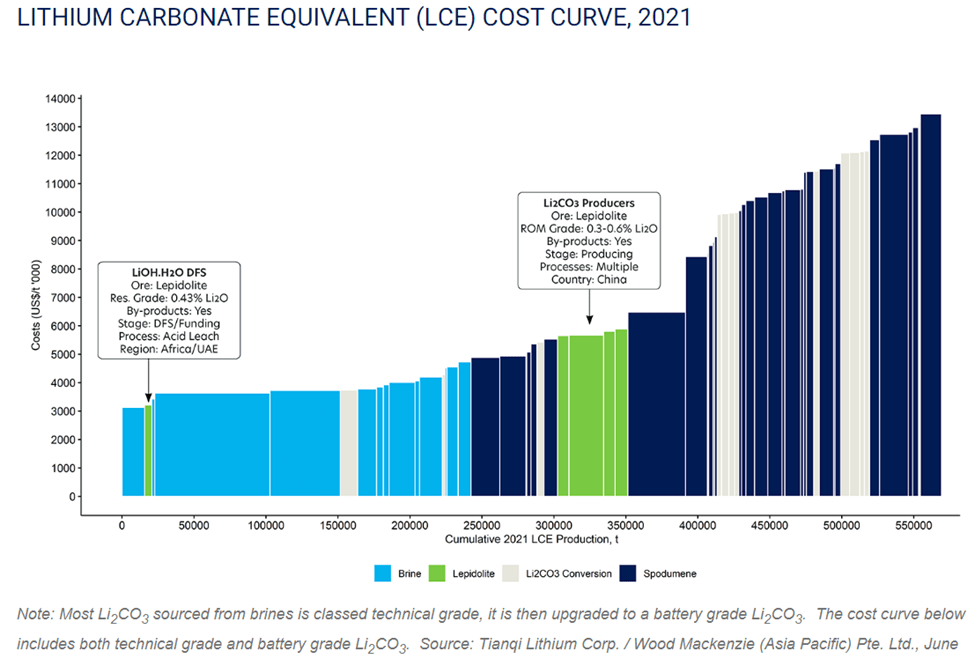
I have seen research for LCE price from US$16k ton to US$60k ton for 2023. Quite frankly it is guesswork, but one thing is certain, current prices are being absorbed by the battery makers and passed on to the auto manufacturing and the final consumer. There has not been EV demand destruction as far I can see.
Market LCE price forecast vs spot and cost prices (Created by author with data MS, JPM, GS, BOFA, and Investing.com)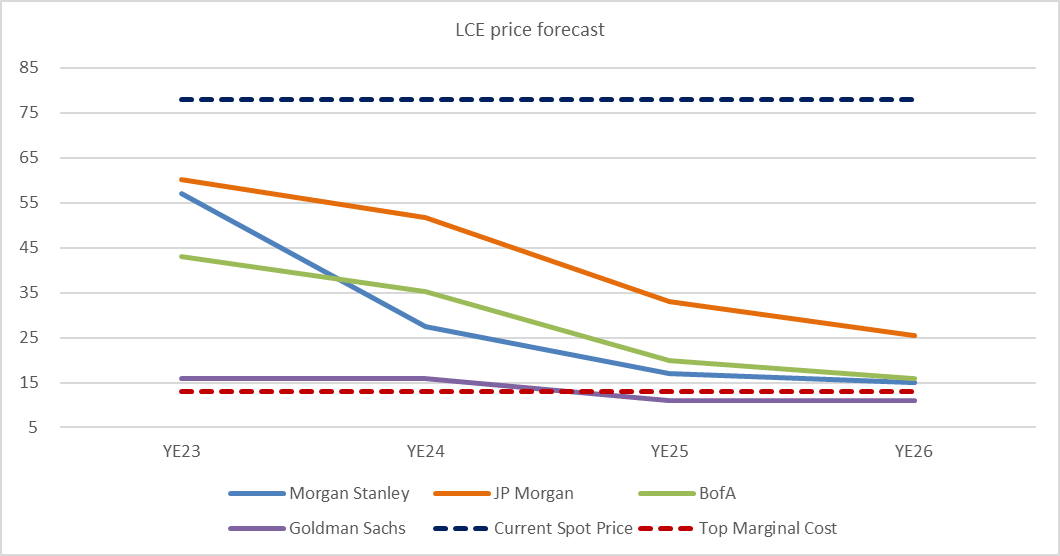
Sensitivity Analysis: SQM Valuation on Different LCE Prices
I conducted a sensitivity analysis to better gauge the value of SQM under various price scenarios. Volumes are the same, the fertilizer and iodine business are the same, and I used gross margin of 55% across the price curve, which is conservative given recent data points. I also assumed a 10x EV/EBITDA target price multiple, also relatively conservative vs history and SQM´s growth and cash flow profile.
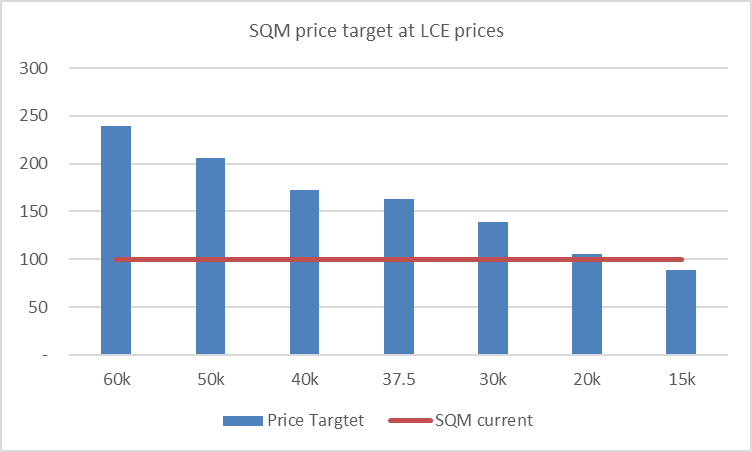
The result is that the market is pricing SQM at around US$20k ton of LCE for YE23, a far cry from the US$56k realized in 3Q22 and spot prices north of US$78k.
SQM valuation for LCE price estimates (Created by author with data from SQM) SQM Valuation vs LCE Price Sensitivity (Created by author with data from SQM)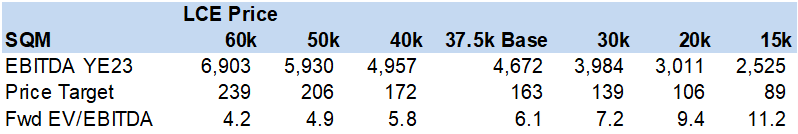
Financial Estimates Summary
SQM has a solid balance sheet with near zero net debt even as it pays 100% of earnings as dividends. Its capex, while aggressive at around US$800m a year is funded by cash flow.
I value the shares at 10x EV/EBITDA vs historical levels closer to 12x. On my LCE price of US$30k ton, I arrive at a significantly undervalued stock with almost 100% upside to 2025.
SQM Financial and Valuation Summary (Created by author with data from SQM)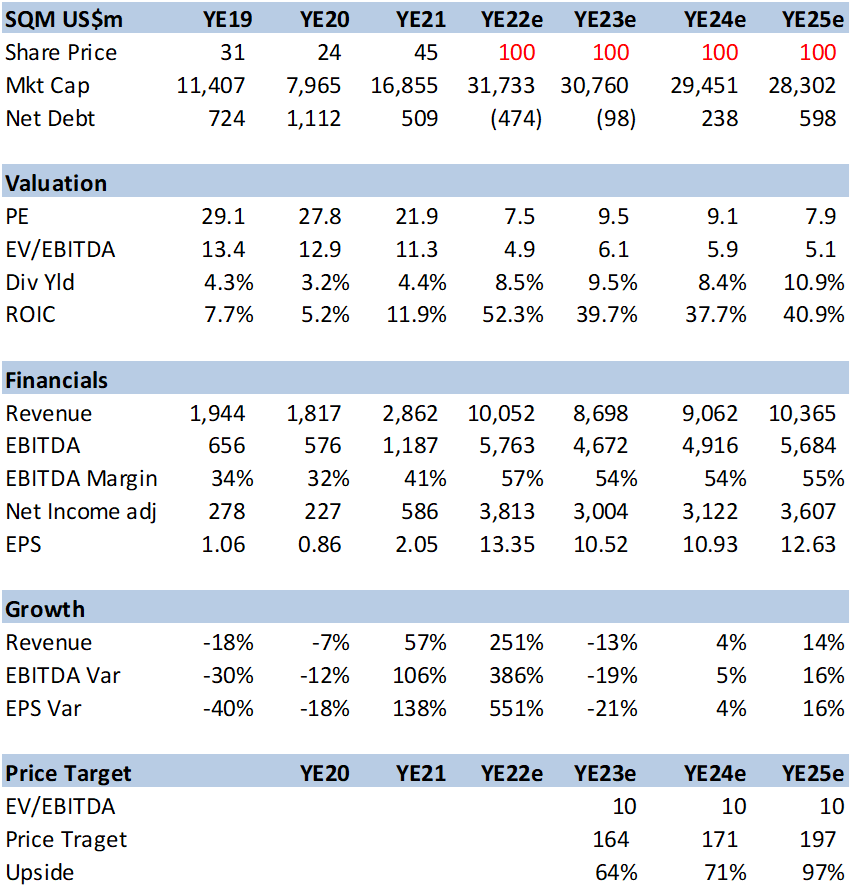
Conclusion
SQM is a lowest cost producer of LCE that should grow volume by 30% a year on EV adoption. The stock’s valuation has not kept up with EBITDA growth or LCE prices due in part to Chile’s political risk perception as well as expectations of a decline in LCE prices. I believe the shares should recover to 10x EV/EBITDA multiple as this political risk wanes and LCE prices stay higher for longer.
Be the first to comment