

DNY59
In my latest article published on (NYSEARCA:SPY) a few weeks ago on Seeking Alpha, I refreshed a bullish thesis for the upcoming days or weeks. And although I was aware of worsening macro but a slight improvement in inflation expectations, the main target was a bullish position or a bet on a short-lived bear market rally. The market was extremely oversold and it was a perfect fit to be bullish as SPY got to very rare levels where odds on the bullish move were huge. The market’s potential is exhausted or just the odds of being bullish are not significant as some fundamentals got worse, earnings season was mainly negative, and many leading indicators continued to deteriorate. Even if the Fed reveals a less hawkish stance, it could pull down short-term real yields, but maybe it won’t be enough to save the following 1-3 quarters (in case of earnings).
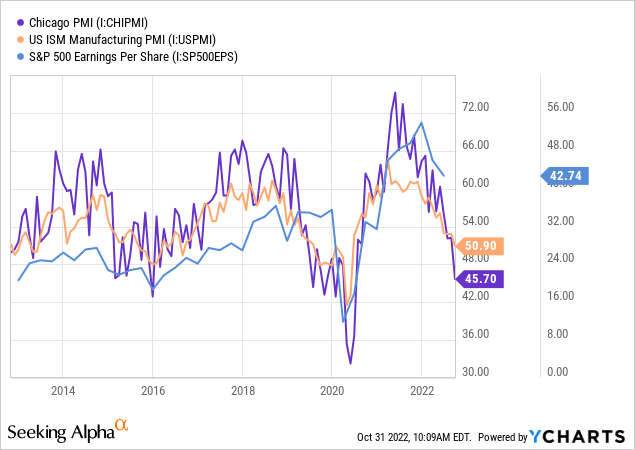
Worsening PMI and strong dollar will drive down EPS
Almost every month, PMI (worldwide) is beating consensus downwards with a negative surprise. This is only bad news because the economy has started to slow down, and it was a sign that EPS needs to be adjusted down or we will achieve a big negative surprise.
It’s always good to look at the local and global figures as many US companies are international. With the combination of DXY being strong, the other currencies rapidly depreciate and US products become more expensive for foreigners to buy from US companies (in dollars). The result is weakened demand, which will impact companies’ revenues negatively. Another excellent indicator of the manufacturing cycle is the PMI New Orders-Inventories gap, which narrows as the manufacturing cycle decelerates. You can see it with this great cycle from MacroMicro:
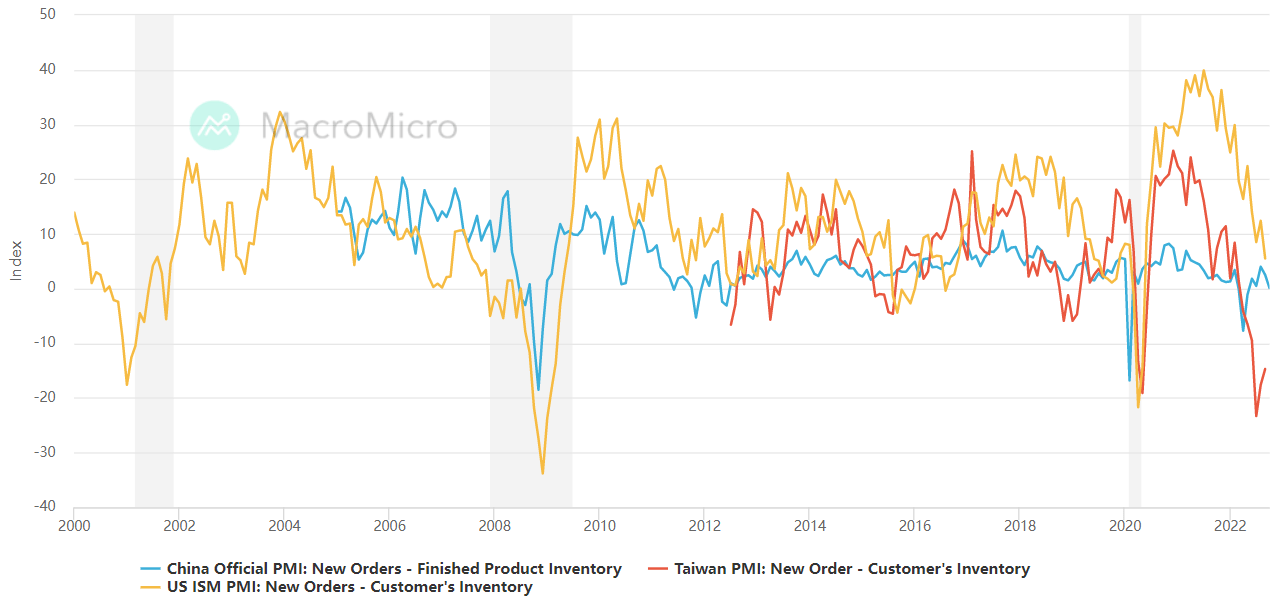
Manufacturing Cycle – New Orders minus Inventories (MacroMicro)
Now, let’s look at the Citi Earnings Revision Index, which reflects the current revision trend. With current macroeconomic conditions, such as high interest rates, high inflation, wage pressures, a monitored slowdown in the economic cycle, and lowered demand, it is much harder to estimate EPS. However, if the lower PMI or other leading indicators continue to beat consensus estimates (downwards), we can expect EPS misses to follow. It is widely expected that companies will continue to reduce their operating margins and that the Citi Earnings Revision Index will turn more negative. Taking a close look at the current levels, I think we will see more downward revisions, as shown in this index, to the levels of 2015 and 2019, and maybe even lower.
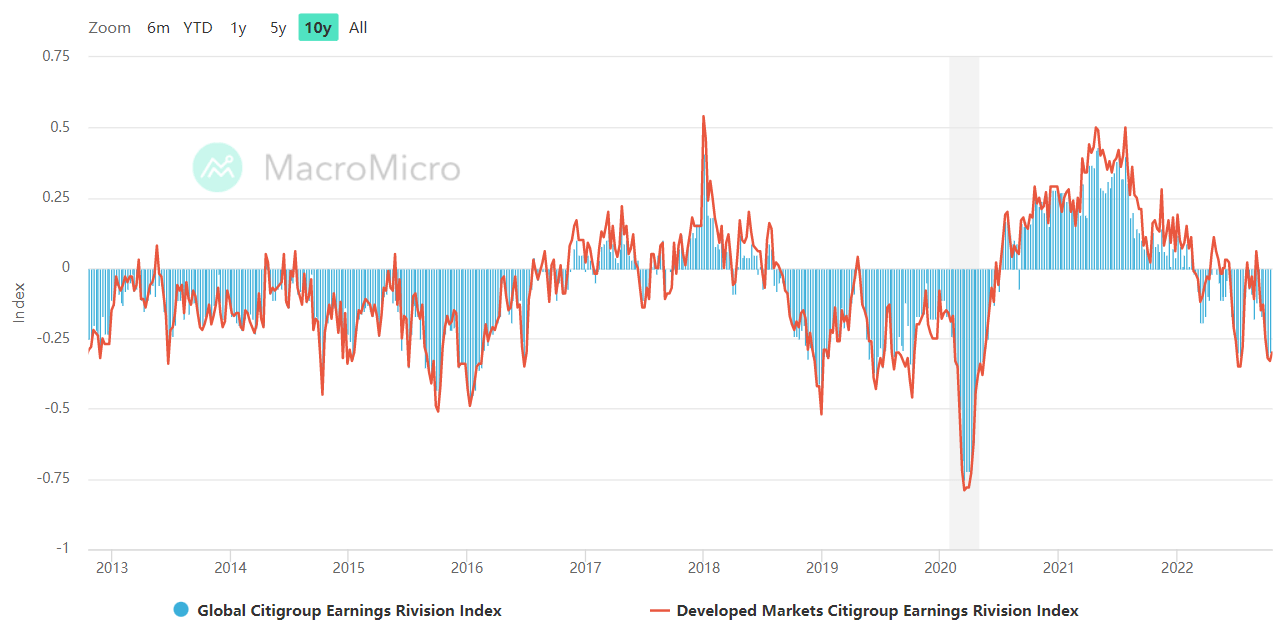
Citigroup Earnings Revision Index (MacroMicro, Citigroup)
Valuation and positioning
In the case of valuation and positioning, there is still room for further improvements. We saw a lot of charts that compared 12M Forward EPS to the S&P 500 price. However, it can be a good way to look at the market valuation. The issue is that when we expect a further deceleration in EPS, it can give us messy information. The problem is that we won’t know how the earnings season will finalize at the end of the day, but in my opinion, there is room for another decline.
However, looking at the Forward 12-Month P/E, the current levels could be considered cheap because they are below the 5 and 10 year averages. The issue with such a valuation approach is, as we said previously, that earnings can worsen rapidly. And, if realized, the 12M Forward P/E would be higher than the current 16.3. This is one of the key points we need to bear in mind.
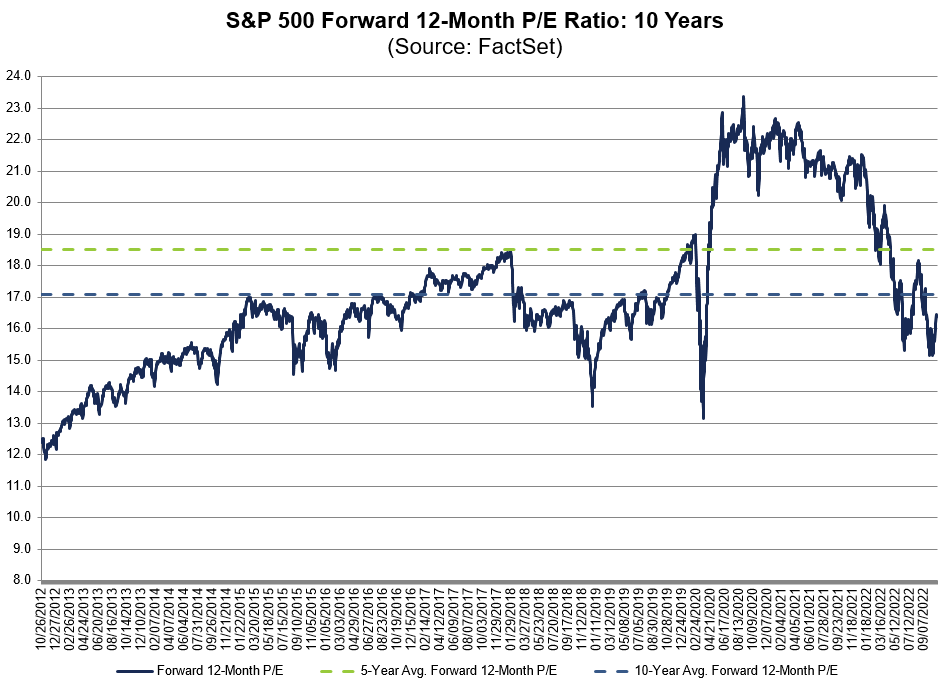
S&P 500 Forward 12M P/E (FactSet)
Secondly, and in my opinion, with very great certainty, we will not see as much monetary and fiscal support as we saw during 2020 and 2021, thus such extraordinary high values are pointlessly increasing the average. Maybe we will see one, but it had to be a huge financial crisis to convince the Fed to make such a political move. Back to P/E, the Shiller P/E Ratio (of the S&P 500), which is currently near 29, is much more useful for historical concepts, but the dot-com peak was a little worse according to such metrics.
For many reasons, we just can’t expect that fair value to be at the historical average of 17.3 for historical development. To explain the reason, we need to go knock on the door of monetary policy makers. There are many studies which reflect that eased monetary policy supports higher valuations. Moreover, it was also the case of the dot-com bubble as well as the 2020–2021 time horizon. When you look at the historical chart of 10 US Treasury yields, you will see a long-term deceleration. It is caused by the more leveraged financial system as well as the ability of the Fed to raise enough to combat inflation and, finally, due to the historical decline of the neutral rate.
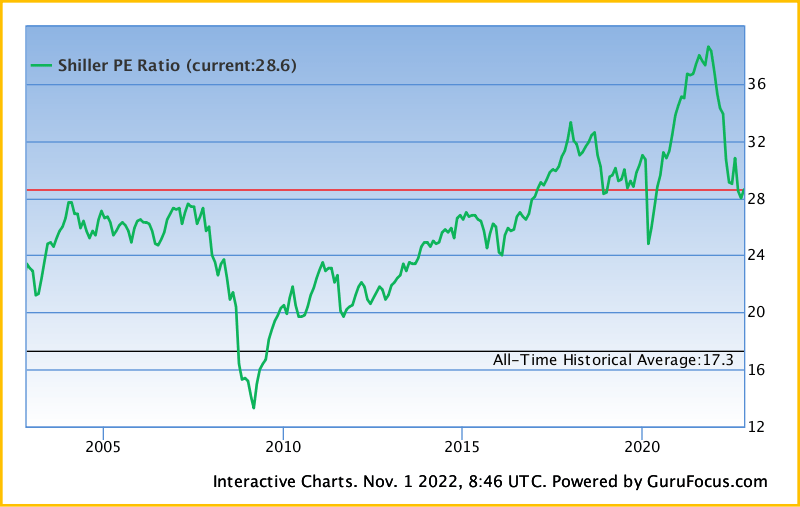
Shiller P/E ratio (S&P 500) (Gurufocus.com)
So, looking at the valuation is much more complicated than looking at the ratios because of the current cycle of monetary and fiscal easing and tightening trends. I do not consider the market to be cheap because we were in an era of QE during the most recent 10-year horizon of the chart. Currently, we are in an era of QT and tightening, and when the course does not reserve, such levels are not cheap in the medium term. However, in terms of long-term wealth accumulation, such a decline in SPY could be considered bullish.
I see plenty of opportunities in the market, as some great companies are starting to be really undervalued with a great growth track record. However, in the case of equity positioning, we are still not even at the levels of 2016 and 2020 equity positioning bottoms. Not even a 2009 one. The bottom is probably still not in. However, this sample is made from BofA’s private client equity holdings as a % of AUM, not the overall market.
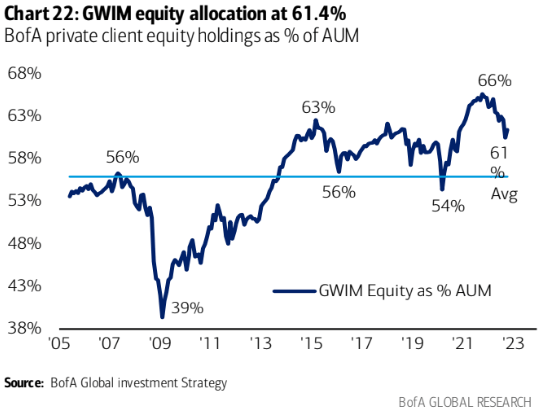
BofA Equity holdings as % of AUM (BofA Global investment Strategy)
Inflation expectations and rates probability
However, I think the financial system is overleveraged and could not handle additional hikes as we saw during the previous months. I firmly believe that central banks won’t stop hiking, but now they will be more cautious because the system is significantly under pressure. For example, the situation with the Bank of England and pension funds, the Bank of Canada (to deliver fewer hikes than expected), the ECB with updated forward guidance (less hawkish), and so on. The FOMC will confirm if we will see less hawkish forward guidance from the Fed as well or not. In my previous articles, I talked about such a situation and came to the conclusion that, based on the latest projections and dot-plot, the Fed and other central banks will not follow through on their promises to raise rates in 2023 in such a manner due to systematical and financial instability risks.
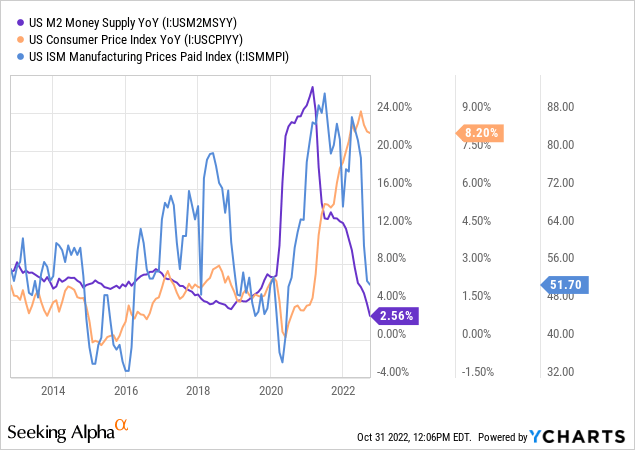
For now, we don’t know if there is another way to calm inflation without recession. With a recession looming, it would be much easier to clear the market and cool down the prices. Without a recession, it could be much harder to achieve as wage demand pressures are fully on. However, there are some indications that inflation will go down, as M2 on YoY is down, as well as commodity prices are down, as well as ISM prices.
However, the development in the shelter, which is the most lagging component of the CPI basket, has a significant impact on both core inflation and headline CPI. And this one item, we can say it’s the leader among inflation items with a high weight. Following the chart below and home price MoM development, we will also be able to see a drop in shelter in the following months. Thus, core and headline CPI could go down faster.
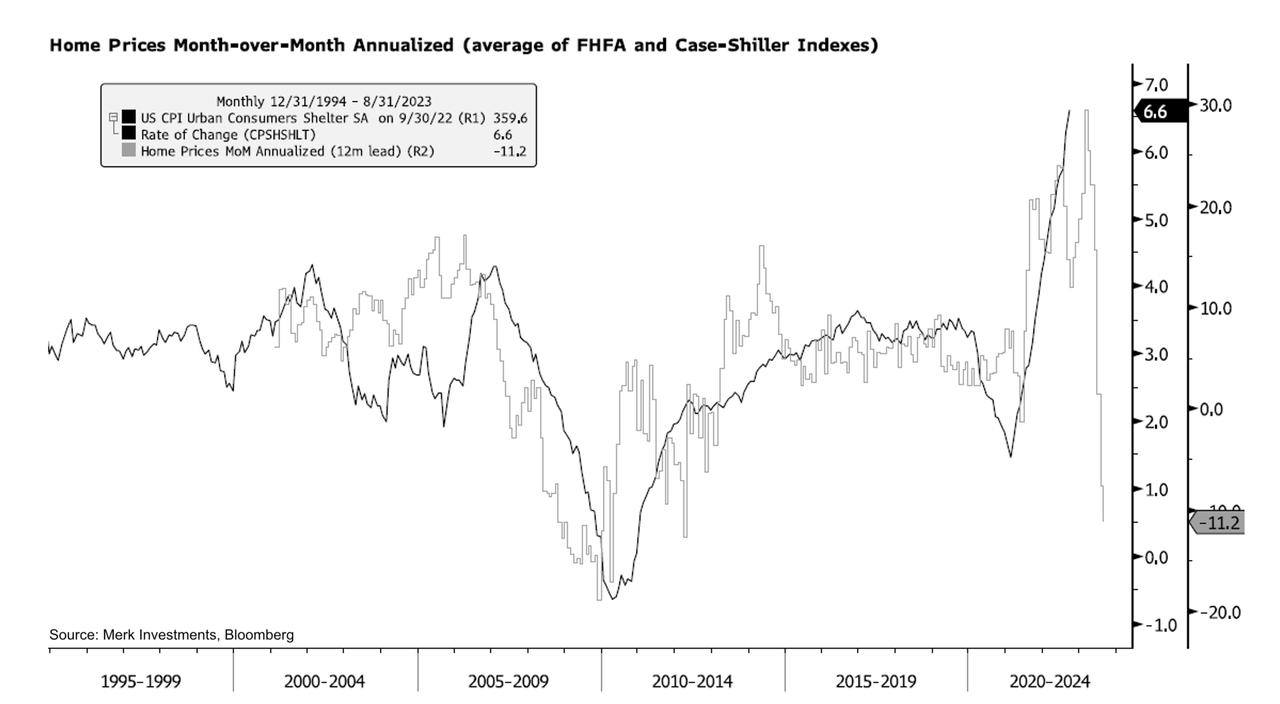
Home Prices MoM Annualized (Merk Investments, Bloomberg via @nicholastreece)
However, this is an issue with the FOMC approach. They want to see substantial progress in MoM core inflation and the trend, which is currently not coming, although YoY found the peak due to the base effect. When we look at the forward-looking indicators, such as the very important Michigan survey, the forward-looking slightly improved from the peak in June, but slightly bounced back in October. According to participants in the survey, inflation expectations for the next year stand at 5% and for the next 5 years at 2.9%. Well above the Fed’s target.
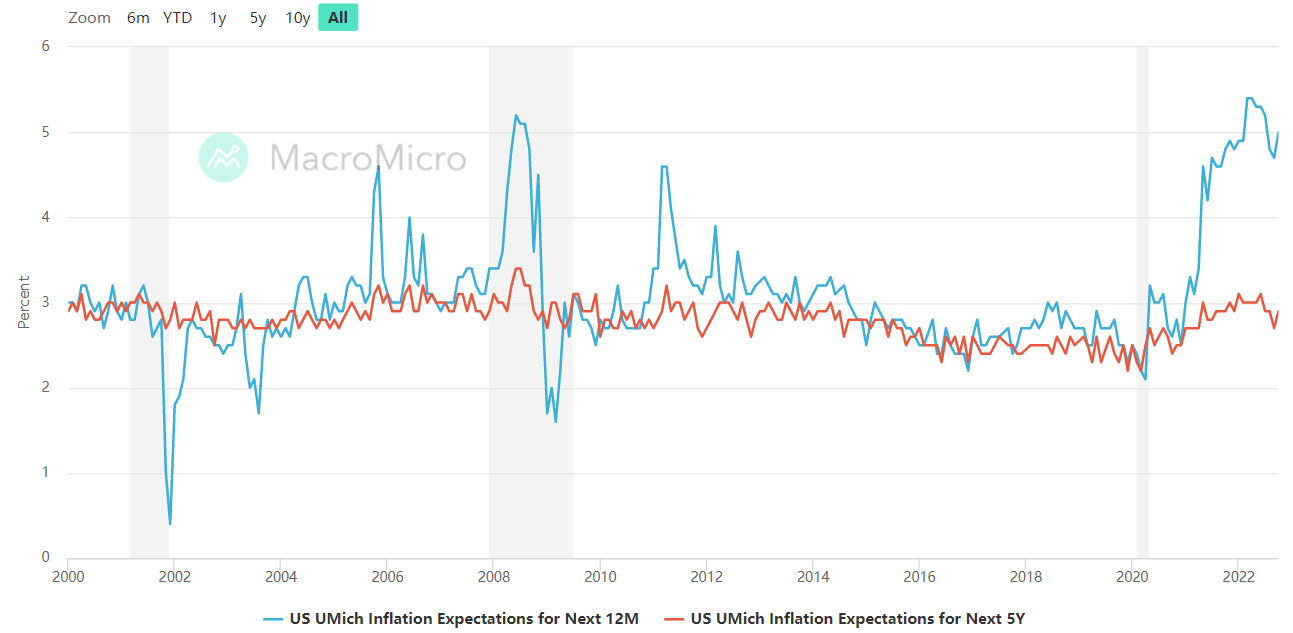
US UMich Inflation expectations (UMich via MacroMicro)
Another way to look at the medium-term outlook is via inflation swaps, breakeven rates, or other options. The insight below from Investro suggests that both ways of measuring medium and long-term inflation expectations increased in October (also impacted by oil prices).
In conclusion, such a set-up:
- The short-term Core CPI MoM figure is poor because there has been no significant change in trend,
- while medium-term inflation expectations (as measured by the UMich survey or the breakeven inflation rate) deteriorate,
- as a result, the Fed will remain hawkish until financial instability risks (liquidity and price risks) do not outweigh inflation risks.
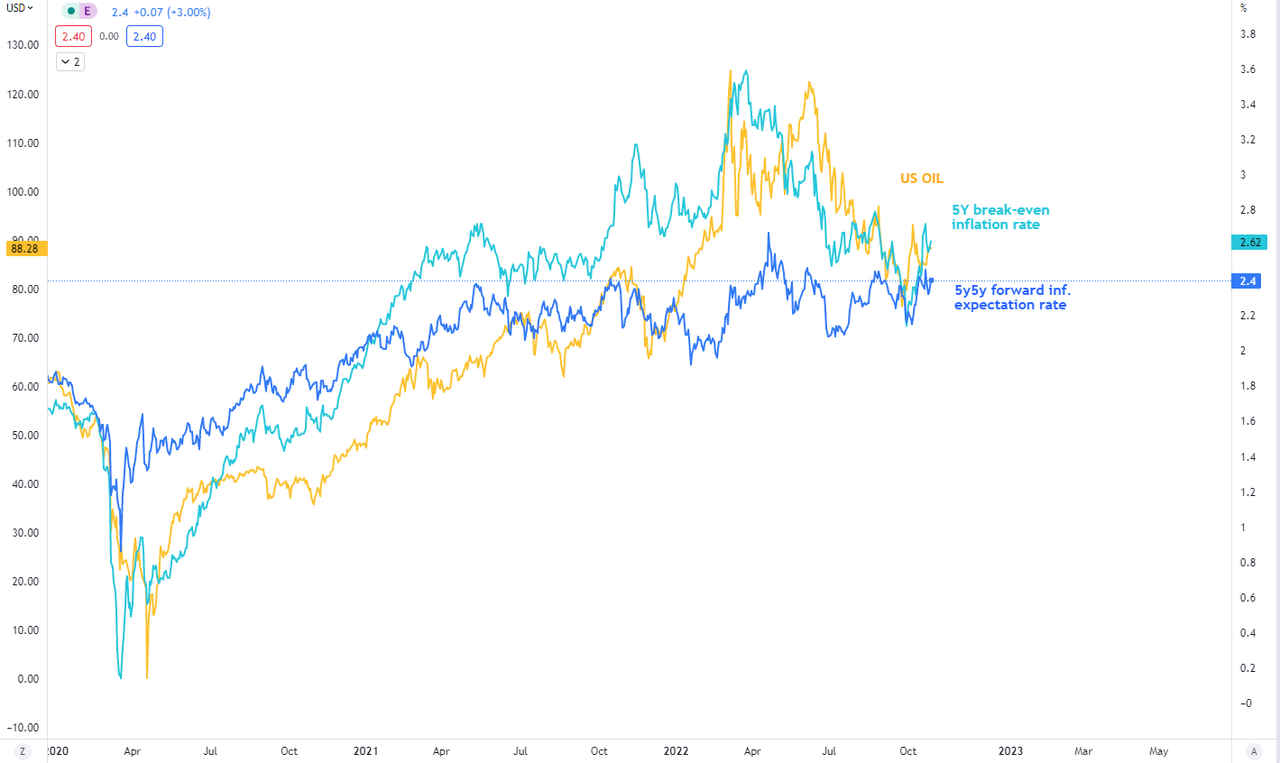
5y5y Inflation Expectations, 5Y Breakeven IR, Oil (Investro)
It is great to look at the odds of the following rate hikes till the end of 2023. During July, there had been almost 0% probability that the Fed would hike into a range of 4.0-4.25%, and on August 11th, there had been only 1% probability that market rates at the year-end of 2023 would be between 4.0 – 5.0 %. It is absolutely stunning, because now, with the same range, the market price in 84.8% probability. In my view, these odds can frequently change, and it is absolutely unknown if we will see rates in such a range, despite whatever the FOMC talks about.
In my view, the market absolutely underestimated the return to a 2-3% rate in 2023, so the market had been fully convinced by the Fed about its policy. It is a massive opportunity for a contrarian view in bonds, e.g. TLT or AGG or even TIP, because with every increase in the probability of lower rates, yields could slump. However, in the case of SPY, it will be more about which of the “forces” – EPS vs. increasing odds of lower rates-would be more significant. In my view, we are only at the beginning of EPS deceleration (see the Q3 tech results) and probably more pain will follow as leading indicators are still getting weaker. So to change my mind in the following 1-3 months, it will be decisive to see improvements in some leading indicators or a reversal of the course of monetary policy. On the other hand, it does not mean there could be no short-lived bullish opportunities, as I revealed in the analysis at the beginning of October.
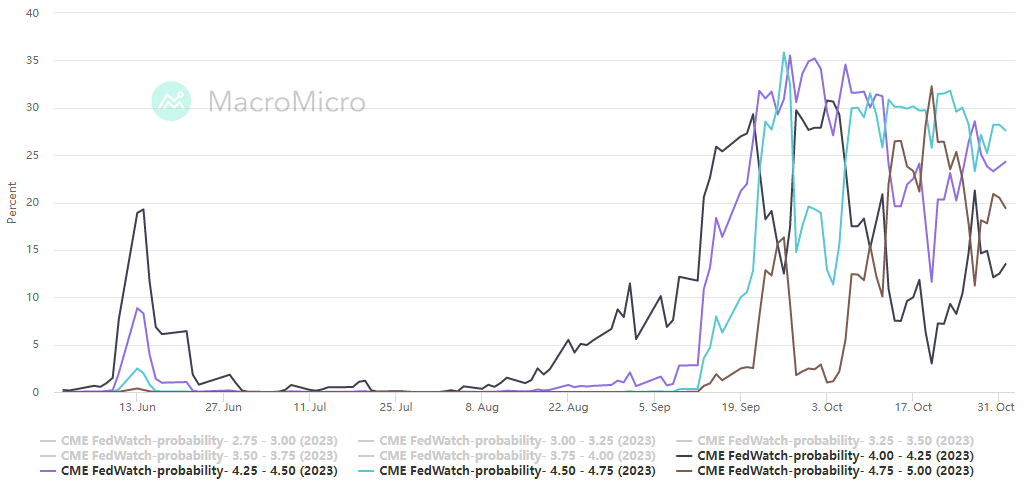
2023 year-end rates probability (CME, MacroMicro)
Seasonality
There has been a lot written about the S&P 500’s seasonality two months ahead. The great chart from Topdown Charts reflects a great view of how the whole year develops but also reveals the view of how the seasonality develops in bull and bear markets. Although the seasonality is in general very positive in 4Q every year, we can see that during the bear market it is a little bit different. Of course, I do not know what will happen, but seasonality remains one of the risks of this bearish thesis. This factor is being mitigated by the seasonality development in the bear market, which remains negative in general.
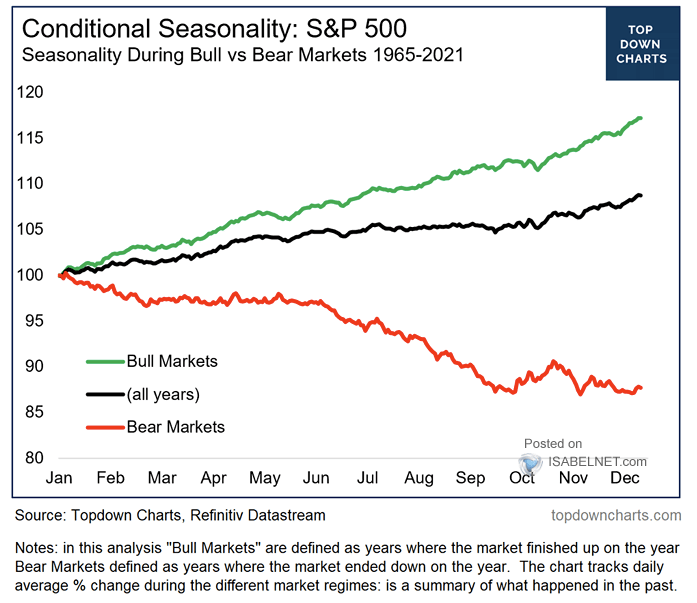
Conditional Seasonality: S&P 500 (Topdown Charts, Refinitiv Datastream via ISABELNET.com)
Risks and Summary
In my opinion, most of the macro leading indicators are worsening every month, and with the combination of higher rates (cost of debt), still not easing monthly inflation prints, and continuing wage pressures, the company’s margins will continue to be pulled down. As a result, operating and net income margins can decelerate, which could result in lower EPS than the analysts expect. We saw that in the latest earnings season (Q3). So until some leading indicators are “down enough” or reverse due to improving conditions, it won’t change my medium-term bearish note. However, in the long-term investing cycle, the current prices are favorable. Shiller P/E for the S&P 500 remains high, as does equity positioning.
This week the FOMC will take place and I think that it will be one of the most important meetings as several central banks worldwide have started to be “less hawkish” than in the previous months. It is very understandable as financial stability and liquidity in the bond market are in a risky mode, so it will be very important how the Fed reacts to such risks. To be honest, given the inflation data and medium-term inflation expectations, the Fed should maintain its hawkish stance even if they know that rate cuts are more likely in 2023. As the FOMC’s members said in the latest interview, November’s 75 bps should be “deal done”, but they could debate a further hike size, so 50-25 bps hikes could follow in the next few months. However, in my view, any “less hawkish” view could be considered a bullish view, so yields could slump and SPY could go rapidly up. However, just a slight improvement in hawkish monetary policy could not have such a big impact on further EPS development but could be bullish for bonds. Much will depend on the following forward guidance. And don’t forget, as of November 1st, the market just priced in only a 5.6% probability of rates being in a range of 2.75–4.00% at the year-end of 2023. As a result, a significant shift toward dovish monetary policy could spark a bullish rally in the bond market, followed by a rally in the stock market.
Except for the possibility of a more dovish Fed (than expected), another risk associated with this thesis is seasonality. The current time horizon till the end of the year tends to be bullish. However, this factor is being mitigated by the statistics from the bear markets, which confirm that 4Q seasonality tends to be weak. Even though leading indicators are getting worse, I wouldn’t be confident in a bullish change of mind until some drivers are confirmed, like a resolution to the Ukraine-Russia conflict, higher retail sales, or a better short- and medium-term outlook for inflation. On the other hand, I see plenty of cheap and great stocks right now in the market.
Be the first to comment