

anankkml/iStock via Getty Images
Fundamental model
S&P 500 (SPY) could be anywhere from 40% to 50% overvalued. Before I explain, let me briefly present my fundamental model. Here is the visual:
Global Academic View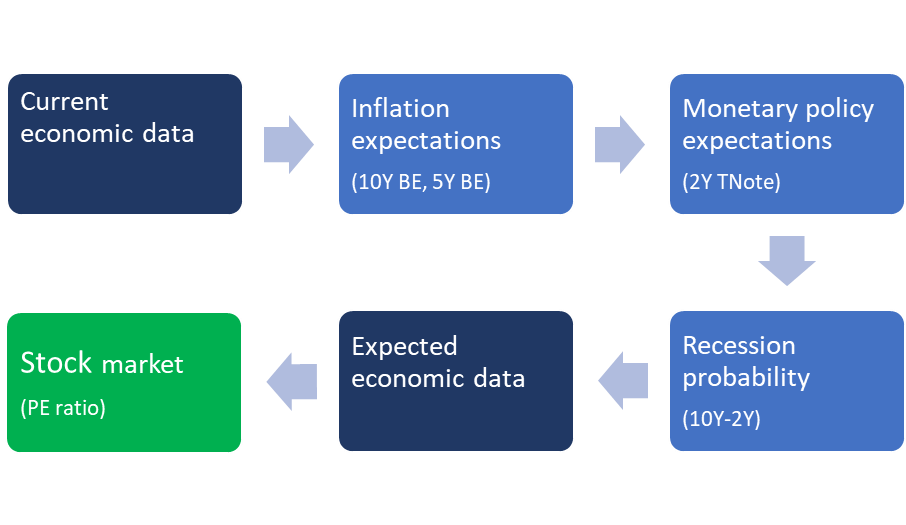
Essentially, stock market today is pricing the expected economic data (earnings data) within the visible time-horizon, usually 12-18 months in the future. The Price-to-Earnings ratio (P/E ratio) is the valuation metric and reflects:
- the earnings over the last 12 months, which are based on the current economic data (reported with the lag), and
- the S&P 500 index price, which is based on the expected earnings over the next 12-18 months, as derived from the expected economic growth.
Historically, S&P 500 has been trading at around 15-16 times earnings, which reflects an average annual economic growth of 2-3%. The P/E multiple expands when higher-than-average growth is expected, usually in early stages of the business cycle, and contracts when below average growth is expected. The valuation mismatch occurs when the P/E ratio is predicting a high growth, while other indicators point to a recession – that’s a bubble.
So, how to predict the future economic data? Within my fundamental model, the future economic data depends on the expected monetary policy, which is based on inflationary expectations. Thus, within this framework, the excessive monetary tightening (in response to rising inflation expectations) is likely to cause a recession.
Here is the fact: There were 13 Fed interest rate hiking cycles since 1945, and out of 13 interest rate hiking cycles, a recession occurred 10 times. Exceptions: 1994-95, 1983-84, 1965-66. I previously explained why I don’t think the “soft landing” exception will be possible in this current cycle. So, let’s look at each “box” within my model, to develop a case of an unfolding bear market in stocks.
Current data
The latest economic data shows a GDP growth of 6.9% in Q4 of 2021 over the Q4 of 2020, and 5.5% yoy. Further, the unemployment rate is at 3.6%, as of March 2022. Thus, we currently have an exceptionally strong economy with a full employment. However, currently inflation is also very high at 7.9% CPI.
Longer term inflation expectations
In this table, I present the nominal yield decomposition into real yields and inflation expectations. As you can see, the longer-term inflation expectations are possibly de-anchoring, with the 5-year inflation expectations well above the historically important 3% level, and the 10-year inflation expectations well above the 2.75% level.
|
Inflation expectations |
|||
|
Nominal Yield |
Real Rate |
BE Inflation Expectations |
|
|
5Y |
2.75% |
-0.65% |
3.40% – above 3% |
|
10Y |
2.70% |
-0.19% |
2.89% – above 2.75% |
|
30Y |
2.72% |
0.19% |
2.53% |
Source: Global Academic View
Thus, not only current CPI inflation is very high, but the longer-term inflationary expectations are rising as well – above the important resistance levels.
Expected monetary policy
The Fed has a clear mandate of price stability, which is currently defined as the 2% target (symmetric). However, currently, the CPI inflation is well above the 2% target, and more importantly, longer-term inflation expectations are de-anchoring, all pointing to the serious inflation problem.
Thus, the market expects the Fed to have a very aggressive monetary tightening in 2022 and in 2023. Here are the expectations based on the Federal Funds Futures:
|
Expected monetary tightening based on Federal Funds futures |
|||||
|
Current |
Jan 2023 |
Jan 2024 |
High |
First cut |
Jan 27 -terminal |
|
0.34% |
2.54% |
3.22% |
3.23% Aug 23 |
2.88% Dec 24 |
3.07% |
|
QE ended in March. QT starting in May – balance sheet reduction $95 bill/month |
|||||
Source: Global Academic View
Note, the Fed is expected to hike in total by 2.20% in 2022 with additional 0.68% in 2023, before the first cut in Dec 2024 by 0.35%, which is likely when the market expects the recession to start.
Recession probability
As previously stated, historically, the Fed’s interest rate increase campaigns usually produce a recession, which is predicted by the inverted yield curve. As you can see in the table below, the spread between to 10Y and 5Y TNotes has been inverted for some time, while the spread between the 10Y and 2Y inverted last week, and now slightly positive. Based on these inverted yield curves, the probability of a recession is very high, although not imminent, based on the 10Y-3mo spread, which is still positive.
|
Recession probability (last week value) |
||
|
10Y-2Y spread |
0.19% (-0.08) |
Inverted week of March 28th, now positive (QT) |
|
10Y-5Y spread |
-0.05% (-0.18) |
Still inverted – recession forthcoming |
|
2Y-3mo spread |
1.83 (1.95) |
An imminent recession not expected |
Source: Global Academic View
Expected economic data
Thus, given that inflation expectations are rising, and the expectations of a very aggressive monetary tightening, in the context of the flashing recessionary warnings, the future economic data will start to reflect the Fed-induced economic slowdown, with an eventual recession. However, the CPI inflation will likely remain persistently above the target. Here are the possible channels:
|
Economic data expectations |
|
Slower growth – eventually recession |
|
Higher interest rates – less credit consumption – lower sales (discretionary sector) Higher mortgage rates (10y) – lower housing prices (wealth effect – housing sector) Lower stock market and cryptocurrencies – wealth effect (less consumption) Russia sanctions and higher oil – lower consumption (as long as sanctions last) (energy) Longer-term: de-globalization leads to slower growth (less exports) |
|
Uptick in Unemployment |
|
Slower growth will lead to uptick in unemployment rate (lower demand) |
|
High Inflation to persist |
|
Higher oil (Russia) will keep inflation high (oil as well as other commodities) Longer-term de-globalization is inflationary. Pandemic related supply-chain bottlenecks still inflationary (China lockdowns). |
Stock market outlook
The P/E ratio usually doesn’t mean much, and it’s definitely not a timing tool. However, when there is a significant mismatch – when the P/E ratio is very high and predicting an above average growth, while the yield curve spread is inverted signaling a recession, in an environment of a very aggressive monetary policy tightening, the P/E ratio can signal a significant overvaluation and an imminent stock market correction. That situation is NOW!
Thus, given the current S&P 500 P/E ratio at 25, assuming a zero earnings growth and a very shallow recession after which the growth would return to about 2-3% average growth, S&P 500 could drop by 40% – just to be fairly valued. If you consider the inflation-adjusted CAPE 10 ratio currently at 36, S&P 500 could drop by more than 50% and still be fairly valued.
Investor implications
The point is S&P 500 (SPY) is significantly overvalued. But investors got accustomed to the high P/E ratios over that last 20 years – ever since the Fed lowered interest rates to the very low levels after the 2000 recession, and again after the 2008 recession, and again after the 2020 recession, sometimes pushing the real interest rates deeply negative, and printing trillions of dollars. Thus, if there is a very shallow recession, but the Fed again resorts to an extraordinary monetary stimulus after that recession, S&P 500 can remain overvalued – indefinitely.
But this time it really could be different – and the difference is inflation. Given the trend of accelerated de-globalization, the persistently high inflation is likely to prevent the Fed from aggressive easing next time around. Once investors realize that “the Fed put” is essentially gone, the long-awaited stock market corrective re-valuation will unfold. Passive long-term investing is not an option in such an environment.
Here is the pdf of the full report that this article is based on:
Be the first to comment