

The market has seen a lot of red lately and has had very few reasons to get excited….typical bear market stuff, really. Scott Olson/Getty Images News
By now it seems fair to assume that everyone agrees that we are now in a bear market as both the S&P 500 (NYSEARCA:SPY) and Nasdaq 100 (QQQ) have both fallen by over 20% (and in the case of the Nasdaq 100, over 30%) from their highs. It certainly feels like a bear market, with each rally quickly met with heavy selling and a general feeling of daily selling equating to Chinese water torture for one’s portfolio. It took a while to get here, but this has been a slow motion train wreck occurring in real-time.
We have had data points showing us what was coming (this article discusses a good analyst point made by BofA’s Savita Subramanian regarding real earnings yield on the S&P 500), but until the market came to the conclusion that the Federal Reserve had lost containment on inflation, many believed that companies would be able to weather moderately higher interest rates and higher inflation in the short-term.
Let’s look at some charts and data to set the stage before we discuss how we believe investors should position moving forward.
Interest Rates
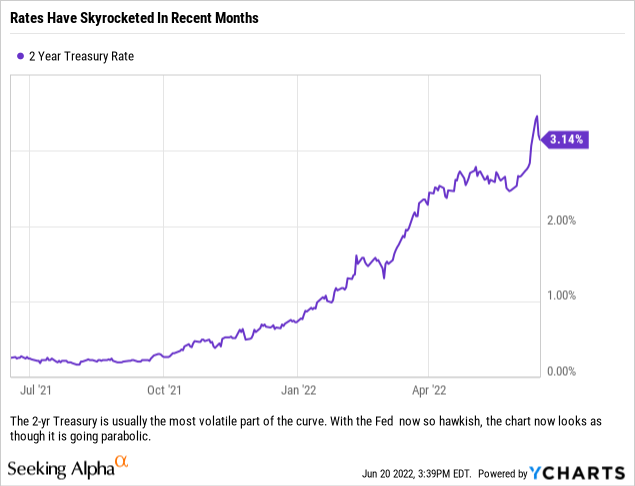
The rate on the 2-yr US Treasury is about 10x what it was back in September and October of 2022. As scary as the rates look on the chart above for the 2-yr Treasury, even scarier is the fact that certain tenors’ rates on Treasuries would seem to indicate that we have maybe seen the Great Bond Bull Market finally end (as the chart below of the 10-yr Treasury Rate potentially shows). If the era of ever lower interest rates has ended, that could spell bad news for the economy and particularly companies that rely on debt to perform financial engineering.
Have rates finally broken through the trend? (Ycharts)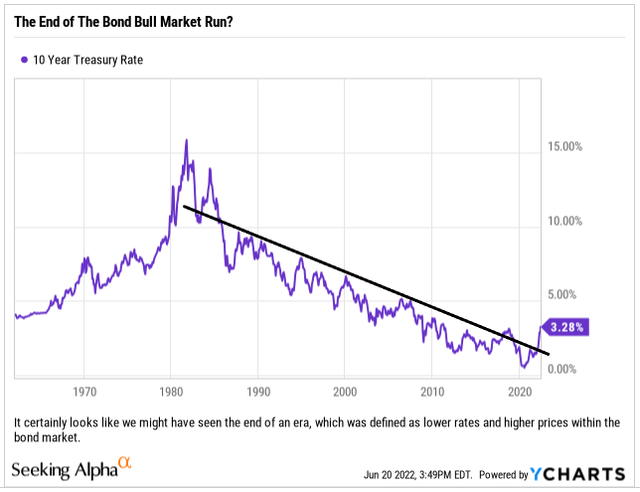
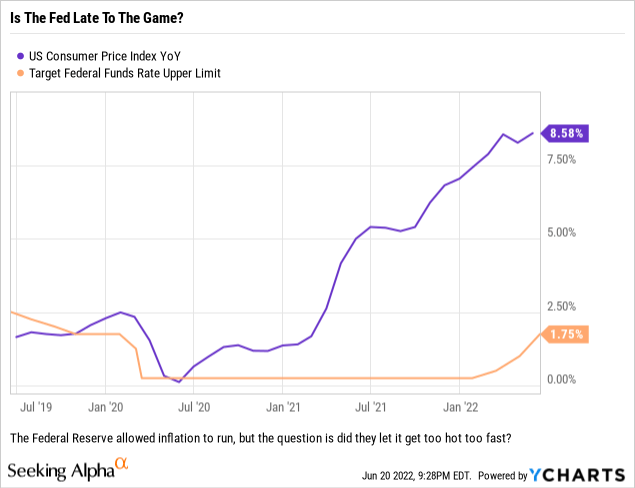
Rates have risen sharply as inflation has steadily risen after many of the states that were still closed with COVID restrictions finally relented and opened up more of their economies. With all of the cash households had accumulated, along with additional government aid in the forms of higher subsidies and a moratorium for student debt repayment, inflation ramped up around March 2021 and kept rising. The Fed failed to make any significant moves until 2022, so the question is how they play catch-up now that they let inflation possibly get a one year head start on them.
Who’s In Charge Here?
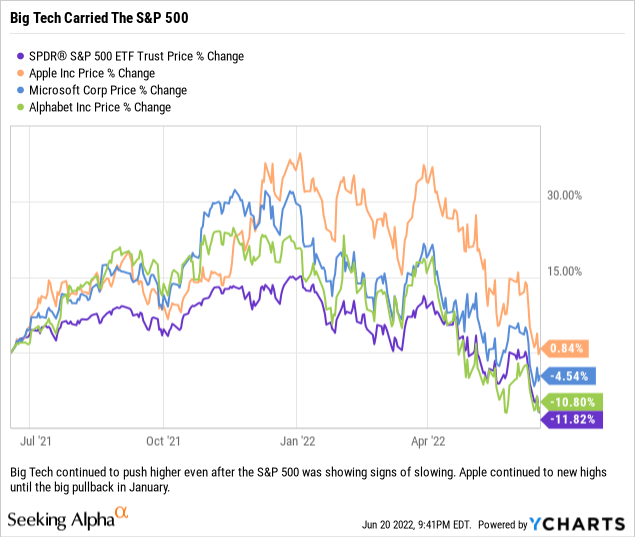
What many fail to recognize when placing capital to work in index weighted ETFs or model portfolios is that the benchmark indices are for the most part market capitalization weighted; and therefore can, at times, be heavily influenced by the largest companies in the index. The below chart does a good job of showing how some of the largest stocks in the S&P 500 carried the index to fresh highs into 2022, and then saw the index turn lower as each of these names rolled over. Note, the largest company by market capitalization, Apple (AAPL) was the last one carrying the S&P 500 to fresh new highs. Was the tail wagging the dog here?
However, for those who were not passively focused at the time, cracks were appearing in the S&P 500 constituency well before January across various names in different industries. Notice in the chart below, we highlight some large, healthy companies whose stocks topped out in advance (sometimes by months) of the high water mark for the S&P 500. Also, on this one year chart, not one of these blue chip names was at their 52-week high in January 2022, and only Nike (NKE) was still positive for the year at that point (and still outperforming the market as well).
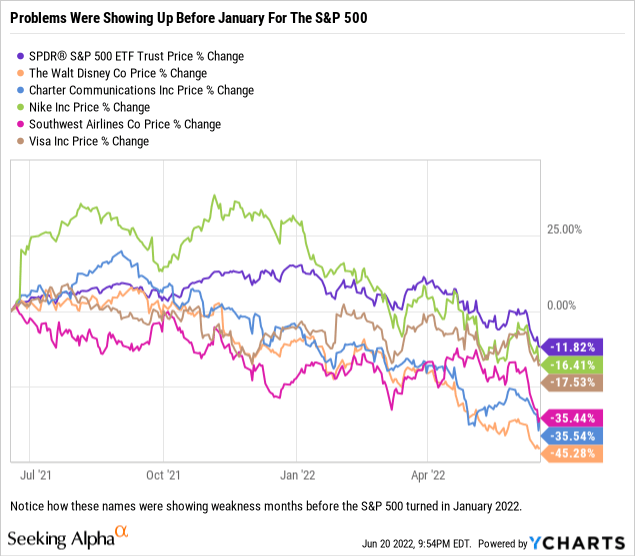
Sure, one could argue that the sample of names in the above chart could be changed and you would get a different outcome, but we are trying to point out that past winners had been showing weakness before January and even companies who were outperforming the market were no longer hitting fresh new highs with the market.
But Within This Pullback, At Least One Major Bull Move
Even in the worst of markets, if you look below the surface you can find capital finding safe harbors and potentially better trades.
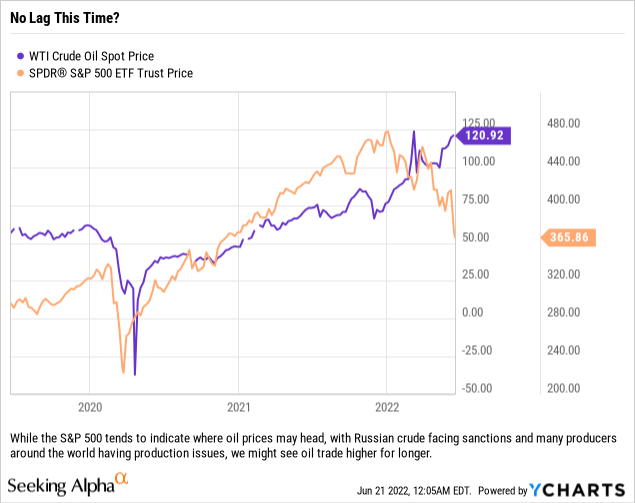
Oil may have been signaling some issues in late 2021, but prices have been turbocharged since Russia invaded Ukraine and the US and its allies (namely the EU) began cutting back on crude imports and natural gas from Vladimir Putin’s Russia. There have also been issues with production in other parts of the world, including South America, which has continued to put pressure on energy supply chains as both consumers and producers are forced to find new markets.
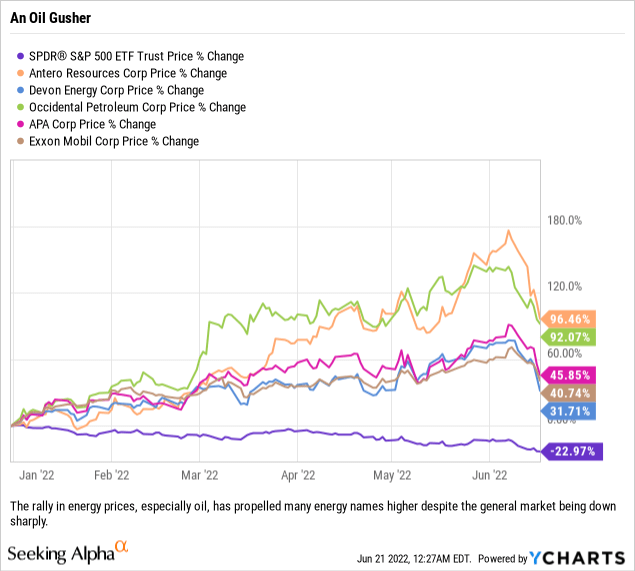
This is not just outperformance on the margin, or a situation where investors are seeking a place to protect their capital; this is an impressive display of exceptionally strong outperformance. This is a bull market, and if companies are willing to lock in some of these prices via new hedging programs as some of their previous hedges roll off, we think that these names could continue higher, especially with the newfound financial discipline in the industry. Couple that with debt repayment, share repurchases and dividends and the story potentially gets better.
So What Is An Investor To Do?
In our opinion, investors might be best served by reallocating some capital from passive strategies to more active strategies. Now we are not advocating for shifting to trading, but simply moving from owning everything to owning names which have strong fundamentals, solid balance sheets and histories of dividends and smart share buybacks. Rather than own everything, which includes the junk you do not want to own, we think owning only your top names within the index might be the prudent way to play this market while positioning your portfolio for whenever the market does eventually turn higher. Being overweight on allocations is not necessarily a bad thing, and if it helps investors avoid having to own exposure to stocks one would expect to head lower, then this small adjustment can create significant outperformance.
We have pointed out (article located here) how we believe that financials will do well with the market volatility and clients doing more volume via more transactions with the trading desks. With the Fed aggressively moving rates higher, Bank of America (BAC) certainly looks like it could be a winner, and while we would not be buyers of Wells Fargo (WFC) just yet, if they can ever get their house in order and find new ways to make money off of their large customer base, then it certainly would be a good play as well. Both of these names should do decently well in the Fed’s Stress Test that will be released June 23, and if you are of the opinion that Wells Fargo will fare well and have excess capital to return to shareholders due to their growth restrictions, then that might be the only scenario we would look to play for that name.
Companies paying down debt should also be attractive, because as they use their cash flows to pay down debt, they then free up cash flow in future years while simultaneously eliminating re-issuance risk (having to roll that debt into new issuance which would be at much higher interest rates). This was part of the reason we liked Warner Bros. Discovery (WBD) and discussed it previously (article located here). That stock has only gotten cheaper since we discussed it, but the story has not changed and we do like the deleveraging story moving forward.
For conservative investors there is low hanging fruit to be had. We also see an opportunity for investors to take advantage of the Fed’s move by paying more attention to the sweep functions on their brokerage accounts and making sure that they are utilizing government/treasury money market sweeps rather than FDIC insured sweeps. Banks are keeping rates paid to depositors at zero, or close to zero, as they do not really want deposits right now, so utilizing sweeps and investing excess cash in money market funds can generate a little alpha by doing just a bit more work and taking on risk at the margin. Adding 100+ basis points in some cases is not a bad thing, and money market funds, because they are so short and liquid, provide additional upside in yields should the Fed continue to raise rates. If the Fed moves another 75 basis points in July, then you could see some money market funds returning almost 200+ basis points depending on their guidance moving forward and where inflation data is telling us where the Fed might be in their rate hike cycle.
Be the first to comment