

FINTWIT ANALYSIS
- XAU/USD may be in for end of year rally.
- Natural Gas upside may continue as 2021 draws to a close.
- Potential for NDX pullback as QE taper looms.
GOLD CLIMBS DESPITE STRONGER DOLLAR
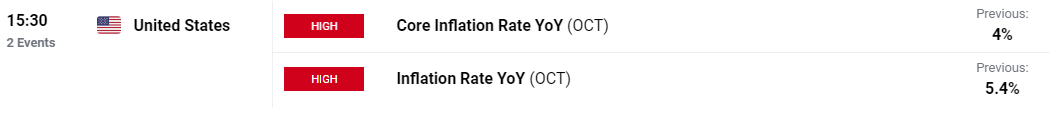
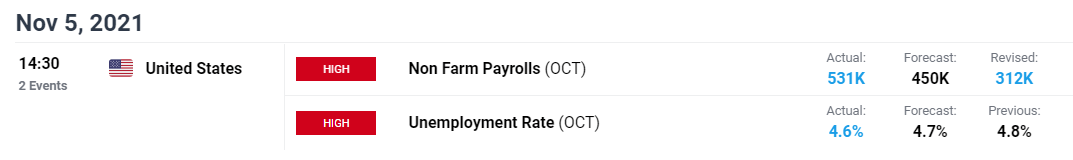
Spot gold has been testing the critical $1800 area of confluence since September and may succeed after an unexpected dovish announcement by the Fed supported higher gold prices. Today’s better than expected Non-Farm Payroll (NFP) print (see calendar below) initially weighed down spot gold prices but has since pushed back to pre-announcement levels. Sticky inflation as eluded to by Fed Chair Jerome Powell has likely bolstered gold support as an inflation hedge – persistent inflation. Next week, U.S. inflation data is scheduled which could give markets some guidance on the December Fed policy statement. A higher then estimated figure could lead to lower gold prices as potentially hikes may be brought forward.
Source: DailyFX economic calendar
XAU/USD DAILY CHART
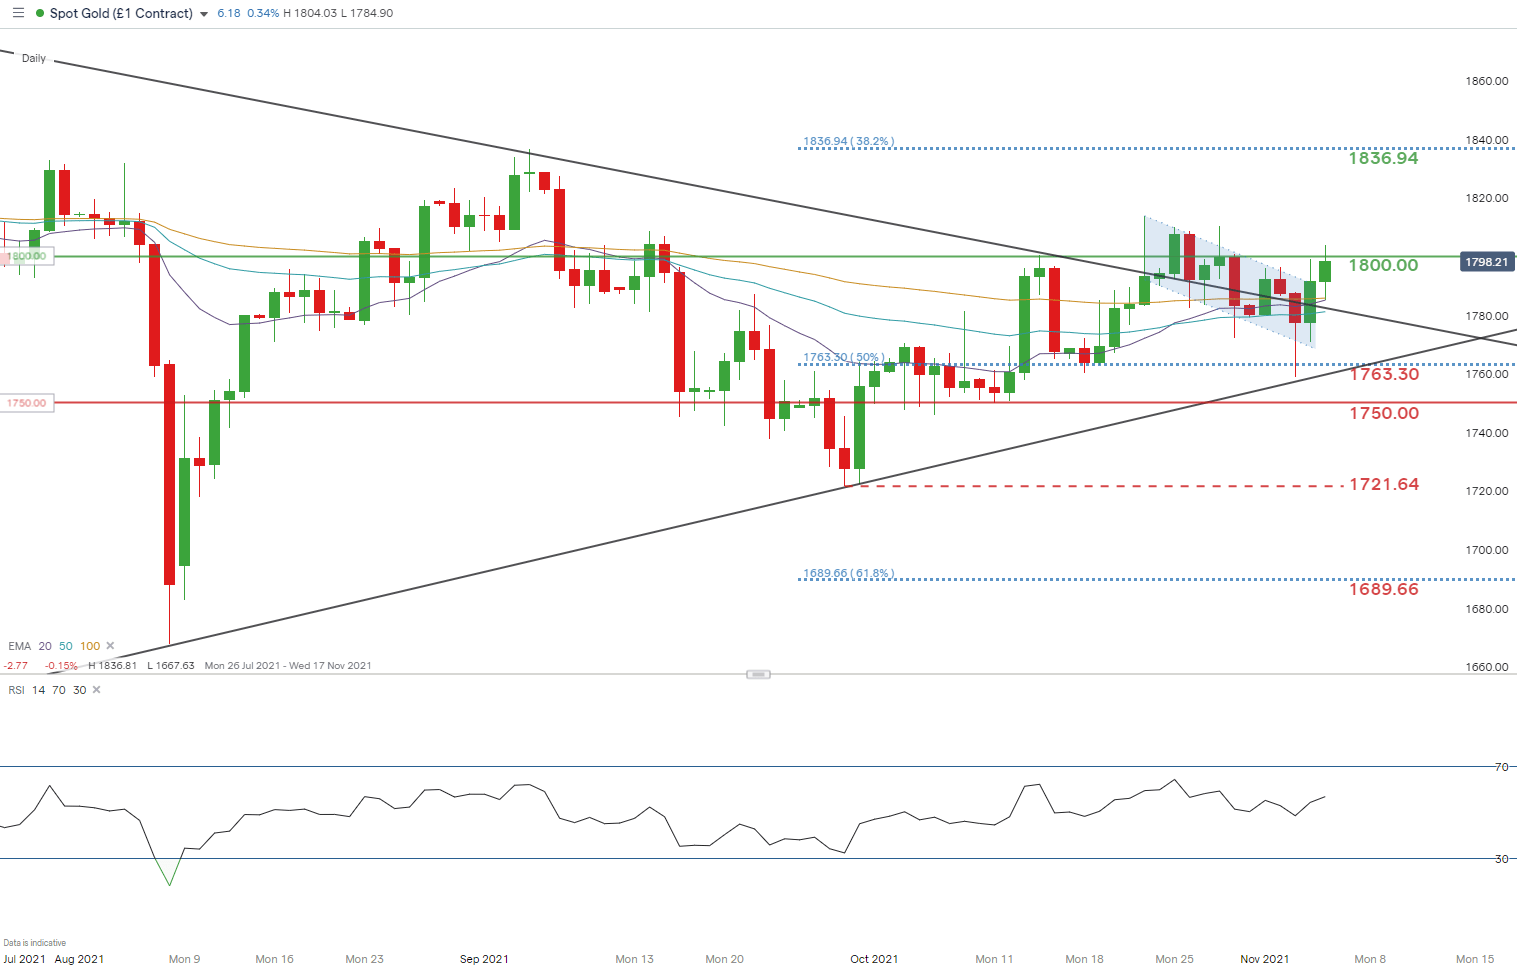
Chart prepared by Warren Venketas, IG
Gold has been displaying signs of a bullish continuation as reflected by the bull flag chart pattern (blue). Today’s break above flag resistance will be watched with keen eyes as a confirmation candle close above the key $1800.00 psychological level may signal a push higher towards the $1836.94 (38.2% Fibonacci) level.
Key resistance levels:
Key support levels:
NATURAL GAS REMAINS FUNDAMENTALLY BULLISH
2021 has been a standout for natural gas showing the most significant gains (see graph below) from any other commodity. Primarily boosted by the European gas prices as will as other inflationary factors like rising shipping costs. The outlook for the remainder of 2021 is likely to see high LNG prices as weather conditions and global demand favor sustained elevated prices.
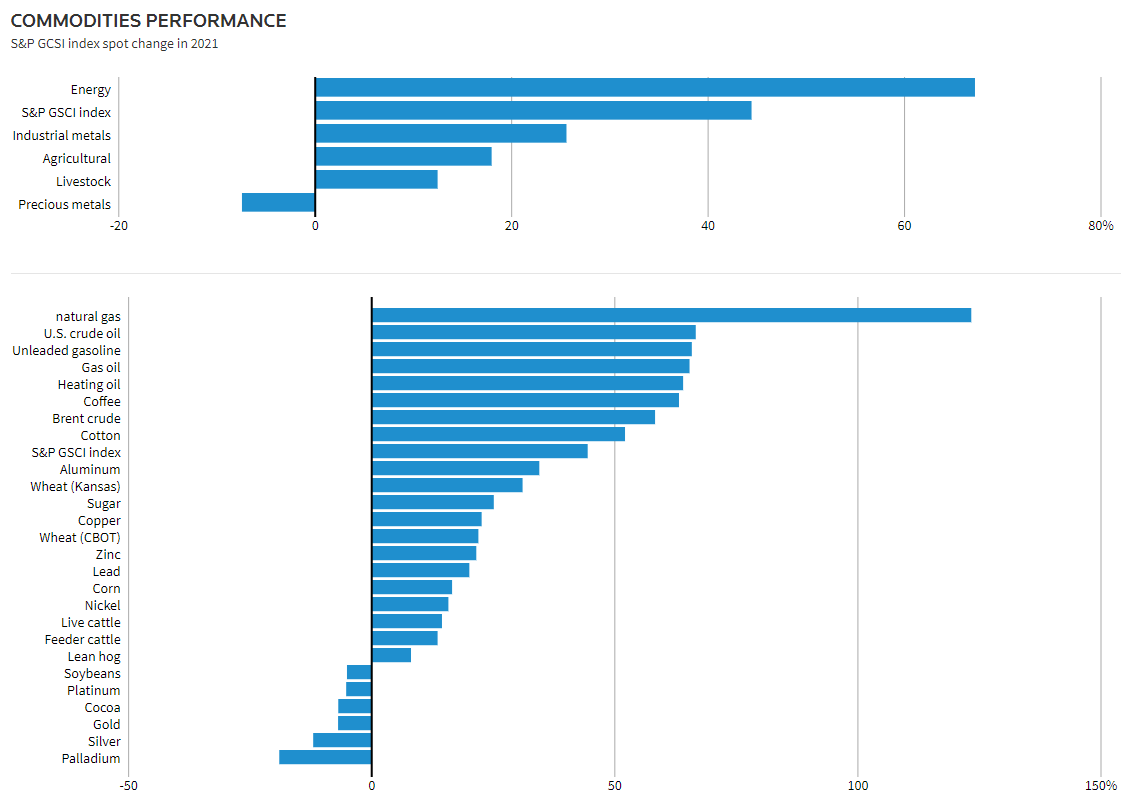
Source: Reuters
Weather in the U.S. is expected to get cooler over the November and December period (see graphic below) which should increase the demand for U.S. LNG over the coming weeks.
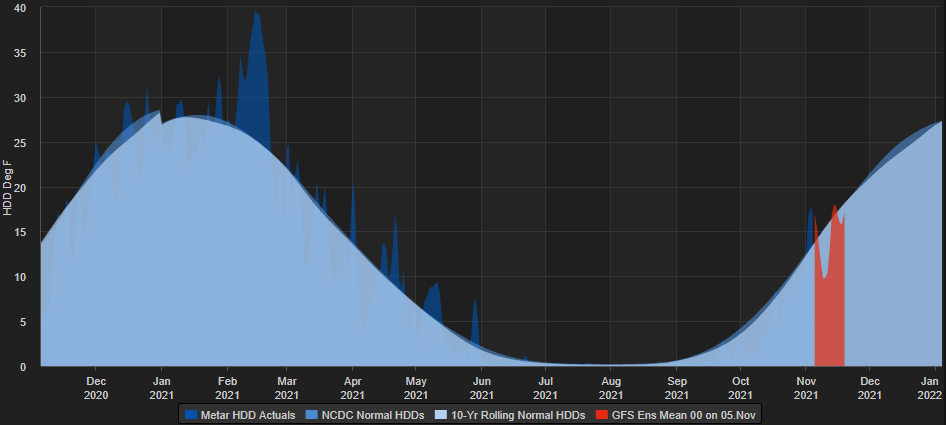
Source: Refinitiv
Demand has been soaring since mid-2021 and we can see European exports (blue) still holding firm despite abating exports. Weather forecasts in Europe should keep this figure from dwindling in the short-term along with lofty European gas prices.
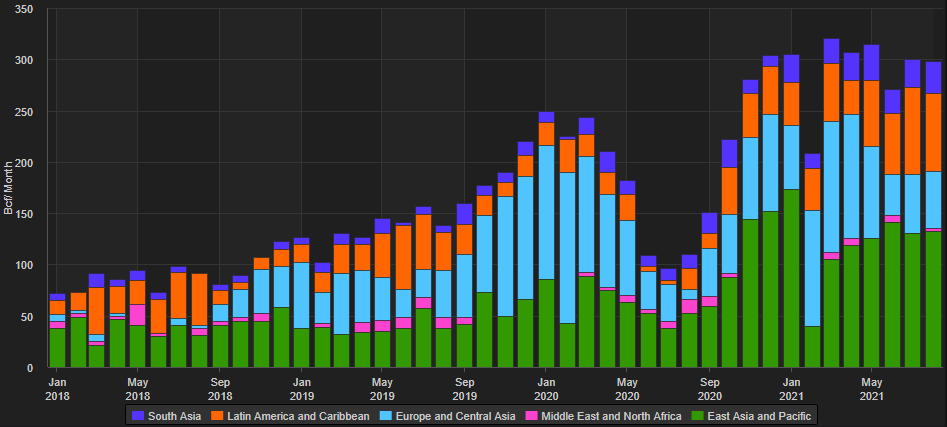
Source: Refinitiv
After yesterdays inventory data released by the U.S. Energy Information Administration (see below) which revealed higher U.S. LNG stocks across the board, prices have slipped but with the above fundamental drivers in play, this may be a temporary pullback.
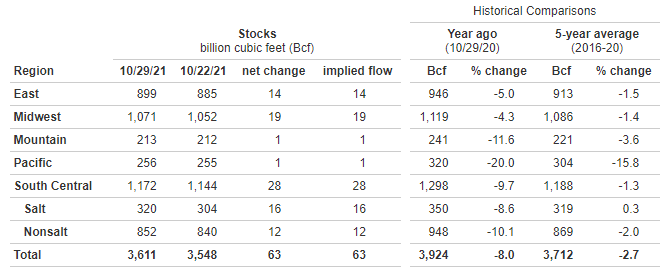
Source: EIA
NATURAL GAS (HENRY HUB) DAILY CHART
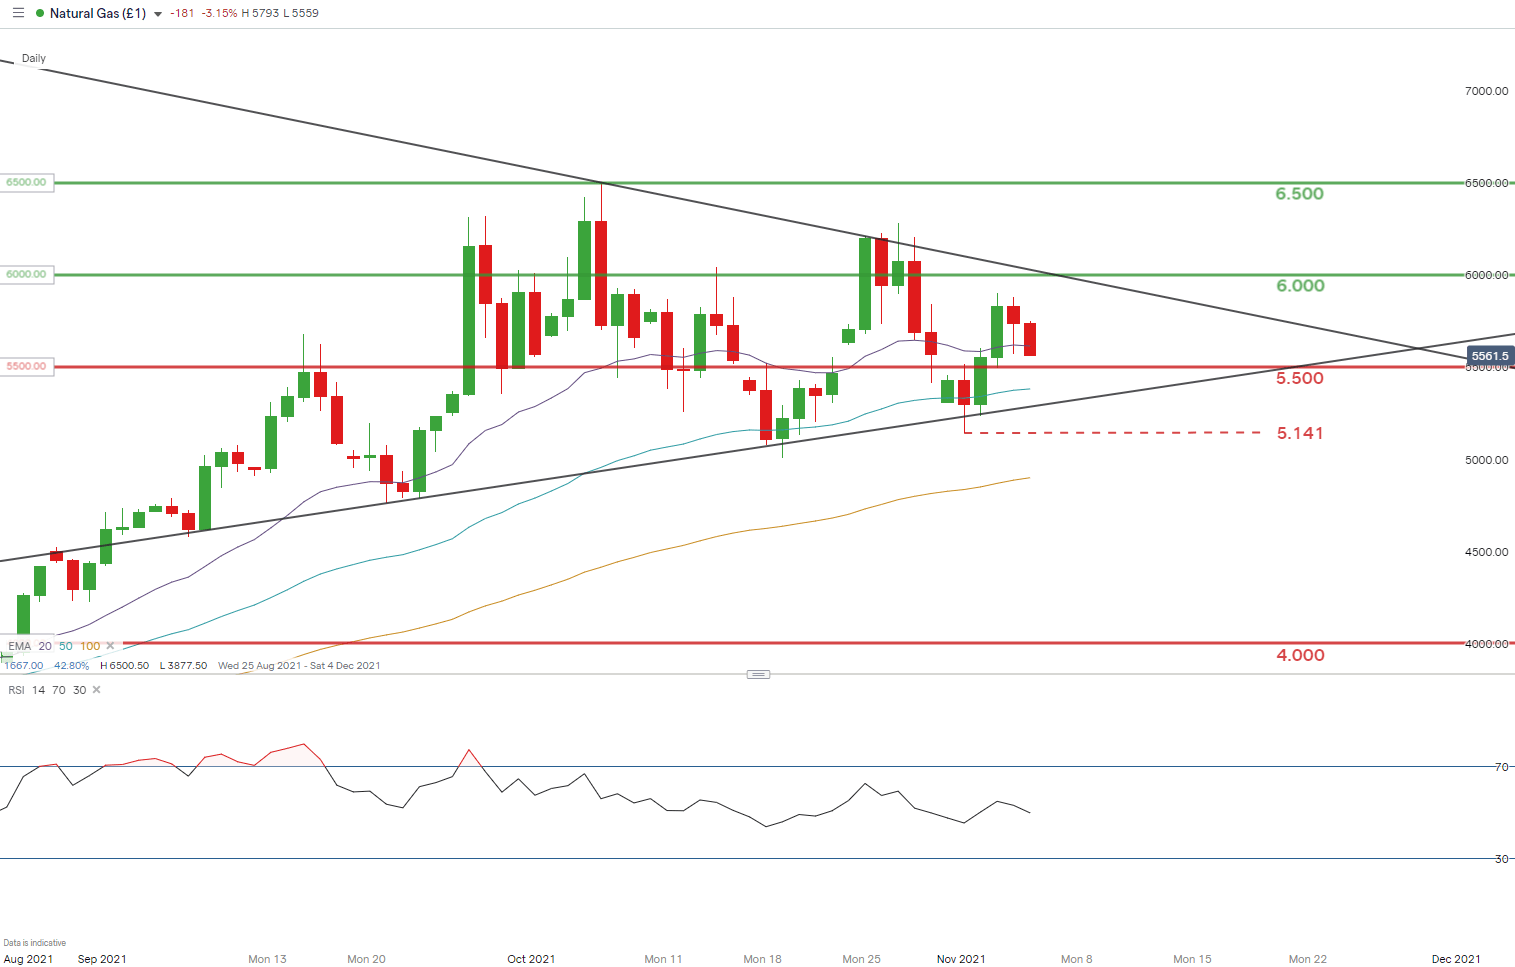
Chart prepared by Warren Venketas, IG
The daily LNG chart above shows a consolidatory move as prices converge within the medium-term symmetrical triangle pattern (black). Prices are coiling and prepping markets for a breakout above or below the triangle trendlines. Fundamentals point to additional bullish upside which may unfold should prices breakout of triangle resistance. The 6.000 level will likely coincide with a bullish breakout which will open up room for a resistance target at 6.500. The same would apply for a push lower whereby subsequent support targets will come into consideration.
Key resistance levels:
Key support levels:
POSSIBLE CORRECTION ON HEAVILY OVERBOUGHT NASDAQ COMPOSITE INDEX
After the Fed announced that tapering would begin later this month at a pace of $15bn per month which can be adjusted if needed, the Nasdaq index continued to rally pushing to all-time-highs. Markets are currently dismissive of the soon-to-be ‘less’ accommodative environment for U.S. stocks as earnings season continues to take the limelight. Post-earnings, and while markets have come down from their present euphoric state the NDX may likely pullback to lower levels. The falling U.S. 10-year Treasury yield is giving the index further upside impetus as tech valuations generally improve on the back off lower yields. Once the Fed becomes more hawkish and potentially looks to reveal their rate hike path in 2022 (data dependent) I believe the amendment lower is extremely likely to reveal itself.
Boost your stock market knowledge with our articles on the types of stocks available, how equities impact the economy, and getting started with stock trading.
NASDAQ100 INDEX (NDX) DAILY CHART
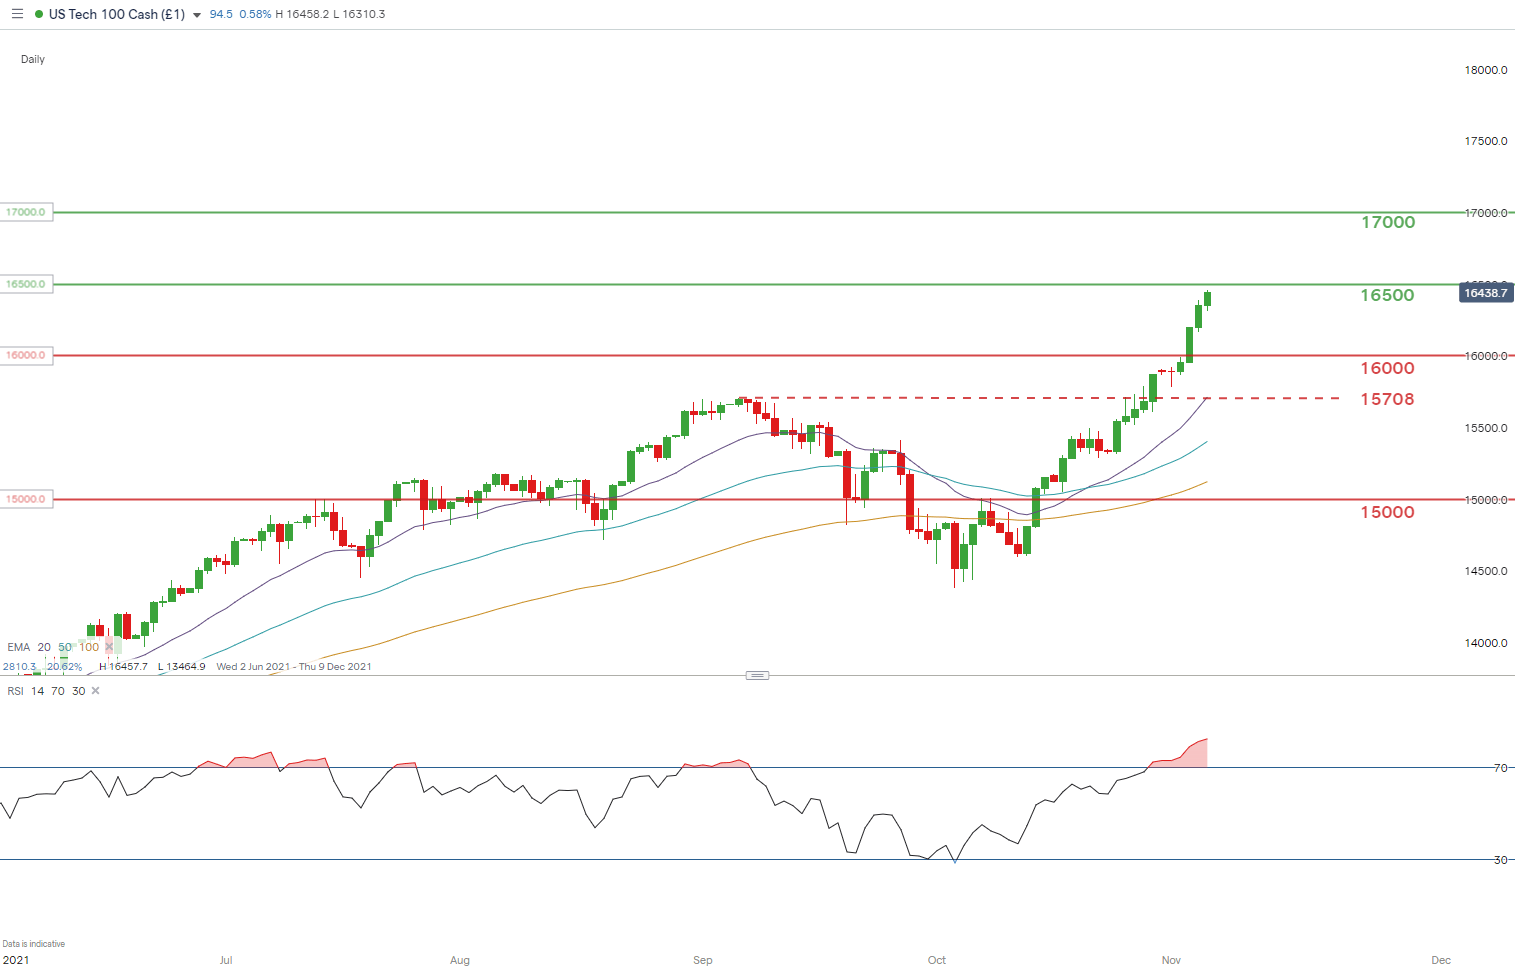
Chart prepared by Warren Venketas, IG
Price action on the NASDAQ 100 reflects the recent rally during the U.S. earnings season resulting in an extremely overbought signal made known on the Relative Strength Index (RSI). From the bearish perspective, reversion towards the mean is likely in the short-term which could potentially bring the 16000 horizontal level into play.
Key resistance levels:
Key support levels:
- 16000
- 15708 – September swing high concurring with 20-day EMA (purple)
— Written by Warren Venketas for DailyFX.com
Contact and follow Warren on Twitter: @WVenketas
Be the first to comment